In this era of globalization of the work force, the United States has become a country with a split personality. On the one hand, we continue to lead the world in innovation driven by a strong college and graduate education system (15 of the 20 top rated universities in the world are in the U.S., according to the Times Higher Education World rankings), a large population of risk-taking entrepreneurs, an influx of hard working, talented immigrants and the strength of the Venture Capital industry. This innovation is responsible for creating many jobs, as can be seen at the likes of Google, Apple, Tesla, Amazon, Facebook, LinkedIn, Twitter, Uber and many more rising stars.
On the other hand, we have failed as a country to remain competitive across the workforce. As a result, despite the many jobs created by innovators, the workforce as a portion of the population is contracting and currently is barely above recession level lows. Although this month’s jobs report suggests the employment picture is improving, it’s a mistake to think the falling unemployment rate from the January 2010 recession high of 10.6% to a recent level of 5.8% in February 2015 is proof the economy is healthy once more[1] . While the 2007 pre-downturn level was a much lower 4.3%, the degree of failure to recover is considerably bleaker than the current 5.8% level versus the pre-recession 4.3% difference would indicate.
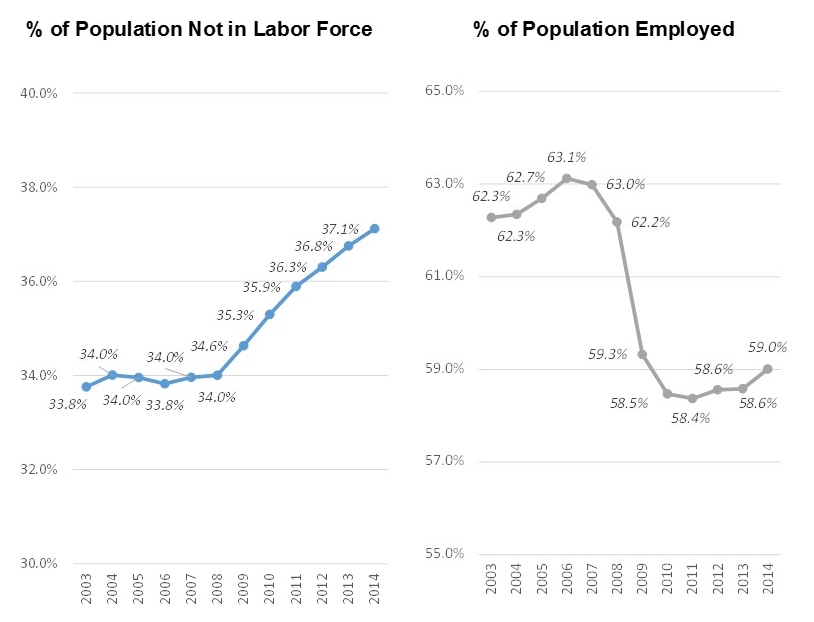
Employment Rather than Unemployment is a Better Measure of Economic Health
The employment rate (the percentage of the population that has a job) is a far better indicator of the health of the economy than the unemployment rate (the % of those seeking jobs that don’t have one). People with jobs are what supports the economy and the mere fact that someone removes themselves from the workforce does not make the economy healthier. In fact, the percentage of the population that is not in the labor force is at its highest level in 36 years. In both January and February 2015, the seasonally unadjusted labor force participation rate was 62.5%. That means that 37.5% were not participating in the labor force[2] . The last time the labor force participation rate sunk to these levels was in 1978, when it was 62.8%. At that time, interest rates were soaring and the prime rate peaked at 11.75% later that year.
In 2007, 66.0% of the population was in the workforce (that is, sought a job) and 95.4% of those had a job, meaning 63.0% of the population were employed. In 2010, 64.7% of the population was still in the work force and 90.4% of those had a job, meaning that 58.5% of Americans were still employed during the lowest period in the downturn. How much of the 4.5 percentage points (or 450 basis points) loss of employment has been recovered? In 2014, only 62.9% of the population was in the workforce. So, despite the shrinkage in the unemployment rate (which was mostly due to fewer people seeking jobs), we now have 59.0% of the population working, a 50 basis point improvement from the low point of the recession. But there was a 450 basis point shrinkage in employment during the recession, so a 50 basis point improvement hardly qualifies as a true recovery!
The Law of Unintended Consequences Often Plagues the Best of Intentions
Our federal and state governments frequently pass laws that are intended to help workers. But often the cost to employers of fulfilling these new obligations has unintended consequences as added expense drives reaction. Examples:
1. Increase minimum wage: reaction by many employers is to replace domestic workers with ones in other countries and/or to increase the use of automation, reducing the work force. Although there are conflicting data on the impact of a minimum wage increase on unemployment, a 2013 study by the AAF found that a $1 increase in the minimum wage was associated with a 1.5% increase in the unemployment rate and a 0.18% decrease in the net job growth rate.
2. Taxing companies repatriating cash from abroad at high rates: Reaction by many corporations is to decide not to repatriate the cash and, instead, to re-invest it by expanding operations in other countries instead of in the United States, causing a loss of potential jobs here.
3. Cities controlling the number of taxis allowed (through requirement to purchase a medallion): Leading to the success of Uber as unavailability of sufficient numbers of cabs during high requirement periods causes a massive conversion to Uber and a loss of income for taxi drivers.
Why is the economy failing to recover to prior levels? My belief is that the combination of the Affordable Care Act (a $2,000 cost per employee), increasing minimum wages and strong competition from abroad have all contributed to the problem. Furthermore, they have not only held back employment increases but also pushed the part-time portion of the workforce to about 19% (it was 13.5% in the late 1960s and between 17% and 18% in the early 2000s).

Finally, while our college and graduate education is outstanding, the U.S. K-12 education ranks quite low amongst nations:
1. 36th in mathematics for 15 year olds[3]
2. 24th in reading for 15 year olds[3]
3. 28th in science for 15 years olds[3]
4. 14th in cognitive skills and educational attainment[4]
5. 11th in fourth-grade mathematics and 9th in eighth-grade mathematics[5]
6. 7th in fourth-grade science and 10th in eighth-grade science[5]
Much of our priority as a country tends to emphasize short-term gratification over long-term issues like investing in primary education. If we make workers more expensive than in other parts of the developed world through requirements of expensive benefits, high minimum wages, heavy taxation, etc., then we need to make sure they are more skilled through better education and training. One of the policies that helped offset this in the past is prioritizing ease of immigration for those at the high end of the spectrum who could help create jobs.
If we fail to change our approach going forward, I continued to be concerned for America’s long-term future.
[1] Unemployment Rate (Not Seasonally Adjusted), United States Department of Labor, Bureau of Labor Statistics, http://data.bls.gov/timeseries/LNU04000000
[2] http://www.bls.gov/news.release/pdf/empsit.pdf
[3] Organization for Economic Cooperation and Development (OECD), Program for International Student Assessment (PISA). 65 educational systems ranked.
[4] Pearson Global Index of Cognitive Skills and Educational Attainment compares the performance of 39 countries and one region (Hong Kong) on two categories of education: Cognitive Skills and Educational Attainment. The Index provides a snapshot of the relative performance of countries based on their education outputs.
[5] International Study Center at Boston College. Fourth graders in 57 countries or education systems took the math and science tests, while 56 countries or education systems administered the tests to eighth graders.
Soundbytes:
– It will be interesting to see what the impact of the largest salary-cap jump in league history will be on the 2016-17 season. For example, LeBron James could take his salary from about $22 million next season to around $30 million if he signs for the maximum salary in 2016. This could have significant implications for many free agents and there might be those who accept only one-year contracts so they can retest the market in 2016, when there is more money available.
