Mike Kwatinetz is a Founding General Partner at Azure Capital Partners and a Venture Capitalist investing in application software (SaaS), ecommerce, consumer web and infrastructure technology companies. Successful exits include: Bill Me Later, VMware, TripIt and Top Tier.
A friend called me the other day and inquired as to whether I was ok, as I had not posted in several months. While my goal has been to do about 10 blog posts per year, my frequency has always been erratic, and this year has really been sparse. To make things up, I am going to try for 2 new posts in the next 3 weeks or so that stem from the Azure Marketing Day, held each year for our portfolio companies to gain exposure to advanced techniques across multiple marketing areas. Since the speakers are truly knowledgeable of their arena, using one or two talks as a basis of a post makes me look good!
This post will focus on branding and how to measure whether it is working. The next will delve into direct (snail mail) marketing and how some companies are finding it quite effective.
How to measure the efficacy of brand campaign spend
Spending on branding is quite different than spending for customer acquisition. While many ads serve both purposes, the difference is based on whether there is a direct call for action…usually to buy something. For simplicity, I assume that if there is a call for action, the ad is for customer acquisition, if there is no call for action the ad is for branding.
By improving their brand, a company can experience:
Higher conversion rates on its customer acquisition spend
An increase in the number of people who visit their site
An increase in the LTV (lifetime value) of customers
One method of measuring whether a branding campaign is effective is to determine whether people in the geography where the marketing takes place become more aware of the brand. This is done by measuring the awareness of the brand both before and after the campaign. The most common measure for younger companies is called “Aided Brand Awareness”. Aided brand awareness is determined by conducting a survey of a statistically significant random sample of the population of the geography. In the survey, each person is asked to say which of a list of products/companies they recognize. The percentage that picks the product or company as one they know of is designated as the Aided Brand Awareness. Most TV ads are for improving brand awareness, whereas a large proportion of online ads are for customer acquisition.
While it may seem surprising now, when I was on Wall Street covering Microsoft (and others), Bob Herbold, Microsoft COO, believed a lack of universal brand awareness was limiting the company. So, Microsoft engaged in a significant spend to raise its brand awareness from well below 50% (as I recall) before the campaign. It was one of the many smart strategies the company used to become what they are today. An improved brand helped drive a massive gain in market share for Microsoft productivity applications.
At the Azure Marketing Day, Chris Bruzzo, EVP Marketing and Commercial at Electronic Arts, provided a session on the importance of branding. He outlined one method of testing the potential effectiveness of a branding campaign without breaking the bank. He suggested, if possible, to start by picking matched geographies for a test. You then conduct the branding campaign in the test location and compare results to the control (the second location). By limiting the test to a few geographies, the cost can be kept reasonable while acquiring information on how much impact a branding campaign could have on your company. EA found advertising to improve its brand was quite effective. While I can’t cite EA data due to a public company’s need for confidentiality, I can say it led to higher customer Life Time Value and an increase in the success of customer acquisition campaigns in the test geographies. I have been given permission to review a similar test conducted by Azure portfolio company Chairish.
Chairish recently conducted a test of whether spending on branding would prove beneficial. They decided to select 3 cities for the test. For confidentiality, I’ll refer to them as Test Cities 1, 2 and 3. Each was measured against a control city where no branding spend was done. The paired cities, control cities 1, 2 and 3, respectively, each had similar population demographics to the test city it was paired with. The first measurement of benefit was the change in Aided Brand Awareness. Pre-campaign the test cities averaged 6% awareness and the control cities 8%. Post campaign the test cities increased to 13% awareness and the control cities to 9%. So, the lift for the test cities was 7% and for the control cities 1%. I believe that the control cities represented the natural gain the company was getting without a branding campaign, while the branding campaign added an additional 6% of the population to those aware of its brand.
Comparing Test Cities to Control Cities for Branding Campaign
The table shows the average benefit of the marketing campaign across the test cities when compared to their matched control. For example, during the test period the increase in average overall revenue was 23% greater in the test cities than in their paired control locations. A month later, the difference in gain had improved to 25.8%. The reason for such large revenue gains stems from some of the other metrics measured, especially the massive gain in registrations because of the branding campaign.
Given these results, Chairish will be increasing its spend on branding. For those of you who decide to try a branding campaign, it is important to make sure you can measure results. Once the results are in hand, the next step is to compare revenue and gross margin dollar gains to the cost of the campaign. This allows a company conducting a branding campaign to understand the initial incremental cost and the time to recover the investment. Having that in hand allows for a reasonable forecast of the cash flow implications of increasing the spend for branding. One caveat is, while hard to forecast, there is also often the benefit of an increase in customer LTV (life-time value) as greater awareness of the brand also spurs more visits (and spend) from existing customers but this is more difficult to measure in the short run.
While mature companies typically spend a portion of advertising on branding and conduct these types of Aided Brand Awareness measures many younger companies do not consider this. As companies cross the $20-30 million threshold, we believe they should consider experimenting with a brand spend in the manner discussed in this post. Many will find that it is another valuable tool to use as part of marketing spend.
“Much of the public dialogue concerning the economic effect of Covid19 has centered around the large number of people who have lost income, with the conclusion that the US will potentially experience a continued recession going forward. What seems to be lost in the discussion is that the 90% of the labor force that is employed is saving money at an unprecedented rate. This has occurred partly through fear of future loss of income but mostly by a reduction in spending caused by the virus.”
We estimated that consumers would save trillions of incremental dollars if Covid lasted through year end. And that a large portion of it would subsequently be spent on furniture, luxury items, vacations and more. This is now occurring, leading to substantial increased demand for many goods and services and inflationary pressure.
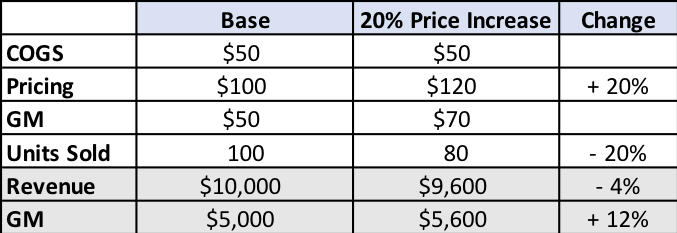
The pressure of this increased spend coupled with continued supply chain issues due to Covid provides the opportunity to keep prices firm (or even increase them) as demand will outstrip supply in many sectors, possibly through year end.
I wanted to start this post by repeating something I discussed in my top ten lists in 2017, 2018 and 2020 which I learned while at Sanford Bernstein in my Wall Street days: “Owning companies that have strong competitive advantages and a great business model in a potentially mega-sized market can create the largest performance gains over time (assuming one is correct).” It does make my stock predictions somewhat boring (as they were on Wall Street where my top picks, Dell and Microsoft each appreciated over 100X over the ten years I was recommending them).
In the seven years we have been offering stock picks on this blog this strategy has worked quite well as the cumulative gains for my picks now exceeds 21X and the 7-year IRR is 55%. The two stocks that have been on the list every year, Tesla and Facebook, were at the end of 2020 at 77X and 11X, respectively, of the price I bought them in mid-2013. They both have been on our recommended list every year since but this is about to change.
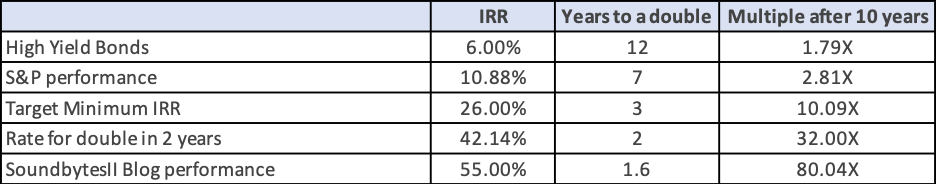
In last year’s Top 10 list I pointed out that my target is to produce long-term returns at or above 26%. At that rate one would double their money every 3 years. Since the S&P has had compound growth of 10.88%/year for the past 7 years, and Soundbytes has been at 55%, I thought you might find it interesting to see how long a double takes at various levels of IRR and what multiple you would have after 10 years for each one.
Table: Compound Returns at Various Rates
The wonder of compounding is quite apparent in the table, but it also shows that patience is a virtue as holding the stocks of great companies longer can multiply your money significantly over time, while too many investors become inpatient and sell prematurely. In our last post of 2020 we outlined the thinking process to select great companies, but even great companies can have some periods where their returns are below par. Given that our picks were up an average of 259% last year, I’m back to a fearful mode that 2021 might be that period. Of course, I’m always fearful but sticking with great companies has worked out so far and trying to time when to sell and buy back those companies often leads to sub-optimization.
To some extent, over a 5-year period or longer, stock appreciation is correlated with a company’s growth. So, as I go through each of my 6 stock picks, I will discuss what that might mean for each company. With that in mind, as is my tendency (and was stated in my last post), I am continuing to recommend 5 of the 6 stocks from last year: Tesla, Zoom, Amazon, Stitch Fix and DocuSign. I am removing Facebook from the list and adding CrowdStrike. To be clear, I still believe Facebook will outperform the S&P (see Pick 7 below) but I also believe that over the next few years CrowdStrike and the 5 continuing stocks will experience greater appreciation.
2021 Stock Recommendations:
1. Tesla stock appreciation will continue to outperform the market (it closed last year at $706/share)
Tesla is the one stock in the group that is not trading in synch with revenue growth for a variety of reasons. This means it is likely to continue to be an extremely volatile stock, but it has so many positives in front of it that I believe it wise to continue to own it. The upward trend in units and revenue should be strong in 2021 because, in addition to continued high demand for the model 3:
China Expansion: Tesla continues to ramp up production in China, the world’s largest market. In 2020 the company sold about 120,000 cars (which placed it a dominant number 1 in battery powered cars) there as its Giga Factory in Shanghai ramped up production. Trade Group China Passenger Car Association predicts that Tesla will sell as many as 280,000 vehicles there in 2021…an increase of about 133%. While that is significant growth it only would represent 20% of the number of battery powered vehicles forecast to be sold. The limitation appears to be production as the Shanghai factory is just nearing a volume of 5,000 vehicles per week. Tesla believes it can double that during this year. The Model Y has just been introduced in China and early press is calling it a major hit. Together with the Model 3, I believe this positions Tesla to be supply constrained. Should the company increase production earlier in the year, it has the opportunity to sell more than the forecast 280,000 vehicles. What is also important to note, is Tesla seems to be making greater profits on sales of its cars in China than in the U.S so as China becomes a larger portion of the mix Gross Margin could increase.
European Factory: Tesla has a cost disadvantage in Europe as its cars are not currently built there. So, while it established an early lead in market share, as others have launched battery powered vehicles at lower prices Tesla lost market share. That should all change when its Berlin Giga Factory begins production in July, 2021. This coupled with the Model Y introduction (it will be built in the Berlin factory) should mean a notable increase in sales as Europe returns to more normal times.
Model Y introduction: The Model Y, launched in early 2020 in the U.S., is already selling about 12,000 units a month here. This exceeds sales of crossover vehicles from every major brand (per GCBC which uses VIN reporting to calculate its numbers). It is expected to start being delivered in China in February.
Cybertruck: The Cybertruck (see our graphic here) was introduced to extremely mixed reactions. Traditionalists tended to hate it due to its radical departure from what they have come to expect for a pickup truck from companies like Ford, Toyota, etc. But it rang a cord with many and pre-orders are now up to 650,000 units according to Finbold. To give perspective on what this means, it is 30% higher than the total number of vehicles Tesla sold in 2020. While a portion of these orders could be cancelled as they only required a $100 deposit, the magnitude does imply significant incremental demand when Tesla launches in this category. The launch is expected late this year.
Roadster: Tesla has plans to re-introduce a Roadster in 2021. You may recall that the first Tesla’s were sports cars and are now collectors’ cars mostly valued between $50,000 and $70,000 but now the last one built, having about 200 miles on it is up for sale at $1.5 million. This time around it will make it an ultra-premium vehicle in specifications and in price. The base price Tesla has indicated starts at $200,000. A “Founders Series” will be $50,000 higher (with only 1,000 of those available). At those prices, gross margins should be quite high. The range Tesla initially indicated for this car was 620 miles and the speed from 0 to 60 of 1.9 seconds which would be much quicker than the McLaren 570S gas powered auto.
Tesla Semi: of all the vehicle categories that would benefit from being battery powered I believe the Semi is on top. That is because cost of ownership is one of the highest priorities for vehicles used in commerce. And Tesla claims that their semi will offer the lowest cost of ownership due to economic cost of fuel, less maintenance required as it has fewer parts, and easier repairs. According to Green Car Reports Musk has said it will begin being produced in 2021. Even assuming that Elon’s optimism is off, it appears that it could hit the market in early 2022. Once a definite date and specs are public, sales forecasts for Tesla could rise in 2022.
I’ve taken more time than usual to review my thoughts on Tesla as its astounding stock appreciation in 2020 make it vulnerable to stock pullbacks of some magnitude from time to time. But, its potential to achieve meaningful share of overall auto sales as various geographies shift to battery powered vehicles gives it the potential to achieve high growth in revenue for many years to come.
2. DocuSign stock appreciation will continue to outperform the market (it closed last year at $222/share)
DocuSign is the runaway leader in e-signatures facilitating multiple parties signing documents in a secure, reliable way for board resolutions, mortgages, investment documents, etc. Being the early leader creates a network effect, as hundreds of millions of people are in the DocuSign e-signature database. The company has worked hard to expand its scope of usage for both enterprise and smaller companies by adding software for full life-cycle management of agreements. This includes the process of generating, redlining, and negotiating agreements in a multi-user environment, all under secure conditions. On the small business side, the DocuSign product is called DocuSign Negotiate and is integrated with Salesforce.
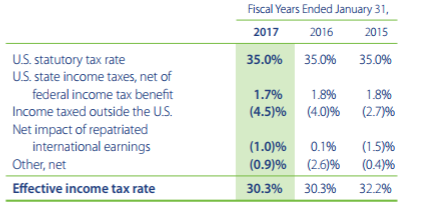
DocuSign was another beneficiary of the pandemic as it helped speed the use of eSignature technology. The acceleration boosted revenue growth to 53% YoY in Q3, 2021 (the quarter ended on October 31, 2020) from 39% in Fiscal 2020. Total customers expanded by 46% to 822,000. At the same time Net Retention (dollars spent by year-ago customers in Q3 FY21 vs dollars spent by the same customers a year earlier) was 122% in the quarter. Non-GAAP gross margin remained at 79% as increased usage per customer (due to the pandemic) had minimal impact on cost. Given DocuSign’s strong Contribution Margin, operating profits increase faster than revenue and were up to $49 million from $17 million in the year ago quarter. What has happened represents an acceleration of the migration to eSignature technology which will be the base for DocuSign going forward. Once a company becomes a customer, they are likely to increase their spend, as evidenced by 122% Net Revenue growth. Finally, competition appeared to weaken as its biggest competitor, Adobe, lost considerable ground. This all led to a sizable stock gain of 200% to $222/share at year end. In my view, the primary risk is around valuation but at 50% growth this gets mitigated as earnings should grow much faster than revenue. I continue to believe the stock will appreciate faster than the S&P.
3. Stitch Fix Stock appreciation will continue to outperform the market (it closed last year at $58.72/share)
Stitch Fix offers customers, who are primarily women (although its sales in Men’s clothing is rising), the ability to shop from home by sending them a box with several items selected based on sophisticated analysis of their profile and prior purchases. The customer pays a $20 “styling fee” for the box which can be applied towards purchasing anything in the box. The company is the strong leader in the space with revenue at nearly a $2 billion run rate. The stock had a strong finish to 2020 after declining substantially earlier in the year due to Covid negatively impacting performance. This occurred despite gaining market share as people simply weren’t buying a normal amount of clothes at the onset of the pandemic. When revenue growth rebounded in the October quarter to 10% YoY and 7% sequentially the stock gained significant ground and closed the year up 129%.
Stitch Fix continues to add higher-end brands and to increase its reach into men, plus sizes and kids. Its algorithms to personalize each box of clothes it ships keeps improving. It appears to be beyond the worst days of the pandemic and expects revenue growth to return to a more normal 20-25% for fiscal 2021 (ending in July). This is partially due to easy comps in Q3 and Q4 and partly due to clothing purchase behavior improving. The company will also be a beneficiary of a number of closures of retail stores.
Assuming it is a 20-25% growth company that is slightly profitable, it still appears under-valued at roughly 3X expected Q2 annualized revenue. As a result, I continue to recommend it.
4. Amazon stock will outpace the market (it closed last year at $3257/share).
Amazon shares increased by 76% last year while revenue in Q3 was up 37% year over year (versus 21% in 2019). This meant the stock performance exceeded revenue growth as its multiple of revenue expanded in concert with the increased revenue growth rate. Net Income grew 197% YoY in the quarter as the leverage in Amazon’s model became apparent despite the company continuing to have “above normal” expenditures related to Covid. We expect the company to continue at elevated revenue and earnings growth rates in Q4 and Q1 before reaching comps with last year’s Covid quarters. Once that happens growth will begin to decline towards the 20-25% level in the latter half of 2021.
What will remain in place post-Covid is Amazon’s dominance in retail, leading share in Web Services and control of the book industry. Additionally, Amazon now has a much larger number of customers for its Food Services than prior to the pandemic. All in all, it will likely mean that the company will have another strong year in 2021 with overall growth in the 25-30% range for the year and earnings growing much faster. But remember, the degree earnings grow is completely under Amazon’s control as they often increase spend at faster rates than expected, especially in R&D.
5. Zoom Video Communications will continue to outperform the market (it closed last year at $337/share)
When I began highlighting Zoom in my post on June 24, 2019, it was a relatively unknown company. Now, it is a household name. I’d like to be able to say I predicted that, but it came as a surprise. It was the pandemic that accelerated the move to video conferencing as people wanted more “personal contact” than a normal phone call and businesses found it enhanced communications in a “work at home world”. Let me remind you what I saw in Zoom when I added it to the list last year, while adding some updated comments in bold:
At the time, Revenue retention of business customers with at least 10 employees was about 140%. In Q3, FY 2021 revenue retention of business customers was still 130% despite pandemic caused layoffs.
It acquires customers very efficiently with a payback period of 7 months as the host of a Zoom call invites various people to participate in the call and those who are not already Zoom users can be readily targeted by the company at little cost. Now that Zoom is a household name, acquiring customers should be even less costly.
At the time, Gross Margins were over 80% and I believed they could increase. In Q3, GM had declined to 68% as usage increased dramatically and Zoom made its products available to K-12 schools for free. Given that students were all mostly attending school virtually, this is a major increase in COGs without associated revenue. When the pandemic ends gross margins should return close to historic levels – adding to Zoom profits.
The product has been rated best in class numerous times
Its compression technology (the key ingredient in making video high quality) appears to have a multi-year lead over the competition
Adding to those reasons I noted at the time that ZM was improving earnings and was slightly profitable in its then most recent reported quarter. With the enormous growth Zoom experienced it has moved to significant profitability and multiplied its positive cash flow.
While ZM stock appreciated 369% in 2020, it actually was about equal to its revenue growth rate in Q3 2020, meaning that the price to revenue was the same as a year earlier before despite:
Moving to significant profitability
Becoming a Household name
Having a huge built-in multiplier of earnings as schools re-open
6. CrowdStrike will outperform the market (it closed 2020 at $211/share and is now at 217.93)
When I evaluate companies, one of the first criteria is whether their sector has the wind behind its back. I expect the online security industry to not only grow at an accelerated pace but also face an upheaval as more modern technology will be used to detect increased attacks from those deploying viruses, spam, intrusions and identity theft. I suspect all of you have become increasingly aware of this as virus after virus makes the news and company after company reports “breaches” into their data on customers/users.
The U.S. cyber security market was about $67 billion in 2019 and is forecast to grow to about $111 billion by 2025 (per the Business Research Company’s report). Yet Cloud Security spend remains at only about 1.1% of total Cloud IT spend (per IDC who expects that percent to more than double). CrowdStrike is the player poised to take the most advantage of the shift to the cloud and the accompanying need for best-in-class cloud security. It is the first Cloud-Native Endpoint Security platform. As such it is able to monitor over 4 trillion signals across its base of over 8500 subscription customers. The companies leading technology for modern corporate systems has led to substantial growth (86% YoY in its October quarter). It now counts among its customers 49 of the Fortune 100 and 40 of the top global 100 companies.
Tactically, the company continues to add modules to its suite of products and 61% of its customers pay for 4 or more, driving solid revenue retention. The company targets exceeding 120% of the prior year’s revenue from last year’s cohort of customers. They have succeeded in this for 8 quarters in a row through upselling customers combined with retaining 97% – 98% of them. Because of its cloud approach, growing also has helped gross margins grow from 55% in FY 18 to 66% in FY 19 to 72% in FY 20 and further up to 76% in its most recent quarter. This, combined with substantial improvement in the cost of sales and marketing (as a % of revenue) has in turn led to the company going from a -100% operating margin in Fiscal 2018 to +8% in Q3, FY21. It seems clear to me that the profit percentage will increase dramatically in FY22 given the leverage in its model.
Non-Stock Picks for 2021
7. Online Advertising Companies will Experience a Spike in Growth in the Second Half of 2021
The pandemic hit was devastating for the travel industry, in-person events and associated ticket sellers, brick and mortar retailers and clothing brands. Rational behavior necessitated a dramatic reduction of advertising spend for all those impacted. U.S. advertising revenue declined by 4.3% to $213 billion, or around 17% according to MagnaGlobal, if one excludes the jump in political advertising (discussed in our last post), with Global spend down 7.2%. That firm believes digital formats grew revenue about 1% in 2020 (with TV, radio and print declining more than average). Digital formats would normally be up substantially as they continue to gain share, so the way to think about this is that they experienced 10-20% less revenue than would have occurred without Covid.
Assuming things return to normal in H2 2021, digital advertising will continue to gain share, total industry revenue will be higher than it would have been without Covid (even without the increased political spending in 2020) and comps will be easy ones in H2 of 2021. While there will not be major political spending there could be Olympic games which typically boost ad spend. So, while we removed Facebook from our 6 stock picks, it and other online players should be beneficiaries.
8. Real Estate will Show Surprising Resiliency in 2021
The story lines for Real Estate during the pandemic have been:
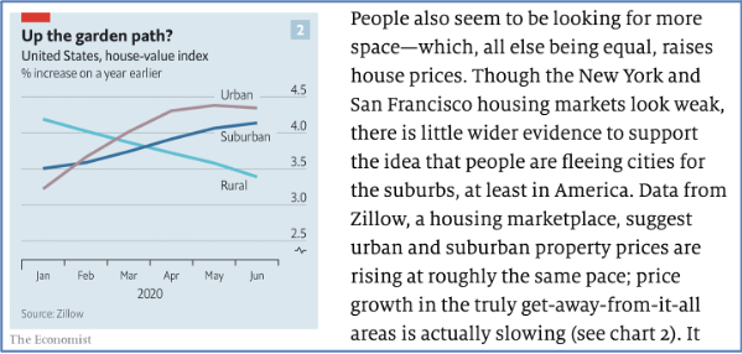
The flight to larger outside space has caved urban pricing while driving up suburban values
Commercial real estate pricing (and profits) is collapsing, creating permanent impairment in their value for property owners with post-pandemic demand expected to continue to fall
My son Matthew is a real estate guru who has consulted to cities like New York and Austin, to entities like Burning Man and is also a Professor of Real Estate Economics at NYU. I asked him to share his thoughts on the real estate market.
Both Matthew (quoted below) and I disagree with the story lines. I believe a portion of the thinking regarding commercial real estate pricing relates to the collapse of WeWork. That company, once the darling of the temporary rental space, had a broken IPO followed by a decline in value of nearly 95%. But the truth is that WeWork had a model of committing to long term leases (or purchasing property without regard to obtaining lowest cost possible) and renting monthly. Such a company has extreme risk as it is exposed to downturns in the business cycle where much of their business can disappear. Traditional commercial property owners lease for terms of 5 to 25 years, with 10-15 years being most common, thus reducing or even eliminating that risk as leases tend to be across business cycles. The one area where both Matthew and I do believe real estate could be impacted, at least temporarily, is in Suburban Malls and retail outlets where Covid has already led to acceleration of bankruptcies of retailers a trend I expect to continue (see prediction 10).
The rest of this prediction is a direct quote from Matthew (which I agree with).
“Real estate in 2021 will go down as the year that those who do not study history will be doomed to repeat it. The vastly overblown sentiments of the “death of the city” and the flight to the suburbs of households and firms will be overshadowed by the facts.
In the residential world, while the market for rentals may have somewhat softened, no urban owners have been quick to give up their places, in fact, they turned to rent them even as they buy or rent roomier locations within the city or additional places outside the cities, driving up suburban prices more quickly. In fact, even in markets such as NYC, per square foot housing sale prices are stable or rising. US homebuilding sentiment is the highest in 35 years, with several Y/Y growth statistics breaking decades long records leading up to a recent temporary fizzle due to political turmoil.
The commercial office world, which many decry as imminently bust due to the work at home boom, has seen a slowdown of new leases signed in some areas. But because most commercial office leases are of a 10–15-year term, a single bad year has little effect. While some landlords will give concessions today for an extended term tomorrow, their overall NPV may remain stable or even rise. In the meantime, tech giants like Amazon are gobbling up available space in the Seattle and Bellevue markets, and Facebook announced a 730,000 square foot lease in midtown Manhattan late in the year. In the end, the persistence of cities as clusters of activity that provide productivity advantages to firms and exceptional quality of life, entertainment options, restaurants and mating markets to individuals will not diminish. The story of cities is the story of pandemic after pandemic, each predicting the death of the city and each resulting in a larger, denser, more successful one.
The big story of real estate in 2021 will be the meteoric rise of industrial, which began pre-COVID and was super charged as former in-person sales moved to online and an entire holiday season was run from “dark stores” and warehouses. The continual build out of the last mile supply chain will continue to lower the cost of entry for retailers to accelerate cheaper delivery options. This rising demand for industrial will continue the trend of the creation of “dark stores” which exist solely as shopping locations for couriers, Instacart, Whole Foods and Amazon. Industrial is on the rise and the vaccine distribution problems will only accelerate that in 2021.”
9. Large Brick and Mortar Retailers will continue their downward trend with numerous bankruptcies and acquisitions by PE Firms as consumer behavior has permanently shifted
While bankruptcies are commonplace in the retail world, 2020 saw an acceleration and there was a notable demise of several iconic B&M (Brick & Mortar) brands, including:
It is important to understand that a bankruptcy does not necessarily mean the elimination of the entity, but instead often is a reorganization that allows it to try to survive. Remember many airlines and auto manufacturers went through a bankruptcy process and then returned stronger than before. Often, as part of the process, a PE firm will buy the company out of bankruptcy or buy the brand during the bankruptcy process. For example, JC Penny filed for bankruptcy protection in May, 2020 and was later acquired by the Simon Property Group and Brookfield Property Partners in September, 2020. Nieman Marcus was able to emerge from bankruptcy protection without being acquired. However, in both cases, reorganizing meant closing numerous stores.
There are many who believe things will: “go back to normal” once the pandemic ends. I believe this could not be further from the truth as consumer behavior has been permanently impacted. During the pandemic, 150 million consumers shopped online for the first time and learned that it should now be part of how they buy. But, even more importantly, those who had shopped online previously became much more frequent purchasers as they came to rely on its advantages:
Immediate accessibility to what you want (unlike out of stock issues in Brick and Mortar retail)
Fast and Free shipping in most cases
A more personalized experience than in store purchasing
As older Brick & Mortar brands add online shopping to their distribution strategy, most are unable to offer the same experience as online brands. For example, when you receive a package from Peloton the unboxing experience is an absolute delight, when you receive one from Amazon it is perfectly wrapped. On the other hand, I have bought products online from Nieman Marcus, an extremely high-end retailer, and the clothes seemed to be tossed into the box, were creased and somewhat unappealing when I opened the box. Additionally, a company like Amazon completely understands the importance of customer retention and its support is extraordinary, while those like Best Buy that offer online purchasing fall far of the bar set by Amazon.
What that all means is that many Brick and Mortar retailers will not solve their issues:
Adding more of an online push will not be enough
Customers that have experienced the benefits of online purchasing will continue to use it in much greater amounts than before the pandemic
Ecommerce will continue to take share from Brick and Mortar stores
As a result, we believe that in 2021 the strain on physical retail will continue, resulting in many more well-known (and lesser known) store chains and manufacturing brands filing for bankruptcy as the dual issues of eCommerce and of the pandemic keeping stores closed and/or operating at greatly diminished customer traction throughout most of the year. Coming on the heels of a disastrous 2020 it will be harder for many of them to even emerge from bankruptcy after reorganizing (including closing many stores).
10. The Warriors will make the playoffs this Year
I couldn’t resist including one fun pick. We did speak about this in our last post but wanted to include it as an actual 2021 pick. Many pundits had the Warriors as dead before this season began once Klay Thompson was injured. And, of course, more piled on when the team lost its first 2 games by large margins. But they were mis-analyzing several significant factors:
Steph Curry is still Steph Curry at his peak no matter who the supporting cast
Andrew Wiggins is a superior talent who has the ability to shine on both offense and defense now that he is no longer in a sub-optimal Minnesota environment
Kelly Oubre Jr is also talented enough to be a great defender. His offense, while poor so far, is well above average and over the course of the season that should show well
Draymond Green is in his prime and remains one of the top defenders in the league. He is also a great facilitator on the offensive end of the floor.
James Wiseman is a phenomenon with the talent to be a star. As the season progresses, I expect him to continue to get better and become a major factor in Warrior success
Eric Pascal was on the all-rookie team last year and has gotten better
It is clear that the team needs more games to get Curry and Green back into peak playing condition, Wiseman to gain experience and the Warriors to become acclimated to playing together. They have started to show improved defense but still need time to develop offensive rhythm. I expect them to be a major surprise this year and make the playoffs.
SoundBytes
Please Wear A Mask: I recently read a terrific book describing the 1918 flu pandemic called The Great Influenzaby John Barry. That pandemic was much deadlier than the current one, with estimates of the number of people it killed ranging from 35 million to 100 million when the world population was less than 25% of what it is today. What is so interesting is how much the current situation has replicated the progress of that one. One of the most important conclusions Barry draws from his extensive study of the past is that wearing a mask is a key weapon for reducing the spread.
As hard as it would have been to believe back in the olden days (like in February) my wife and I are now in the 7th week of “Sheltering in Place” and it has just been extended another 4 weeks. The questions constantly being discussed among my colleagues, friends and family are:
How long will this last?
What will life be like at the beginning of the end of this initiative?
When will things go back to normal?
Who will the Warriors draft with their high pick this year (OK not everyone brings this one up)?
I’m not going to try to answer any of these as I’m sure you are all bombarded with potential answers and there are many who know more than I do regarding a pandemic. In this post I’ll try to grapple with 3 different questions, each of which deserves a section below.
Question 1: How will the long-term ramifications of Covid-19 impact success for companies and what can they do to enhance their opportunity?
This is a long-winded question and will get a long-winded answer. To begin, I believe this will only accelerate several trends that are already in place: online commerce gaining share, the use of video conferencing and the virtual workplace, as well as increased emphasis of companies being economically efficient. The pandemic has forced most people to be much more cautious at venturing out to accomplish such everyday tasks as shopping, eating in restaurants and going to the movies. Instead, they are learning that almost everything can be bought online (including food from some top restaurants), conferencing with Zoom provides a great experience at a low cost, and business efficiency will be correlated with survival.
My wife and I have long been online shoppers but as we shelter at home, we have increased the volume of purchases quite significantly. Department stores that were previously experiencing loss of share to online merchants but were resistant to devoting sufficient effort to their own online stores are in deep trouble. It appears likely that a number of well-known and not so well-known retailers will file for bankruptcy within the next few months. The combination of people becoming more comfortable with buying just about everything online and a major reduction in the number of physical outlets will open up more share for online players and for the online stores of multi-channel merchants.
During the current environment my board meetings (as well as everyone else’s) are being held as Zoom conference calls. For many companies, having such a meeting eliminates travel and hotel expenses for employees, board members and advisors. Replacing this with a Zoom conference call can mean lowering the cost to hundreds of dollars, from tens to hundreds of thousands of dollars, per meeting. While I am a big fan of the value of face to face, many companies will be re-evaluating whether having more of their meetings through video conferencing makes sense in an era when the technology has emerged as very viable and extremely cost effective. I’m not suggesting that all board meeting will be executed as video conference calls as face-face remains important, but perhaps companies will decide to do half of their meetings as a Zoom call. An interesting example is the NFL draft, where it was conducted through use of Zoom instead of renting a large stadium and paying for travel expenses. Reviews have suggested that it was actually a better event than the prior year. I suspect the cost savings between all parties involved ran into the millions of dollars.
For many companies the pandemic has weakened revenue, putting pressure on survival. The government “bailout” PPP program helps, but by itself can prove insufficient to prop up companies with weak business models unless they have a very large cash reserve. The investment community was already shifting to focus more on efficient business models prior to Covid-19 but its disruption has helped to highlight the importance of building a profitable business.
Question 2: What should Companies do in the current environment?
What Azure has been suggesting for its portfolio companies is the following series of steps:
If you are eligible, apply for government assistance through the PPP, SBA emergency loan or other programs.
Create multiple models for your business under different scenarios (different dates that people will be back to normal, whether consumer spending will be reduced even after being back, whether customers will delay payments, etc.)
If one or more of credible scenarios indicate that you will run out of cash, then cut costs as quickly as possible. For employees making over $100,000 per year (including founders) cutting them back to some amount that is still at $100,000 or more will have no impact on the forgiveness offered on the PPP loan.
Make every attempt to extend any bank lines coming due as banks have been asked to cooperate with their customers.
If you can afford it, be as kind as possible to your customers by extending terms, etc. Not all, but many, will remember your help and repay you with increased loyalty.
While advertising seems an easy area to cut costs, make sure you evaluate the payback period for customer acquisition marketing as costs may be lower and online conversion may be higher (we have seen that with a number of our companies). In fact, if the payback is reasonably quick it may pay to play offense by being aggressive!
If you have a strong cash position it may be a time to consider acquisitions as many companies will be struggling.
If you have a product that customers are opting to purchase in this environment, think about trying to convert as many as possible to a subscription so that you can extend the relationship beyond the current situation. This can be done by offering attractive discounts for signing up for one or more years rather than month to month. For example, Zoom offers 2 months free if you opt for an annual plan versus a monthly plan. My wife and I decided the cost savings made it worth signing up for a full year.
Question 3: Who are the current and longer-term winners and losers as a result of Covid-19?
Winners
The biggest winners appear to be those that can leverage working at home, educating at home, buying at home, supplying infrastructure for increased online usage, and supplying products for increased cleanliness of surfaces and one’s self. In the public markets, I fortunately have 3 of my annual Blog recommendations included in these categories:
Zoom is the most obvious example of a beneficiary of people working and educating at home. It has reported that daily usage is up an astounding 30X between December and April. Its stock performance is just as astounding, up well over 100% year to date from the time of my pick in early January. The question for the company is whether they can harness this to make us permanently change how we communicate. For my wife and I, the number of Zoom calls we are on is now running between 5 and 10 per week. When I add my business calls the number is quite a bit higher. As they say: “How ya gonna keep ’em down on the farm after they’ve seen Paree?” That is, we are permanent customers as are many of our friends and colleagues.
DocuSign is another of my blog picks that should benefit in both the near term and longer term from the impact of the virus and sheltering at home. Its stock reflects higher expectation as it has increased in value by 41% year-to-date. If more meetings are going to be virtual then more documents will require esignatures and DocuSign is the runaway leader in the category
There are many other pure play beneficiaries of a future where more people entertain themselves, work and educate at home. This includes Netflix (stock up over 25%) who has seen a large spike in usage, Slack (stock up 30% since January 27), and online educational plays (our former company Education.com has seen a large spike in traffic and revenue as has our existing portfolio company Showbie)
Amazon is the poster child for purchasing online. It has announced hiring of 175,000 employees for increased warehouse and logistics operations which Wall Street interpreted as a massive increase in demand driving the stock to new highs (its currently up over 25% YTD). It should also benefit from increased purchases of eBooks and increased online usage of its Web Services (I haven’t seen much chatter about AWS benefit but it should be very large and is highly profitable). Azure portfolio company, Open Road is seeing a significant increase in its sales of eBooks since sheltering-at-home began.
Infrastructure Companies whose revenue varies with web usage should also benefit as volumes are increasing massively: Zoom announced that daily usage is up 3,000%; many others I’ve heard have ranged from 50% to 700% or more. Schools are converting to online classes with student usage increasing to 4-7 hours per day. Gaming companies are also beneficiaries and users. I believe that total web traffic is up at least 50% and perhaps a lot more versus where it would have been.
Clorox is one of the major beneficiaries of our new emphasis on cleanliness through disinfecting our environment and washing our hands many times a day, as recommended by the new folk hero Dr. Fauci. While its stock is up 20% year-to-date, the question is whether the increased demand for disinfectants is a permanent change. I’m guessing that increased usage is permanent… but not to the extent we are seeing today.
Long-Term Losers
Losers span several industries and the question for many of the companies in these industries is how permanent the loss of demand will be. Let’s look at them sector by sector.
Department Stores are currently shut down in most of the United States. Companies already struggling are now experiencing substantial losses every week. Those that have a pharmacy or grocery area (like Walmart) can stay open, but the real key to reducing the losses is the effectiveness of their online offering. In most cases this is pretty weak, both in percentage of the retailer’s sales and the level of profitability given inefficient distribution and high levels of returns. I expect multiple brand name players to file for bankruptcy before the year is over.
The Travel Industry is being hit very hard by the shelter-in-place requirements. Airlines are flying planes that are nearly empty but trying to maintain their cash by not cancelling flights until close to the date of departure so that passengers cancelling will get credits rather than rebates. One hotel I spoke to when cancelling my reservation told me that occupancy was down 90%. Many have already closed their properties. While I expect business to improve greatly for both of these arenas when we are back to normal, they are both accumulating massive losses which might pressure viability. Further, when we are back to normal (whatever that becomes) I suspect that airline traffic will be down through at least mid-2021 as fears are elevated and will take some time to subside. Cruise lines may be in worse shape as the publicity around the various ships that had large portions of passengers and crew get Covid-19 has definitely caused many to reconsider vacationing this way. I expect this sector to be impacted at least through the end of 2021. Also, cruises have had to refund most fares as opposed to providing a credit for future travel.
Arena Entertainment providers and entertainers have been hurt badly by the closure of their venues during this time period. This includes movie theaters as well as complexes like the Chase Center and other arenas. The question becomes when will they be able to be open for full occupancy? And when they are will people stay away for some time. I expect many of them to be at full occupancy by early 2021 as younger people (who make up the majority who attend concerts) will drive renewal of demand for concerts.
Short-term Losers that can Return to Success
Advertising Platforms (TV, Web, etc) have seen demand drop as the travel industry, live events and brick and mortar retailers have little reason to maintain prior spending. Additionally, those companies looking to cut cost view advertising (especially brand building advertising) as a prime candidate for cuts. However, I believe that demand will return to normal as stores reopen and travel is permitted. As of now this appears to be sometime in Q3. While many companies in sectors that take longer to return to normal will still have reduced budgets, online players will likely increase spend, as will those seeing this as an opportunity to gain share.
The Sports Industry consists of teams, leagues, arenas, ticket sellers (like Stubhub), equipment providers and betting. All of these are experiencing close to zero revenue (with the exception of some equipment being sold for home use). Leagues (and teams) with large TV contracts are likely to reinitiate games without live audiences by July as participants can be restricted to those having tested for no virus immediately before a game. Even without an audience the TV money will make this profitable to do. Once these are back in play, betting will resume. Equipment providers can still sell T-shirts and other paraphernalia online, but once games resume their sales will increase. By as early as the fall, but no later than early 2021, I expect that many states will allow live audiences for games and that arenas will be back to normal capacity for them. This would allow ticket sellers and sports betting to be at normal capacity. Equipment suppliers also depend on school purchases as well as little league, etc. So, while revenue will begin growing in the fall it may not be back to normal before early 2021. A noted exception will be providers of at home equipment, like Peloton, which will lose business from gyms in the short run but should see a large increase in at-home purchases.
Non-Internet Service Providers (other than delivery services) have a particularly hard time as physical services cannot be provided online. Things like the Geek Squad, physician checkups and procedures, elective surgeries, automotive services, personal care like haircuts and manicures, massages, and more have been suspended. But as long as the entities survive this period, I believe there will be no permanent impairment of their businesses.
Conclusion
Coming back to where this post began, I’m still wondering who the Warriors will draft! But more importantly, I hope all of you and your families are safe and healthy. We will get through this!
Each year, Azure hosts a marketing day for CMOs and CEOs of its consumer-facing portfolio companies. This year, on February 27th, we had sessions on the following topics:
Refreshing Your Brand as the Business Grows
Metrics for Evaluating Successful Marketing
Leveraging Comedy to Lower Customer Acquisition Cost
Know the Next Generation: An introduction to Gen Z
The Benefits and Drawbacks of a Multi-Channel Strategy
Influencer Strategies
Optimizing Pinterest
I presented the one on Metrics, but the other sessions are conducted by a combination of portfolio executives and outside speakers, each a leading thinker on the topic. Since I invariably learn quite a lot from other speakers, it seems only fair to borrow from their talks for a few blog posts so that I can share these benefits.
Much of this post will be based on concepts that I found especially enlightening from the session by Chris Bruzzo, the current CMO of Electronic Arts, on knowing Generation Z. I won’t cite each place I am using something from Chris versus my own thoughts; but you can assume much of the content emanates from Chris. Since Chris is one of the most creative thinkers in marketing, I’m hoping this will make me look good!
Marketers have Defined Generational Characteristics
Marketers often use personas to help understand what they need to do to address different types of customers. A persona may be:
A married woman 35 years old with a job and 2 children aged 6 and 9;
A 16-year-old male who is a sophomore in high school;
A non-working woman aged 50
A great deal of research has been done on the characteristics of particular “personas” to better enable a company to create and market products that meet their needs. One categorization of people is by age, with 5 different generations being profiled. The youngest group to emerge as important is Gen Z, roughly defined as those born between 1995 and 2012. Currently the U.S. population over 12 years old is distributed as follows:
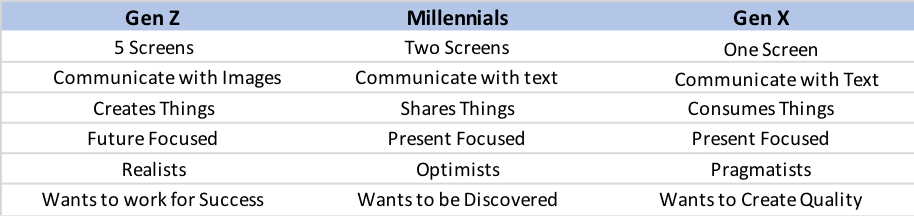
What this means is that Gen Z has become a significant portion of the population to consider when creating and marketing products. With that in mind, let’s compare several characteristics of the youngest three of these groups.
Source: EA Research
Gen Z is the first generation that are digital natives. They are profiled as having cautious optimism, wanting to be connected, seeking community and wanting to create and control things. Earlier generations, including Millennials, watched TV an increasing number of hours, often multi-tasking while they did. Gen Z has replaced much of TV watching with device “screen time”, including visiting YouTube (72% of Gen Z visit it daily). When asked “What device would you pick if you could have only one?”, GenZers chose the TV less than 5% of the time. Prior generations respond well to email marketing while Gen Z needs to be reached through social media. Gen Z has little tolerance for barriers of entry for reaching a site and will just move on (I feel the same way and think many members of other generations do as well). So, when targeting new customers (especially Gen Z) remove barriers to entry like requiring registration before a user becomes a customer. It is important to demonstrate value to them first.
Gen Z grew up in an era where the Internet was part of life and smart phones were viewed as essential… rather than a luxury. On average they spend 40% of their free time on screens. What is even more eye opening is that 91% go to bed with their devices. Advertisers have responded to these trends by gradually shifting more of their spend online. This has been difficult for newspapers and magazines for quite a while, but now it is also having a major impact on flattening out the use of TV as an advertising medium.
There are several implications from the numbers shown in the above chart. First, it is very clear to see that newspapers and magazines as we know them are not viable. This has led to iconic players like the New York Times and Fortune monetizing their brands through conferences, trips, wine clubs, and more. Lesser known brands have simply disappeared. In 2018, TV revenue continued to grow slightly despite losing share as the smaller share was of a larger pie. But in 2019, TV advertising dollars declined, and the decline is forecast to continue going forward. Several factors can be attributed to this but certainly one is that brands targeting Gen Z are aware that TV is not their medium of choice. One unintended consequence of major brands shifting spend to the Internet is that because they are less price sensitive to cost than eCommerce companies, this has led to higher pricing by Facebook and Google.
Personalization is Becoming “Table Stakes” and Offering Co-Creation is a Major Plus
Consumers, in general, and especially Gen Z, are demanding that brands do more to personalize products to their needs and interests. In fact, Gen Z even wants to participate in product creation. One example involves Azure portfolio company Le Tote. The company, much like Stitch Fix, uses algorithms to personalize the clothing it sends based on specifics about each customer. When the company added the ability for consumers to personalize their box (from the already personalized box suggested by the algorithm) there was a sizeable spike in satisfaction…despite the fact that the items the consumer substituted led to a decline in how well the clothes fit! This example shows that using customer data to select new items is only a first step in personalization. Letting the customer have more of a say (be a co-creator) is even more important.
Conclusions
Startups need to diversify their marketing spend away from Facebook and Google as the ROI on these channels has contracted. At the Azure marketing day, we highlighted testing whether Pinterest, influencers, brick and mortar distribution and/or comedy might be sources that drive a higher ROI.
If Gen Zers are being targeted, YouTube, Snap, Instagram, and Twitch are likely better places to market
When targeting new customers (especially Gen Z) remove barriers to entry like requiring registration before a user becomes a customer. It is important to demonstrate value to them first.
Build great apps for iPhones and Android phones but what is becoming most important is making sure that smart phones work well on your site without requiring an app, as most Gen Zers will use their phones for access. When they do, the mobile web version needs to be strong so that they don’t need to download your app before discovering the value you offer.
Involve customers as much as possible in the design/selection/creation of your products as this extends personalization to “co-creation” and will increase satisfaction.
Soundbytes
Readers are aware that I invest in growth stocks (some of which I suggest to you) to achieve superior performance. What you may not be aware of is that over the past 25 years my strategy for investing has been to put the majority of capital in A or better rated municipal bonds (Munis) to generate income in a relatively safe way (and I believe everyone should diversify how they apportion capital). I use a complex strategy to generate superior returns and in the past 25 years I have earned, on average, between 4% and 5% tax free annually. But in the current environment new investments in Munis will have much lower yields so I have started to look at “safe” alternatives to generate income. This type of investment is for income generation and involves a different category of stocks than the growth stocks I target for high returns through stock appreciation.
Given the recent downturn in the stock market I did my first “bond alternative” investment earlier this week. My goal is to generate income of over 5% on an after-tax basis in stocks that are “safe” investments from the point of view of continuing to deliver dividends at or above current levels.
My first set of transactions was in Bristol Myers Squibb:
I bought the stock at $56.48 where the dividend is 3.2% per year
I sold Jan 21 calls at a strike price of 60 and received $4.95
If the stock is not called my cash yield, including $1.80 in dividends, would be $6.75 over less than one year which would equal 12% before taxes
I also sold Jan 21 puts at a strike price of $55 and received $6.46. If the stock is not put to me and is not called that would increase my one-year yield to over 23% of the $56.48 stock price and I would repeat the sale of calls and puts next year. Since my net cost was $43.27 the percentage yield would be over 30% of my cash outlay.
If the stock was called my net gain would equal the profit on the stock, the dividends for one year plus the premiums on the options and would exceed 30%
If the stock went below $55 and was put to me at that price I would be ok with that as the new shares would have a net cost of just over $49 with a dividend yield of close to 4.0% (assuming the company follows past practice of raising dividends each year) and I could sell new puts at a lower strike price.
The second stock I invested in for income is AT&T.
I bought the stock at $34.60 where the dividend is 6.0% per year
I sold Jan 21 calls at a strike price of $37 and received $2.05 per share
If the stock is not called my year 1 cash yield would be $4.13 per share over less than a year or about 12% before taxes
I also sold Jan 21 puts with a strike of $32 and received $3.30 per share. If the stock is not put to me and is not called, that would increase my one-year yield to over 20% of the stock price and over 25% of the net cash outlay
If the stock was called, I would only have 3 quarters of dividends, but the gain would be over 30% of my net original cash outlay
If the stock was put to me my cost of the new shares, after subtracting the put premium would be $28.70 and the dividend alone would provide a 7.2% pre-tax yield and I could sell new puts at a lower price.
We shall see how this works out but unless they cut the dividends, I won’t worry if the stock is lower a year from now as that would only increase my yield on new stock purchased due to the puts. The chance of either company cutting dividends seems quite low which is why I view this as a “safe” alternative to generate income as I won’t sell either stock unless they are called at the higher strike price.
I also began reserving capital starting about a month ago as I expected the virus to impact the market. These purchases used about 10% of what I had put aside. I put another 15% to work on Friday, March 13 as the market had fallen further and valuations have become quite attractive – remember the secret is to “buy low, sell high”. When the market is low its always scary or it wouldn’t be low! I do confess that I didn’t sell much when it was high as I tend to be a long-term holder of stocks I view as game changers…so I missed the opportunity to sell high and then repurchase low.
I wanted to start this post by repeating something I discussed in my top ten lists in 2017 and 2018 which I learned while at Sanford Bernstein in my Wall Street days: “Owning companies that have strong competitive advantages and a great business model in a potentially mega-sized market can create the largest performance gains over time (assuming one is correct).” It does make my stock predictions somewhat boring (as they were on Wall Street where my top picks, Dell and Microsoft each appreciated over 100X over the ten years I was recommending them).
Let’s do a little simple math. Suppose one can generate an IRR of 26% per year (my target is to be over 25%) over a long period of time. The wonder of compounding is that at 26% per year your assets will double every 3 years. In 6 years, this would mean 4X your original investment dollars and in 12 years the result would be 16X. For comparison purposes, at 5% per year your assets would only be 1.8X in 12 years and at 10% IRR 3.1X. While 25%+ IRR represents very high performance, I have been fortunate enough to consistently exceed it (but always am worried that it can’t keep up)! For my recommendations of the past 6 years, the IRR is 34.8% and since this exceeds 26%, the 6-year performance is roughly 6X rather than 4X.
What is the trick to achieving 25% plus IRR? Here are a few of my basic rules:
Start with companies growing revenue 20% or more, where those closer to 20% also have opportunity to expand income faster than revenue
Make sure the market they are attacking is large enough to support continued high growth for at least 5 years forward
Stay away from companies that don’t have profitability in sight as companies eventually should trade at a multiple of earnings.
Only choose companies with competitive advantages in their space
Re-evaluate your choices periodically but don’t be consumed by short term movement
As I go through each of my 6 stock picks I have also considered where the stock currently trades relative to its growth and other performance metrics. With that in mind, as is my tendency (and was stated in my last post), I am continuing to recommend Tesla, Facebook, Amazon, Stitch Fix and DocuSign. I am adding Zoom Video Communications (ZM) to the list. For Zoom and Amazon I will recommend a more complex transaction to achieve my target return.
2020 Stock Recommendations:
1. Tesla stock appreciation will continue to outperform the market (it closed last year at $418/share)
Tesla is likely to continue to be a volatile stock, but it has so many positives in front of it that I believe it wise to continue to own it. The upward trend in units and revenue should be strong in 2020 because:
The model 3 continues to be one of the most attractive cars on the market. Electric Car Reviews has come out with a report stating that Model 3 cost of ownership not only blows away the Audi AS but is also lower than a Toyota Camry! The analysis is that the 5-year cost of ownership of the Tesla is $0.46 per mile while the Audi AS comes in 70% higher at $0.80 per mile. While Audi being more expensive is no surprise, what is shocking is how much more expensive it is. The report also determined that Toyota Camry has a higher cost as well ($0.49/mile)! Given the fact that the Tesla is a luxury vehicle and the Camry is far from that, why would anyone with this knowledge decide to buy a low-end car like a Camry over a Model 3 when the Camry costs more to own? What gets the Tesla to a lower cost than the Camry is much lower fuel cost, virtually no maintenance cost and high resale value. While the Camry purchase price is lower, these factors more than make up for the initial price difference
China, the largest market for electronic vehicles, is about to take off in sales. With the new production facility in China going live, Tesla will be able to significantly increase production in 2020 and will benefit from the car no longer being subject to import duties in China.
European demand for Teslas is increasing dramatically. With its Chinese plant going live, Tesla will be able to partly meet European demand which could be as high as the U.S. in the future. The company is building another factory in Europe in anticipation. The earliest indicator of just how much market share Tesla can reach has occurred in Norway where electric cars receive numerous incentives. Tesla is now the best selling car in that country and demand for electric cars there now exceeds gas driven vehicles.
While 2020 is shaping up as a stairstep uptick in sales for Tesla given increased capacity and demand, various factors augur continued growth well beyond 2020. For example, Tesla is only partway towards having a full lineup of vehicles. In the future it will add:
Pickup trucks – where pre-orders and recent surveys indicate it will acquire 10-20% of that market
A lower priced SUV – at Model 3 type pricing this will be attacking a much larger market than the Model X
A sports car – early specifications indicate that it could rival Ferrari in performance but at pricing more like a Porsche
A refreshed version of the Model S
A semi – where the lower cost of fuel and maintenance could mean strong market share.
2. Facebook stock appreciation will continue to outperform the market (it closed last year at $205/share)
Facebook, like Tesla, continues to have a great deal of controversy surrounding it and therefore may sometimes have price drops that its financial metrics do not warrant. This was the case in 2018 when the stock dropped 28% in value during that year. While 2019 partly recovered from what I believe was an excessive reaction, it’s important to note that the 2019 year-end price of $205/share was only 16% higher than at the end of 2017 while trailing revenue will have grown by about 75% in the 2-year period. The EPS run rate should be up in a similar way after a few quarters of lower earnings in early 2019. My point is that the stock remains at a low price given its metrics. I expect Q4 to be quite strong and believe 2020 will continue to show solid growth.
The Facebook platform is still increasing the number of active users, albeit by only about 5%-6%. Additionally, Facebook continues to increase inventory utilization and pricing. In fact, given what I anticipate will be added advertising spend due to the heated elections for president, senate seats, governorships etc., Facebook advertising inventory usage and rates could increase faster (see prediction 7 on election spending).
Facebook should also benefit by an acceleration of commerce and increased monetization of advertising on Instagram. Facebook started monetizing that platform in 2017 and Instagram revenue has been growing exponentially and is likely to close out 2019 at well over $10 billion. A wild card for growth is potential monetization of WhatsApp. That platform now has over 1.5 billion active users with over 300 million active every day. It appears close to beginning monetization.
The factors discussed could enable Facebook to continue to grow revenue at 20% – 30% annually for another 3-5 years making it a sound longer term investment.
3. DocuSign stock appreciation will continue to outperform the market (it closed last year at $74/share)
DocuSign is the runaway leader in e-signatures facilitating multiple parties signing documents in a secure, reliable way for board resolutions, mortgages, investment documents, etc. Being the early leader creates a network effect, as hundreds of millions of people are in the DocuSign e-signature database. The company has worked hard to expand its scope of usage for both enterprise and smaller companies by adding software for full life-cycle management of agreements. This includes the process of generating, redlining, and negotiating agreements in a multi-user environment, all under secure conditions. On the small business side, the DocuSign product is called DocuSign Negotiate and is integrated with Salesforce.
The company is a SaaS company with a stable revenue base of over 560,000 customers at the end of October, up well over 20% from a year earlier. Its strategy is one of land and expand with revenue from existing customers increasing each year leading to a roughly 40% year over year revenue increase in the most recent quarter (fiscal Q3). SaaS products account for over 95% of revenue with professional services providing the rest. As a SaaS company, gross margins are high at 79% (on a non-GAAP basis).
The company has now reached positive earnings on a non-GAAP basis of $0.11/share versus $0.00 a year ago. I use non-GAAP as GAAP financials distort actual results by creating extra cost on the P&L if the company’s stock appreciates. These costs are theoretic rather than real.
My only concern with this recommendation is that the stock has had a 72% runup in 2019 but given its growth, move to positive earnings and the fact that SaaS companies trade at higher multiples of revenue than others I still believe it can outperform this year.
4. Stitch Fix Stock appreciation will continue to outperform the market (it closed last year at $25.66/share)
Stitch Fix offers customers, who are primarily women, the ability to shop from home by sending them a box with several items selected based on sophisticated analysis of her profile and prior purchases. The customer pays a $20 “styling fee” for the box which can be applied towards purchasing anything in the box. The company is the strong leader in the space with revenue approaching a $2 billion run rate. Unlike many of the recent IPO companies, it has shown an ability to balance growth and earnings. The stock had a strong 2019 ending the year at $25.66 per share up 51% over the 2018 closing price. Despite this, our valuation methodology continues to show it to be substantially under valued and it remains one of my picks for 2020. The likely cause of what I believe is a low valuation is a fear of Amazon making it difficult for Stitch Fix to succeed. As the company gets larger this fear should recede helping the multiple to expand.
Stitch Fix continues to add higher-end brands and to increase its reach into men, plus sizes and kids. Its algorithms to personalize each box of clothes it ships keeps improving. Therefore, the company can spend less on acquiring new customers as it has increased its ability to get existing customers to spend more and come back more often. Stitch Fix can continue to grow its revenue from women in the U.S. with expansion opportunities in international markets over time. I believe the company can continue to grow by roughly 20% or more in 2020 and beyond.
Stitch Fix revenue growth (of over 21% in the latest reported quarter) comes from a combination of increasing the number of active clients by 17% to 3.4 million, coupled with driving higher revenue per active client. The company accomplished this while generating profits on a non-GAAP basis.
5. Amazon stock strategy will outpace the market (it closed last year at $1848/share).
Amazon shares increased by 23% last year while revenue in Q3 was up 24% year over year. This meant the stock performance mirrored revenue growth. Growth in the core commerce business has slowed but Amazon’s cloud and echo/Alexa businesses are strong enough to help the company maintain roughly 20% growth in 2020. The company continues to invest heavily in R&D with a push to create automated retail stores one of its latest initiatives. If that proves successful, Amazon can greatly expand its physical presence and potentially increase growth through the rollout of numerous brick and mortar locations. But at its current size, it will be difficult for the company to maintain over 20% revenue growth for many years (excluding acquisitions) so I am suggesting a more complex investment in this stock:
Buy X shares of the stock (or keep the ones you have)
Sell Amazon puts for the same number of shares with the puts expiring on January 15, 2021 and having a strike price of $1750. The most recent sale of these puts was for over $126
So, net out of pocket cost would be reduced to $1722
A 20% increase in the stock price (roughly Amazon’s growth rate) would mean 29% growth in value since the puts would expire worthless
If the stock declined 226 points the option sale would be a break-even. Any decline beyond that and you would lose additional dollars.
If the options still have a premium on December 31, I will measure their value on January 15, 2021 for the purposes of performance.
6. I’m adding Zoom Video Communications to the list but with an even more complex investment strategy (the stock is currently at $72.20)
I discussed Zoom Video Communications (ZM) in my post on June 24, 2019. In that post I described the reasons I liked Zoom for the long term:
Revenue retention of a cohort was about 140%
It acquires customers very efficiently with a payback period of 7 months as the host of a Zoom call invites various people to participate in the call and those who are not already Zoom users can be readily targeted by the company at little cost
Gross Margins are over 80% and could increase
The product has been rated best in class numerous times
Its compression technology (the key ingredient in making video high quality) appears to have a multi-year lead over the competition
Adding to those reasons it’s important to note that ZM is improving earnings and was slightly profitable in its most recent reported quarter
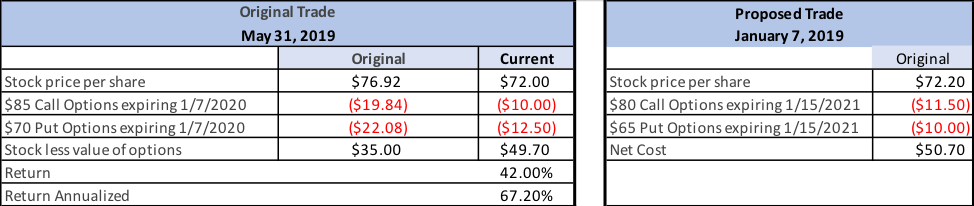
The fly in the ointment was that my valuation technology showed that it was overvalued. However, I came up with a way of “future pricing” the stock. Since I expected revenue to grow by about 150% over the next 7 quarters (at the time it was growing over 100% year over year) “future pricing” would make it an attractive stock. This was possible due to the extremely high premiums for options in the stock. So far that call is working out. Despite the company growing revenue in the 3 quarters subsequent to my post by over 57%, my concern about valuation has proven correct and the stock has declined from $76.92 to $72.20. If I closed out the position today by selling the stock and buying back the options (see Table 1) my return for less than 7.5 months would be a 42% profit. This has occurred despite the stock declining slightly due to shrinkage in the premiums.
Table 1: Previous Zoom trade and proposed trade
I typically prefer using longer term options for doing this type of trade as revenue growth of this magnitude should eventually cause the stock to rise, plus the premiums on options that are further out are much higher, reducing the risk profile, but I will construct this trade so that the options expire on January 15, 2021 to be able to evaluate it in one year. In measuring my performance we’ll use the closing stock price on the option expiration date, January 15, 2021 since premiums in options persist until their expiration date so the extra 2 weeks leads to better optimization of the trade.
So, here is the proposed trade (see table 1):
Buy X shares of the stock at $72.20 (today’s price)
Sell Calls for X shares expiring January 15, 2021 at a strike of $80/share for $11.50 (same as last price it traded)
Sell puts for X shares expiring January 15, 2021 with strike of $65/share for $10.00 (same as last price it traded)
I expect revenue growth of 60% or more 4 quarters out. I also expect the stock to rise some portion of that, as it is now closer to its value than when I did the earlier transaction on May 31, 2019. Check my prior post for further analysis on Zoom, but here are 3 cases that matter at December 31, 2020:
Stock closes over $80/share (up 11% or more) at end of the year: the profit would be 58% of the net cost of the transaction
This would happen because the stock would be called, and you would get $80/share
The put would expire worthless
Since you paid a net cost of $50.70, net profit would be $29.30
Stock closes flat at $72.20: your profit would be $21.50 (42%)
The put and the call would each expire worthless, so you would earn the original premiums you received when you sold them
The stock would be worth the same as what you paid
Stock closes at $57.85 on December 31: you would be at break even. If it closed lower, then losses would accumulate twice as quickly:
The put holder would require you to buy the stock at the put exercise price of $65, $7.15 more than it would be worth
The call would expire worthless
The original stock would have declined from $72.20 to $57.85, a loss of $14.35
The loss on the stock and put together would equal $21.50, the original premiums you received for those options
Outside of my stock picks, I always like to make a few non-stock predictions for the year ahead.
7. The major election year will cause a substantial increase in advertising dollars spent
According to Advertising Analytics political spending has grown an average of 27% per year since 2012. Both the rise of Super PACs and the launch of online donation tools such as ActBlue have substantially contributed to this growth. While much of the spend is targeted at TV, online platforms have seen an increasing share of the dollars, especially Facebook and Google. The spend is primarily in even years, as those are the ones with senate, house and gubernatorial races (except for minor exceptions). Of course, every 4th year this is boosted by the added spend from presidential candidates. The Wall Street Journal projects the 2020 amount will be about $9.9 billion…up nearly 60% from the 2016 election year. It should be noted that the forecast was prior to Bloomberg entering the race and if he remains a viable candidate an additional $2 billion or more could be added to this total.
The portion targeted at the digital world is projected to be about $2.8 billion or about 2.2% of total digital ad spending. Much of these dollars will likely go to Facebook and Google. This spend has a dual impact: first it adds to the revenue of each platform in a direct way, but secondly it can also cause the cost of advertising on those platforms to rise for others as well.
8.Automation of Retail will continue to gain momentum
This will happen in multiple ways, including:
More Brick & Mortar locations will offer some or all the SKUs in the store for online purchase through Kiosks (assisted by clerks/sales personnel). By doing this, merchants will be able to offer a larger variety of items, styles, sizes and colors than can be carried in any one outlet. In addition, the consolidation of inventory achieved in this manner will add efficiency to the business model. In the case of clothing, such stores will carry samples of items so the customer can try them on, partly to optimize fit but also to determine whether he or she likes the way it looks and feels on them. If one observes the massive use of Kiosks at airports it becomes obvious that they reduce the number of employees needed and can speed up checking in. One conclusion is this will be the wave of the future for multiple consumer-based industries.
Many more locations will begin incorporating technology to eliminate the number of employees needed in their stores. Amazon will likely be a leader in this, but others will also provide ways to reduce the cost of ordering, picking goods, checking out and receiving information while at the store.
9. The Warriors will come back strong in the 2020/21 season
Let me begin by saying that this prediction is not being made because I have been so humbled by my miss in the July post where I predicted that the Warriors could edge into the 2020 playoffs and then contend for a title if Klay returned in late February/early March. Rather, it is based on analysis of their opportunity for next season and also an attempt to add a little fun to my Top Ten List! The benefit of this season:
Klay and Curry are getting substantial time off after 5 seasons of heavy stress. They should be refreshed at the start of next season
Russell, assuming he doesn’t keep missing games with injuries, is learning the Warriors style of play
Because of the injuries to Klay, Curry, Looney, and to a lesser extent Green and Russell, several of the younger members of the team are getting experience at a much more rapid rate than would normally be possible and the Warriors are able to have more time to evaluate them as potential long-term assets
If the Warriors continue to lose at their current rate, they will be able to get a high draft choice for the first time since 2012 when they drafted Harrison Barnes with the 7th pick. Since then their highest pick has been between the 28th and 30th player chosen (30 is the lowest pick in the first round)
The Warriors will have more cap space available to sign a quality veteran
Andre Iguodala might re-sign with the team, and while this is not necessary for my prediction it would be great for him and for the team
The veterans should be hungry again after several years of almost being bored during the regular season
I am assuming the Warriors will be relatively healthy next season for this to occur.
10. At least one of the major Unicorns will be acquired by a larger player
In 2019, there was a change to the investing environment where most companies that did not show a hint of potential profitability had difficulty maintaining their market price. This was particularly true of highly touted Unicorns, which mostly struggled to increase their share price dramatically from the price each closed on the day of their IPO. Table 2 shows the 9 Unicorns whose IPOs we highlighted in our last post. Other than Beyond Meat, Zoom and Pinterest, they all appear some distance from turning a proforma profit. Five of the other six are below their price on the first day’s close. A 6th, Peloton, is slightly above the IPO price (and further above the first days close). Beyond Meat grew revenue 250% in its latest quarter and moved to profitability as well. Its stock jumped on the first day and is even higher today. While Pinterest is showing an ability to be profitable it is still between the price of the IPO and its close on the first day of trading. Zoom, which is one of our recommended buys, was profitable (on a Non-GAAP basis) and grew revenue 85% in its most recent quarter. A 10th player, WeWork, had such substantial losses that it was unable to have a successful IPO.
Something that each of these companies have in common is that they are all growing revenue at 30% or more, are attacking large markets, and are either in the leadership position in that market or are one of two in such a position. Because of this I believe one or more of these (and comparable Unicorns) could be an interesting acquisition for a much larger company who is willing to help make them profitable. For such an acquirer their growth and leadership position could be quite attractive.
I entered 2019 with some trepidation as my favored stocks are high beta and if the bear market of the latter portion of 2018 continued, I wasn’t sure I would once again beat the market…it was a pretty close call last year. However, I felt the companies I liked would continue to grow their revenue and hoped the market would reward their performance. As it turns out, the 5 stocks I included in my top ten list each showed solid company performance and the market returned to the bull side. The average gain for the stocks was 45.7% (versus the S&P gain of 24.3%).
Before reviewing each of my top ten from last year, I would like to once again reveal long term performance of the stock pick portion of my top ten list. For my picks, I assume equal weighting for each stock in each year to come up with my performance and then compound the yearly gains (or losses) to provide my 6-year performance. For the S&P my source is Multpl.com. I’m comparing the S&P index at January 2 of each year to determine annual performance. My compound gain for the 6-year period is 499% which equates to an IRR of 34.8%. The S&P was up 78% during the same 6-year period, an IRR of 10.1%.
The 2019 Top Ten Predictions Recap
One of my New Year’s pledges was to be more humble, so I would like to point out that I wasn’t 10 for 10 on my picks. One of my 5 stocks slightly under-performed the market and one of my non-stock forecasts was a mixed bag. The miss on the non-stock side was the only forecast outside of tech, once again highlighting that I am much better off sticking to the sector I know best (good advice for readers as well). However, I believe I had a pretty solid year in my forecasts as my stock portfolio (5 of the picks) significantly outperformed the market, with two at approximately market performance and three having amazing performance with increases of 51% to 72%. Regarding the 5 non-stock predictions, 4 were right on target and the 5th was very mixed. As a quick reminder, my predictions were:
Stock Portfolio 2019 Picks:
Tesla stock will outpace the market (it closed last year at $333/share and opened this year at $310)
Facebook Stock will outpace the market (it closed last year at $131/share)
Amazon Stock will outpace the market (it opened the year at $1502/share)
Stitch Fix stock appreciation will outpace the market (it closed last year at $17/share)
DocuSign stock will outpace the market in 2019 (it is currently at $43/share and opened the year at $41)
5 Non-Stock Predictions:
Replacing cashiers with technology will be proven out in 2019
Replacing cooks, baristas, and waitstaff with robots will begin to be proven in 2019
Influencers will be increasingly utilized to directly drive commerce
The Cannabis Sector should show substantial gains in 2019
2019 will be the year of the unicorn IPO
In the discussion below, I’ve listed in bold each of my ten predictions and give an evaluation of how I fared on each.
Tesla stock will outpace the market (it closed last year at $333/share and opened this year at $310)
Tesla proved to be a rocky ride through 2019 as detractors of the company created quite a bit of fear towards the middle of the year, driving the stock to a low of $177 in June. A sequence of good news followed, and the stock recovered and reached a high of $379 in front of the truck unveiling. I’m a very simplistic guy when I evaluate success as I use actual success as the measure as opposed to whether I would buy a product. Critics of the truck used Elon’s unsuccessful demonstration of the truck being “bulletproof” and the fact that it was missing mirrors and windshield wipers to criticize it. Since it is not expected to be production ready for about two years this is ridiculous! If the same critics applied a similar level of skepticism to the state of other planned competitive electric vehicles (some of which are two plus years away) one could conclude that none of them will be ready on time. I certainly think the various announced electric vehicles from others will all eventually ship, but do not expect them to match the Tesla battery and software capability given its 3 to 5-year lead. I said I’m a simple guy, so when I evaluate the truck, I look at the 250,000 pre-orders and notice it equates to over $12.5B in incremental revenue for the product! While many of these pre-orders will not convert, others likely will step in. To me that is strong indication that the truck will be an important contributor to Tesla growth once it goes into production.
Tesla stock recovered from the bad press surrounding the truck as orders for it mounted, the Chinese factory launch was on target and back order volume in the U.S. kept factories at maximum production. Given a late year run the stock was up to $418 by year end, up 34.9% from the January opening price. But for continuing recommendations I use the prior year’s close as the benchmark (for measuring my performance) which places the gain at a lower 25.6% year over year as the January opening price was lower than the December 31 close. Either way this was a successful recommendation.
Facebook Stock will outpace the market (it closed last year at $131/share)
Facebook, like Tesla, has many critics regarding its stock. In 2018 this led to a 28% decline in the stock. The problem for the critics is that it keeps turning out very strong financial numbers and eventually the stock price has to recognize that. It appears that 2019 revenue will be up roughly 30% over 2018. After several quarters of extraordinary expenses, the company returned to “normal” earnings levels of about 35% of revenue in the September quarter. I expect Q4 to be at a similar or even stronger profit level as it is the seasonally strongest quarter of the year given the company’s ability to charge high Christmas season advertising rates. As a result, the stock has had a banner year increasing to $205/share at year-end up 57% over the prior year’s close making this pick one of my three major winners.
Amazon Stock will outpace the market (it opened the year at $1502/share)
Amazon had another very solid growth year and the stock kept pace with its growth. Revenue will be up about 20% over 2018 and gross margins remain in the 40% range. For Amazon, Q4 is a wildly seasonal quarter where revenue could jump by close to 30% sequentially. While the incremental revenue tends to have gross margins in the 25% – 30% range as it is heavily driven by ecommerce, the company could post a solid profit increase over Q3. The stock pretty much followed revenue growth, posting a 23% year over year gain closing the year at $1848 per share. I view this as another winner, but it slightly under-performed the S&P index.
Stitch Fix stock appreciation will outpace the market (it closed last year at $17/share)
Stitch Fix, unlike many of the recent IPO companies, has shown an ability to balance growth and earnings. In its fiscal year ending in July, year over year growth increased from 26% in FY 2018 to over 28% in FY 2019 (although without the extra week in Q4 of FY 2019 year over year growth would have been about the same as the prior year). For fiscal 2020, the company guidance is for 23% – 25% revenue growth after adjusting for the extra week in Q4 of FY 2019. On December 9th, Stitch Fix reported Q1 results that exceeded market expectations. The stock reacted well ending the year at $25.66 per share and the year over year gain in calendar 2019 moved to a stellar level of 51% over the 2018 closing price.
DocuSign stock will outpace the market in 2019 (it is currently at $43/share and opened the year at $41)
DocuSign continued to execute well throughout calendar 2019. On December 5th it reported 40% revenue growth in its October quarter, exceeding analyst expectations. Given this momentum, DocuSign stock was the largest gainer among our 5 picks at 72% for the year ending at just over $74 per share (since this was a new recommendation, I used the higher $43 price at the time of the post to measure performance). The company also gave evidence that it is reducing losses and not burning cash. Since ~95% of its revenue is subscription, the company is able to maintain close to 80% gross margin (on a proforma basis) and is well positioned to continue to drive growth. But, remember that growth declines for very high growth companies so I would expect somewhat slower growth than 40% in 2020.
Replacing cashiers with technology will be proven out in 2019
A year ago, I emphasized that Amazon was in the early experimental phase of its Go Stores which are essentially cashierless using technology to record purchases and to bill for them. The company now has opened or announced 21 of these stores. The pace is slower than I expected as Amazon is still optimizing the experience and lowering the cost of the technology. Now, according to Bloomberg, the company appears ready to:
Open larger format supermarkets using the technology
Increase the pace of adding smaller format locations
Begin licensing the technology to other retailers, replicating the strategy it deployed in rolling out Amazon Web Services to others
Replacing cooks, baristas, and waitstaff with robots will begin to be proven in 2019
The rise of the robots for replacing baristas, cooks and waitstaff did indeed accelerate in 2019. In the coffee arena, Briggo now has robots making coffee in 7 locations (soon to be in SFO and already in the Austin Airport), Café X robotic coffee makers are now in 3 locations, and there are even other robots making coffee in Russia (GBL Robotics), Australia (Aabak) and Japan (HIS Co). There is similar expansion of robotic pizza and burger cooks from players like Zume Pizza and Creator and numerous robots now serving food. This emerging trend has been proven to work. As the cost of robots decline and minimum wage rises there will be further expansion of this usage including franchise approaches that might start in 2020.
Influencers will be increasingly utilized to directly drive commerce
The use of influencers to drive commerce accelerated in 2019. Possibly the most important development in the arena was the April 2019 launch by Instagram of social commerce. Instagram now let’s influencers use the app to tag and sell products directly, that is, their posts can be “shoppable”. Part of the series of steps Instagram took was adding “checkout” which lets customers purchase products without leaving the walls of the app.
A second increase in the trend is for major influencers to own a portion of companies that depend on their influence to drive a large volume of traffic. In that way they can capture more of the value of their immense influence. Using this concept, Rihanna has become the wealthiest female musician in the world at an estimated net worth of $600 million. The vast majority of her wealth is from ownership in companies where she uses her influence to drive revenue. The two primary ones are Fenty Beauty and Fenty Maison. Fenty Beauty was launched in late 2017 and appears to be valued at over $3 billion. Rihanna owns 15% – do the math! Fenty Maison is a partnership between LVMH (the largest luxury brand owner) and Rihanna announced in May of 2019. It is targeting fashion products and marks the first time the luxury conglomerate has launched a fashion brand from scratch since 1987. Rihanna has more than 70 million followers on Instagram and this clearly establishes her as someone who can influence commerce.
The Cannabis Sector should show substantial gains in 2019
The accuracy of this forecast was a mixed bag as the key companies grew revenue at extremely high rates, but their stock valuations declined resulting in poor performance of the cannabis index (which I had said should be a barometer). A few examples of the performance of the largest public companies in the sector are shown in Table 2.
Table 2: Performance of Largest Public Cannabis Companies
*Note: Canopy last quarter was Sept 2019
In each case, the last reported quarter was calendar Q3. For Tilray, I subtracted the revenue from its acquisition of Manitoba Harvest so that the growth shown is organic growth. I consider this forecast a hit and a miss as I was correct regarding revenue (it was up an average of 282%) but the stocks did not follow suit, even modestly, as the average of the three was a decline of 54%. While my forecast was not for any individual company or stock in the sector, it was wrong regarding the stocks but right regarding company growth. The conclusion is humbling as I’m glad that I exercised constraint in not investing in a sector where I do not have solid knowledge of the way the stocks might perform.
2019 will be the year of the unicorn IPO
This proved true as many of the largest unicorns went public in 2019. Some of the most famous ones included on the list are: Beyond Meat, Chewy, Lyft, Peloton, Pinterest, Slack, The Real Real, Uber and Zoom. Of the 9 shown, four had initial valuations between $8 billion and $12 billion, two over $20 billion and Uber was the highest at an $82 billion valuation. Some unicorns found the public markets not as accepting of losses as the private market, with Lyft and Uber stock coming under considerable pressure and WeWork unable to find public buyers of its stock leading to a failed IPO and shakeup of company management. There is more to come in 2020 including another mega one: Airbnb.
2020 Predictions coming soon
Stay tuned for my top ten predictions for 2020…but please note that all 5 of the stocks recommended for 2019 will remain on the list.
Soundbyte
Before the basketball season began, I had a post predicting that the Warriors still had a reasonable chance to make the playoffs (if Klay returned in late February). Talk about feeling humble! I guess, counting this I had 3 misses on my predictions.
Advanced metrics for Customer Acquisition Cost (CAC) and Lifetime Value (LTV)
What is the purpose of CAC, LTV and Payback Period?
Often entrepreneurs we meet have a list of their KPI’s, but as we dig deeper, it becomes clear that they don’t fully comprehend the purpose of the KPI or why we think that they are so critical in helping us understand the health of a business. I’m a believer in thoroughly understanding the economics of your business, and the metrics around Customer Acquisition Cost (CAC), Customer Lifetime Revenue (LTR), Customer Lifetime Value (LTV) and Payback Period are important metrics to work on improving. In this post we use the word customer to mean a ‘buyer’, someone who actually orders product and will use customer and buyer interchangeably.
LTR (Customer Lifetime Revenue) is the total revenue from a customer over their estimated lifetime (we prefer using 5 years as representing lifetime)
MCA (Marketing Spend for Customer Acquisition) is the marketing cost directed towards new customer acquisition
CAC (Customer Acquisition Cost) captures the cost of acquiring a new buyer
LTV (Customer Lifetime Value) is the estimated lifetime profits on new customers once they have been acquired
Net LTV is the estimated lifetime profits on a new customer taking acquisition cost into account or: LTV – CAC
Payback Period is the time for a new customer to generate profits that equals his or her CAC
When LTV is compared to CAC a measure of the future health of the business can be seen. Most VCs will be loath to invest in any company where the ratio of LTV/CAC is less than 3X and enthusiastic when it exceeds 5X. I also favor companies with a short payback period especially if the recovery is from the first transaction as this means almost no cash is consumed when acquiring a customer.
I have previously written about Contribution Margin (gross margin less marketing and sales spend) being one of the most important metrics for companies as it tells me how scaling revenue will help cover G&A and R&D costs. Once Contribution Margin exceeds these costs there is operating profit. A company with low Contribution Margin needs much greater scale to be able to reach profitability than one with high Contribution Margin. Both the LTV/CAC ratio and Payback Period are important predictors of future Contribution Margin levels. Table 1 shows two companies with the same revenue, R&D and G&A cost. Assuming R&D and G&A are fixed for both, at 5% Contribution Margin Company A would need to reach $50 million in revenue to break-even while Company B would be at break-even at under $4 million in revenue given its 65% Contribution Margin.
Break Even Revenue = (R&D + G&A)/ (Contribution Margin %)
For Company A = $2,500,000/ (5%) = $50,000,000
For Company B = $2,500,000/ (65%) = $3,846,154
The problem for Company A stems from the fact that for every $40 spent in acquiring a customer the total LTV (or subsequent profits on the customer) is only $76 making Net LTV $36. With such a low ratio of LTV/CAC, Contribution Margin is also quite low. I’ve chosen two extremes in gross margin to better illustrate the impact of gross margin on Contribution Margin.
Table 1: Illustrative Example on the Importance of Contribution Margin
In a second example, Table 2, we show the impact of much more efficient marketing and remarketing on a company’s results. We assume gross margin, R&D and G&A are the same for Company C and Company D, but that Company D is much more efficient at acquiring and retaining customers, resulting in a lower CAC and a higher LTR and LTV for Company D. This could be due to higher spending on branding and remarketing, but also because they are very focused on the metrics that help them optimize acquisition and LTR. The result is considerably higher LTV/CAC and significantly higher Contribution Margin.
Table 2: Impact of Efficient Marketing & Remarketing on a Company’s Results
A few rules regarding Contribution Margin
Higher Gross Margin means greater opportunity for high Contribution Margin – for example, Company A at 20% Gross Margin is severely limited in reaching a reasonable Contribution Margin while Company B at 80% Gross Margin has an opportunity for high Contribution Margin and can reach profitability at lower revenue levels
Companies with many new customers acquired through “free” methods like SEO, viral marketing, etc. have higher Contribution Margins than similar companies with a low proportion of free acquisitions. Notice Company D can spend less on marketing than Company C because it acquires half of its customers from free sources whereas Company C has none from free sources.
Returning buyers contribute heavily to Contribution Margin since they require little if any marketing cost. A high LTV/CAC ratio usually means customers return more often, which in turn should increase future Contribution Margin. Company D with its very high LTV/CAC likely has much lower churn than Company C and therefore most of its marketing spend is for adding incremental customers rather than just replacing those that churn. If a company simply stopped spending on marketing, its revenue would be from existing customers and new customers acquired from free methods making Contribution Margin roughly equal to Gross Margin. Of course, lack of marketing could have a major impact on future growth
All other things being equal, companies with short Payback Periods tend to have higher Contribution Margin than those with longer Payback Periods
Marketing Spend on Branding versus Customer Acquisition
Branding is the communication of characteristics, values and attributes of an organization and its products. What is the purpose of spending on branding? To create a strong image of the company and its products so that existing customers want to stay and spending on customer acquisition will be more efficient. Great brands should have a lower CAC and higher LTV than weak brands.
Nike’s “Just Do It” campaign worked well in establishing a brand message that resonated. Their more recent campaign centered around Colin Kaepernick was riskier as it had pictures of the quarterback and the slogan: “Believe in something even if it means sacrificing everything”. While Kaepernick is controversial, he appeals to a large part of the Nike existing and potential buying audience. The campaign helped lift sales by 27% in the first 4 days following the ad launch. Karen McFarlane, founder Kaye Media Partners summed up Nike’s strategy: “Nike’s mission is to bring inspiration and innovation to every athlete in the world. Colin Kaepernick, through his advocacy, conviction, and talent on and off the field, exemplifies those values in the strongest of terms. Couple that with Nike’s commitment to diversity and community, particularly against the backdrop of today’s America where politics have amplified cultural divisions, Nike took the opportunity to lean into their mission and values.”
Marketing campaigns that are for direct customer acquisition differ from branding campaigns as their goal is to directly acquire customers. It is not always clear whether marketing dollars should be classified as acquisition or branding. The key point is that branding is building for the future, whereas acquisition campaigns are measured by how efficiently they deliver current customers. This brings us back to measuring CAC, as the question becomes whether branding campaigns are part of the calculation of CAC. I believe they are not, as CAC should represent the direct cost of acquiring a customer so that increasing that spend will allow us to estimate how many more customers will result. So, I conclude that marketing for branding should be excluded from the calculation of CAC but can be an important strategy to improve efficiency in acquiring customers and maximizing their value. It should be part of the Contribution Margin calculation.
Paid CAC vs Blended CAC
If CAC represents what it costs to acquire a customer, what about those customers that are acquired through SEO, viral marketing, or some other free method? If one simply divides the spend on Marketing for Customer Acquisition (or MCA) by the total number of new customers, the result will be deceptive if it is used to estimate how many more customers will be acquired if MCA spend is increased. Instead companies should calculate CAC in two ways:
Blended CAC = MCA/ (total number of new customers)
Acquisition CAC = MCA/ (number of new customers generated from acquisition marketing only)
Attribution Models and how they help understand CAC by Channel
CAC helps predict the impact of different levels of spending on marketing. Companies also need to know where spending has the best impact, and therefore need to calculate a CAC (and LTV) for each channel of marketing. If a company uses multiple channels like Facebook, Google, and Snap they need to assign credit to each channel for the customers generated from that channel as compared to the spend for that channel to determine the channel CAC. The most simplistic way of doing this is to say, for example, that Google advertising gets credit for the customer if the purchase by the customer occurs after clicking to the site from Google. But what if a consumer sees a Facebook ad, goes to the site to look at products, then a week later comes back to the site from a Snap ad, and then visits the site again because the company sent them an email that they click on, and finally buys something after clicking on a Google ad? Should Google get the entire credit for the customer?
Attribution models from companies like Amplitude and Hive attempt to appropriately credit each channel touchpoint for the role it played in acquiring a customer. For example, a company might assign 50% of the credit to the last touchpoint and divide the other 50% equally among prior touchpoints or use some other formula that is believed to capture how each channel participated in driving that consumer towards a purchase. Attribution models attempt to help companies understand how scaling spend in each channel will impact customer acquisition. For example:
Google CAC = (Google marketing spend)/ (number of customers attributed to Google ads)
One question that arises when using attribution models to credit each channel is whether “free” areas should share the credit when both paid and free touchpoints occur before converting a consumer into a buyer. The issue is whether the free touchpoints would have occurred had the company not spent on paid marketing. In my prior example the customer would never have received an email from the company had they not first seen the Facebook and Snap ads so eliminating these ads would also eliminate the email which in turn probably means they never would have become a customer. In a similar way, someone who clicked on a Google ad but did not buy, might later do a search for the product, and go to the site from SEO and then buy. So, one method of assigning attribution would be to divide the entire attribution among paid channels if a consumer touched both paid and free ones before becoming a customer. If the consumer only went to free channels, then they would count in blended CAC but not as a customer in calculating paid CAC or CAC by paid channel.
Where does Marketing to an existing customer fit in?
CAC is meant to measure new customer acquisition. So, marketing to an existing customer to get them to buy more should not be part of CAC but rather should be subtracted from MCA. I view it as a cost that reduces Lifetime Value (LTV). Many startups ignore the possibility of “reactivating” churned customers through marketing spend. Several Azure portfolio companies have seen success in deploying a reactivation strategy. I consider this spend as marketing to an existing customer and resulting profits an increase in LTV. Revising the definition of LTV (see Table 1):
MCA (Marketing Cost for Customer Acquisition) = Marketing Costs – branding costs – marketing to existing customers
In Table 1, remarketing expense is 1% of Lifetime revenue for both Company A and Company B or:
Company A LTV = (GM% – remarketing%) X LTR = (20% – 1%) X $400 = $76
Company B LTV = (80%– 1%) X $400 = $316
What about new customers that return the product?
This is a thorny issue. If a consumer buys their first product from a company and then returns it, is she a customer? I think it would not be wrong with interpreting this either way. But I prefer considering her a customer as she was a buyer, and while the return zeros out the revenue from that purchase, she did become a customer. There is ample opportunity for marketing to her again. Considering her a customer lowers CAC as there are more customers for the spend, but it also lowers LTV for the same reason. So, if the interpretation is applied consistently over both CAC and LTV, I believe it would be correct.
More mature companies should apply the methods shown here to better understand their business
By better understanding acquisition CAC and LTV of each channel of customer acquisition a company can direct more spending to the most efficient ones (those with the highest LTV/CAC). By experimenting with “reactivation” spending a company can determine if this improves LTV/CAC. Companies that improve LTV/CAC will likely generate higher Contribution Margin. Those that increase the proportion of customers acquired for “free” can also improve Contribution Margin. Improving CAC and LTV can be accomplished in several ways as described in prior posts:
Without proper metrics a company is essentially flying blind and will be far less likely to succeed. This post provides a blueprint towards a more sophisticated approach to understanding any business.
In our October, 2015 Soundbytes (https://soundbytes2.com/2015/10/) I predicted that Omnichannel selling would
become prevalent over the ensuing years with brick and mortar retailers being
forced to offer an online solution, ecommerce companies needing to access
buyers at physical locations and online brands (referred to as DTC or direct to
consumer) being carried by 3rd party physical stores. Since that
post, these trends have accelerated (including Amazon’s announcement last week that
it is opening another “4-star store” in the bay area). Having had more time to
observe this progression, I have developed several theories regarding this
evolving new world that I would like to share in this post.
Issues for Brick and Mortar Stores when they Create an Online Presence
Physical retailers are not set up to handle
volumes of online sales. Their distribution centers are geared towards sending
larger volumes of products to their stores rather than having the technology
and know-how to deal directly with consumers (a situation which motivated
Walmart to buy Jet for $3.3 billion). In general, a retailer starting to sell
online will need to create one or more new distribution centers that are geared
towards satisfying direct to consumer online demand.
Another rude awakening for brick and mortar
retailers when they go online is a dramatic increase in returns. On average, returns
are about 9% of purchases from a retail store and 30% when purchased online.
The discrepancy is even greater for clothing (especially shoes) as fit becomes
a major issue. Given that consumers expect free shipping, and most want free
return shipping, this becomes a cost that can eviscerate margins. The volume of
returns also creates the problem of handling reverse logistics, that is
tracking the return, crediting the customer, putting it back into the inventory
system as available and restocking it into the appropriate bin location. Then
there is the question as to whether the item can still be resold. For clothing
this may require adding the cost of cleaning and pressing operations to keep
the item fresh and having the systems to track movement of the inventory
through this process.
Lastly, the question becomes whether a
brick and mortar retailers’ online sales will (at least partly) cannibalize
their in-store sales. If so, this, coupled with the growth of online buying, can
make existing store footprints too large, reducing store profits.
If Brick and Mortar Retailers Struggle with an Omnichannel Approach, why
do DTC Brands Want to Create an Offline Presence?
The answer is a pretty simple one: market
access and customer acquisition. Despite
a steady gain of share for online sales, brick and mortar still accounts for
over 70% of consumer purchases. Not too long ago, Facebook was a pretty
efficient channel to acquire customers. For the past 5 years, Azure portfolio
companies have experienced a steep rise in CAC (customer acquisition cost) when
using Facebook as the acquisition vehicle. There are many theories as to why,
but it seems obvious to me that it is simply the law of supply versus demand.
Facebook usage growth has slowed but the demand for ad inventory has increased
dramatically, driving up prices. For large brands that use advertising for
brand building rather than customer acquisition this does not appear to be a
problem, especially when comparing its value to ads on television. For brands
that use it for customer acquisition, doubling CAC changes the ratio of LTV (lifetime
value or lifetime profits on a customer) to CAC making this method of customer
acquisition far less effective.
The combination of these factors has led
larger (and smaller) online brands to open brick and mortar outlets. Players
like Warby Parker, Casper, Bonobos and even Tesla have done it by creating
stores that are a different experience than traditional retail. Warby Parker,
Bonobos and Tesla do not stock inventory but rather use the presence to attract
customers and enable them to try on/test drive their products. I have bought
products, essentially online, while at Warby Parker and Tesla physical locations.
I then had to wait between 2 to 6 weeks for
the product to be manufactured and delivered (see the soundbite on Tesla
below). What this means in each of their cases is that they kept their business
models as ones of “manufacture to demand” rather than build to inventory. It seems clear that for all four of the
companies cited above there is a belief that these physical outlets are a cost
effective way of attracting customers with a CAC that is competitive to online
ads. They also effectively use online follow-up once you have visited their
brick and mortar outlet, thus creating a blend of the two methods. Once the
customer is acquired, repeat purchases may occur directly online or in a combination
of online and offline.
The Future Blend of Online/Offline
While we have seen a steady progression of
companies experimenting with Omnichannel whether they started as offline or
online players, we have yet to see an optimal solution. Rather, various players
have demonstrated parts of that optimization. So, I’d like to outline a few
thoughts regarding what steps might lead to more optimization:
To the degree possible, online purchases by consumers should have an in-store pickup and review option at some savings versus shipping to the home. For clothing, there should also be an opportunity to try the online purchased items on before leaving the store. In that way consumers have the ability to buy online, coupled with the convenience of trying products on in a store. This would expose the customer to a broader set of inventory (online) than even a large footprint store might be able to carry. It would improve fit, lower cost to the brand (by lowering returns and reducing shipping cost) while allowing the brand to begin acquiring better information on fit – insuring an improvement for the next online purchase. A secondary benefit would be the increase in store traffic that was created.
Many retailers will add Rental to the mix of options offered to customers to improve profits. Azure portfolio company, Le Tote, is a subscription rental company for everyday women’s clothes. As women give feedback on a large variety of aspects of fit and preferences it can improve the fit dramatically with each successive box. Retailers need to have systems that replicates this knowledge of their customers. The problem for pure brick and mortar retailers is that they have not had a relationship that enables them to get the feedback…and they don’t have software systems to build this knowledge even if they were to get it. Le Tote has also built up strong knowledge of women’s preferences as to style and has created successful house brands that leverage that knowledge based on massive feedback from subscribers. You may have seen the announcement that Le Tote has just acquired Lord & Taylor, the oldest department store in the country. It plans to use the millions of existing Lord & Taylor customers as a source of potential subscribers to its service. It also has a rental vehicle that can be used to improve monetization of items that don’t sell through at the stores.
Successful online brands will be carried by offline retailers. This has already started to occur but will accelerate over time as DTC brands like Le Tote (and perhaps Stitchfix) use their tens of millions of specific customer feedback data points to produce products that meet the needs expressed in the feedback. If they have correctly mined the data, these brands should be quite successful in offline stores, whether it be their own or a third party retailers’ outlet. The benefit to the retailor in carrying online brands is two-fold: first the online brands that have effectively analyzed their data create products they know can sell in each geography; and second carrying online brands will improve the image of the retailor in the eyes of shoppers who view DTC companies as more forward thinking.
Department store footprints will need to shrink or be shared with online players. The issue discussed earlier of overall ecommerce coupled with brick and mortar stores cannibalizing store demand when they start selling online can be dramatically mitigated by having smaller stores. In that way retailers can maintain their brand presence, continue to get foot traffic, and improve store efficiency. Any larger footprint store may need to take part of its space and either sublet it (as Macys is doing in some locations) or attract online brands that are willing to pay for a presence in those stores in the form of a percentage of revenue generated or rent. The offer to DTC brands may be to have a pop-up for a set period, or to agree to a longer-term relationship. By working with DTC brands in this way retailers can improve gross margin per square foot (a critical KPI for brick and mortar players) for poorly utilized portions of their store footprints. The secondary benefit to the retailer would be that the online brands will generate additional traffic to the stores. There are already a few startups that are creating a store within a store concept that carries DTC brands. They hope to be the middleman between DTC brands and large retailers/shopping malls making it easier for the DTC brands to penetrate more locations, and easier for the retailer to deal with one new player that will install multiple DTC brands in their locations.
There will be more combinations of online and offline companies merging. By doing that the expertise needed for each area of the business can be optimized. The online companies presumably have better software, logistics and more efficient methods of acquiring online customers. The brick and mortar retailers have greater knowledge of running a physical store, an existing footprint to carry the online brands, locations that allow for delivery to their stores, and a customer base to market to online (reducing the CAC and increasing LTV).
For Omnichannel companies, revenue attribution is complex but becomes essential to managing where dollars are spent. Revenue attribution is the tracking, connecting, and crediting marketing efforts to their downstream revenue creation. For example, if a potential customer responds to a Facebook ad by going online to look at items, then visits a store to check them out live, but eventually buys one or more of the items in response to a google ad, the question becomes: which channel should get credit for acquiring the customer? This is important as the answer may impact company strategy and help determine where marketing dollars get spent. Several Azure portfolio companies are now using 3rd party software from companies like Hive to appropriately give attribution to each channel that helped contribute to the eventual sale. This process is important as it helps determine future spending. We expect better run Omnichannel companies to evolve their analysis of marketing to include attribution models.
Conclusion: The future winners in retail will be those that successfully
migrate to the most optimal omnichannel models
What I have described in this post is
inevitable. Some large proportion of customers will always want to do some or
all of their shopping at a brick & mortar store. By blending the positive
attributes of physical retail with the accessibility to the larger number of
options that can exist online, companies can move to more optimal models that
address all potential customers. But unless this is done in an intelligent way
booby traps like inefficient floor space, excessive returns, high shipping
costs and more will rear their ugly heads. This post describes steps for
retailers/brands to take that are a starting point for optimizing an
omnichannel approach.
Soundbytes
When I had just left Wall Street, I received calls from the press and a very large investor in Hewlett Packard regarding my opinion of the proposed acquisition of Compaq Computer. I said: “HP is in 6 business areas with Imaging being their best and PCs their worst. Doubling up on the worst of the 6 does not make sense to me.” When asked what they should do instead, I replied: “Double up on the best business: acquire Xerox.” My how the tide has turned as Xerox was in trouble then and could have been bought at a very low price. Now it appears Xerox may acquire HP. To be clear, Xerox is still a much smaller market cap company…but I’m enjoying seeing how this process will work out.
In the last Soundbytes, I mentioned that I had purchased a Tesla Model 3. What is interesting is that 6 weeks later I am being told that it may take as long as 3-4 more weeks before I receive the car. This means delivery times have extended to at least 9 weeks. I can’t say how reliable this is but the salesperson I am dealing with told me that Tesla has prioritized production of Model S, Model X and shipments to Europe and Asia over even the more expensive versions of Model 3’s (mine cost almost $59,000 before sales tax). One can easily conclude that production must be at full capacity and that the mix this quarter will contain more higher priced cars. So, demand in the quarter appears to be in excess of 100,000 units and price per car appears strong. Assuming the combination of maximum production in the U.S. and some production out of the Chinese factory, supply might also exceed 100,000 units. If the supply is available, then Tesla should have a strong Q4. However, there is the risk that Tesla doesn’t have the parts to supply both factories or that they have somehow become less efficient. The latest thing to drive down the Tesla stock price is the missteps in showcasing the new truck. I’m not sure why a company should be castigated for an esoteric feature not working in a prototype of a product that won’t be in production until sometime in 2021. Remember, Tesla at its core is a technology company producing next gen autos. I’ve seen other technology companies like Microsoft and Oracle have glitches in demos of future products without such a reaction. As for the design of the truck, I believe Tesla is targeting a 10% to 20% share of the truck market with a differentiated product rather than attempting to attract all potential buyers. 10% of the U.S. pickup market would result in 250,000 units per year. The company has announced pre-orders for the vehicle have already reached 200,000. If these orders are real, they have a home run on their hands but since the deposit is only $100 there is no guarantee that all deposits will convert to actual purchases when the truck goes into production.
This post is the third in my series on Key Performance Indicators (KPIs), with a heavy emphasis on contribution margin (CM). Previously, I analyzed why CM is such a strong predictor of success. Given that, companies should consistently look at ways of improving it while still maintaining sufficient growth in their business.
In Azure’s recent full day marketing seminar for our consumer (B2C) focused companies, my session highlighted 6 methods of improving CM:
Increase follow-on sales from existing customers
Raise the average invoice value of the initial and subsequent sales to a customer
Increase GM (Gross Margin) through price increases
Increase GM by reducing cost of goods sold (COGs)
Reduce Blended CAC (cost of customer acquisition) by increasing free or very low cost traffic
Decrease marketing spend as a % of revenue
Before drilling down on each of these I want to define several key terms that will be used throughout the discussion:
Contribution Margin = GM – Marketing/Sales Costs – other cost that vary with sales
Paid CAC = Market Spend/New Customers acquired through this spend
Blended CAC = Market Spend/All new customers
CAC Recovery Time (CAC RT) = the number of months until variable profit on a customer equals CAC
LTV/CAC = Life Time Value (LTV) of a customer/CAC
I will now review each of these strategies and provide some thoughts on how to activate these in consumer-facing businesses:
1. Increase Follow-On sales from existing customers
Since existing customers have little or no cost associated with getting them to buy, this will decrease blended CAC, increasing CM.
Increasing customer retention through improvements in customer care, more interesting and more targeted emails to a customer, or launching a subscription of one kind or another can all help.
On the first point here is an email I received shortly after subscribing to Harry’s, that I thought did an excellent job at engaging me with their customer support, increasing my likelihood to keep my subscription active:
Hi there,
My name is Katie, and I’m a member of the Harry’s team. I wanted to reach out and say thanks for supporting Harry’s.
You are important to us, and I am here to personally help you however I can to make your Harry’s experience as smooth as possible – both literally and figuratively. Please don’t hesitate to reach out with any thoughts or questions about your Harry’s products or Shave Plan, or just life in general. (And just a reminder that your next box is scheduled to ship on October 27th.) Thanks again for your support, and I hope to speak soon!
All the best, Katie
On the subscription concept, think about Amazon Prime. How many of you buy more frequently from Amazon because of being a prime member?
Add to product portfolio. By giving your customers more options of what to buy (all within the concept of your brand) customers are given the opportunity to spend more often.
Make sure your emails are interesting. This will increase the open rate and drive more follow on sales. If all your emails are about discounting your product, then customers will have less interest in opening them and your brand will be devalued. I’ve received emails from numerous sites that say an X% discount is available until a certain date, and then when that date passes, I receive a new offer that is the same or sometimes better. The most frequently opened emails have headers and content that creates interest beyond whatever products you sell. A/B test different headers and different content. It doesn’t matter how small or large you are or how many emails you send, it always pays to try different variations to increase open rates and conversion. Experiment with different messaging to different customer segments like those who purchased recently, those who “liked” an item, those that have never purchased, etc.
Build a Community of your customers. The more you can get customers engaged with you and with each other, the more committed to you they become and the longer they are retained. Think through how you can build an active community among your users through shared photos, videos, chatting, podcasts or events. Most of this should not involve trying to push new purchases but engaging your community to interact with you and each other.
2. Raise the average invoice value of the initial and subsequent sales to a customer
Since shipping costs will not increase proportionately, this will raise GM dollars and therefore CM.
Increase pricing. Most startups underprice their product thinking that will increase market adoption. Even some of the largest companies in the world have found there was ample room to increase prices. Thinking differently, Apple upped prices to over $1,000 for an iPhone. And then increased it again to $1,349 for the top of the line product. Five years ago, how many of you thought people would pay over $1,000 for a cell phone? This shows that unless you A/B test different price points you have no idea whether a price increase is the right strategy.
Upsell logical add-on products. While trying to get a customer to add to their shopping cart may seem obvious, many companies do not do this on a consistent basis. Some examples of ones that have: a flower company added vases to the offer, a mattress company added pillows and sheets; a subscription razor company added shaving gel; a cell phone company added a case. All of these led to reasonable attach rates of the add-on product and higher average invoice value. Testing what you could add to generate upsell should be a constant process.
“Selling” value added services is another form of upsell. This could include things like concierge customer service, service contacts, premier membership with benefits like: invites to special events, early access to new products, reduced shipping cost, preferred discounts on products, etc. If you get your customers to engage in one or more services, you will significantly increase their connection to your product and likely increase retention.
3. Increase Gross Margin through price Increases
Surprisingly, sometimes higher prices position a product as premium (having more value) and generate increased unit sales. Often higher prices generate more revenue even when fewer unit sales result. What may be counter intuitive is that GM$ can increase even if revenue declines. For example, suppose a company has COGs of $50 for a product and is currently pricing it at $100. If a price increase of 20% causes 20% lower unit sales, revenue would decline by 4% while GM$ would increase 12%. Higher gross margin dollars provide more ability to spend on marketing.
4. Improving GM by reducing COGs
Better Pricing: When your volume increases, ask for better pricing from suppliers. Just as its important to price test regularly, its also important to talk to multiple potential suppliers of your parts/product. An existing supplier may not be eager to voluntarily offer a price discount that goes with increased volume but is more likely to do so if it knows you are checking with others.
Changing Packaging: Packaging should be re-examined regularly as improvements may help customer retention. But it also may be possible to lower the cost of the packaging or to change it in a way that lowers shipping costs since that may be based on the size of the box rather than weight.
Shipping Costs: Lower shipping cost per $ of revenue (increasing GM and CM) by generating larger orders. In addition to upsell, this can be done by offering better discounts if the order size is larger. One site I have purchased from offers 10% discount if your net spend (after discount) is over $100, 15% if over $150 and 20% if over $200. Getting to the highest discount lowers the price of the product by enough to motivate buyers (including me) to try to buy over $200 in merchandise. The extra revenue creates incremental product margin dollars and decreases shipping cost as a percentage of revenue. This in turn increases GM$.
For a subscription company this can be done by scheduling less frequent (larger) deliveries. The shipping cost of the larger order will be a much smaller percent of revenue, raising GM.
Opening a Second distribution center to reduce shipping cost. Orders shipped from a west coast distribution center to an east coast customer will have 5 zone pricing. By having a second distribution center in a place like Columbus, Ohio (a frequently used location) those same orders will usually be 1 zone, sometimes 2 zone pricing, resulting in substantial savings per order. The caveat here is that a company needs enough volume for the total savings on orders to exceed the fixed cost of a second distribution center.
5. Improving CM by driving “free” or “nearly free” traffic
The higher the proportion of free or inexpensive traffic to total traffic, the lower the blended CAC.
Improving SEO (search engine optimization). I’ve learned from SEO experts that optimizing SEO is not free, but rather very low cost compared to paid traffic. Our previous post walks through some of the science involved in making improvements. I would suggest using an SEO consultant as it is likely to lead to far better results.
Convert a visitor not ready to buy to an email recipient. If you do that than you will have subsequent opportunities to market to her or him. A slightly costlier version of this is to use remarketing to woo visitors who came to your site but didn’t buy. While using remarketing (advertising) has a cost, it is usually much lower CAC than other methods.
Produce emails that get forwarded and go viral. Such emails need to motivate recipients to forward them due to being very funny, of human interest, etc. While there is typically a product offering embedded in them, the header emphasizes the reason to read it. One Azure portfolio company, Shinesty, recently had an email that was opened by about 7X the number of people it was initially sent to. That generated a lot of potential customers without spending extra marketing dollars. Engaging emails has enabled Shinesty to maintain high CM and high growth.
Use social networking to generate incremental customers. Having the right posts on a social network like Instagram can lead to new potential customers finding out about you and lead to additional sales.
Optimize Customer Retention. Or as my good friend Chris Bruzzo (CMO of EA) spoke about at the Azure Marketing conference: “Love the ones you’re with.” Existing customers are usually the largest source of “free” buyers in a period. The longer you retain a customer, the more repeat buyers you have, increasing contribution margin. So, it’s imperative to take great care of your existing customers.
Drive PR. Like SEO, there is some cost involved in this but if you are judicious in any agency spend and thoughtful in creating news worthy press releases this can be a great source of traffic at a modest cost. However, I recommend you try to understand what you are getting from PR because I have seen situations where the spend did not produce meaningful results.
6. Decrease Marketing Spend as a % of Revenue.
The CAC Recovery Time plays a major role in how to manage your market spend to balance growth and burn. For example, if CAC Recovery Time is one month, spending more will not drive up burn appreciably. If it takes more than a year to recover your CAC, moderating market spend is critical to achieving a reasonable CM. If you recoup CAC faster, you can invest more quickly in the next round of customers. In the consumer space, I won’t invest in a company that has a long (a year or more) CAC Recovery Time as customers are likely to churn in an average of 2-3 years, making it difficult to achieve a reasonable business model. For B2B company’s customer longevity tends to be much longer, and the LTV/CAC can be 5X or more even if CAC Recovery Time is a year.
When a company decreases its market spend as a % of revenue it may experience lower growth but better CM. However, many companies have waste in their marketing spend so it’s important to measure the efficacy of each area of spend separately and to eliminate programs with a low return. This will allow you to reduce the spend with minimal impact on growth rates. There is a balance needed to try to optimize the relationship between CM and revenue growth as higher burn requires raising money more frequently and can put your company at risk. On the other hand, a company generating $1M in revenue needs to be growing at 100% or more to warrant most VCs to consider investing. Since CM should improve with scale, spending more on marketing may be a viable strategy for early stage companies. Once a company reaches $10M in revenue, annual growth of 50% will get it to $76M in revenue in 5 years so such a company should consider better CM rather than driving much higher growth rates and continuing to burn excessive cash.
In summary, Contribution Margin is the lifeblood of a company. If it is weak, the company is likely to fail over time. If it is strong and revenue growth is high, success seems likely. Improving CM is an ongoing process. I realize many of you probably feel much of what I’ve said is obvious, but my question is:“How many of these suggestions are you already doing on a regular basis?”
While you may be using several of the suggestions in this post, I encourage you to try more and to also double down where you can on the ones you already are trying. The results will make your company more valuable!
SoundBytes
I just want to remind readers that my collaborator on my blog posts, Andrea Drager, doesn’t typically take a bow for her significant contributions. Also, in this post, Chris Bruzzo added several improvements that have been incorporated. So many thanks to Andrea and Chris.
Can’t help but comment on the start to the NBA season. Not surprisingly, the Warriors are off to a great start with Curry and Durant leading the way. Greene and Thompson now have moved close to their usual contribution so I’m hopeful that the team can keep up its current pace.
What surprised me early on was the lack of recognition that both Toronto and San Antonio would be greatly improved. Remember, while San Antonio lost Kawhi, he only played a few games last year so with the addition of DeRozan should improve and once again reach the playoffs. For Toronto the change to Kawhi is a marked improvement placing them very competitive with the Celtics for eastern leadership.
I also feel it necessary to comment on the “Las Vegas” Raiders. I call them that already as they have shown zero regard for Oakland fans. While commentators have criticized their trading of all-star level players for draft choices, this is precisely on-strategy. When they get to Vegas they want a brand-new set of rising stars that the new fan base can identify with (using the numerous first round draft choices they traded for), and they don’t mind having the worst record in the league while still in Oakland. I believe Oakland fans should stop attending games as a response. I also think the NFL continues to shoot itself in the foot, allowing one of the most loyal and visible fan bases in the league to once again be abandoned
In the last post I concluded with a brief discussion of Contribution Margin as a key KPI. Recall:
Contribution Margin = Variable Profits – Sales and Marketing Cost
The higher the contribution margin, the more dollars available towards covering G&A. Once contribution margin exceeds G&A, a company reaches operating profits. For simplicity in this post, I’ll use gross margin (GM) as the definition of variable profits even though there may be other costs that vary directly with revenue.
The Drivers of Contribution Margin (CM)
There is an absolute correlation between GM percent and CM. Very high gross margin companies will, in general, get to strong contribution margins and low gross margin companies will struggle to get there. But the sales and marketing needed to drive growth is just as important. There are several underlying factors in how much needs to be spent on sales and marketing to drive growth:
The profits on a new customer relative to the cost of acquiring her (or him). That is, the CAC (customer acquisition cost) for customers derived from paid advertising compared to the profits on those customers’ first purchase
The portion of new traffic that is “free” from SEO (search engine optimization), PR, existing customers recommending your products, etc.
The portion of revenue that comes from repeat customers
The Relationship Between CAC and First Purchase Profits Has a Dramatic Impact on CM
Suppose Company A spends $60 to acquire a customer and has GM of $90 on the initial purchase by that customer. The contribution margin will already be positive $30 without accounting for customers that are organic or those that are repeat customers; in other words, this tends to be extremely positive! Of course, the startups I see in eCommerce are rarely in this situation but those that are can get to profitability fairly quickly if this relationship holds as they scale.
It would be more typical for companies to find that the initial purchase GM only covers a portion of CAC but that subsequent purchases lead to a positive relationship between the LTV (life time value) of the customer and CAC. If I assume the spend to acquire a customer is $60 and the GM is $30 then the CM on the first purchase would be negative (-$30), and it would take a second purchase with the same GM dollars to cover that initial cost. Most startups require several purchases before recovering CAC which in turn means requiring investment dollars to cover the outlay.
Free Traffic and Contribution Margin
If a company can generate a high proportion of free/organic traffic, there is a benefit to contribution margin. CAC is defined as the marketing spend divided by the number of new customers derived from this spend. Blended CAC is defined as the marketing spend divided by all customers who purchased in the period. The more organically generated and return customers, the lower the “blended CAC”. Using the above example, suppose 50% of the new customers for Company A come from organic (free) traffic. Then the “blended CAC“ would be 50% of the paid CAC. In the above example that would be $30 instead of $60 and if the GM was only $30 the initial purchase would cover blended CAC.
Of course, in addition to obtaining customers for free from organic traffic, companies, as they build their customer base, have an increasing opportunity to obtain free traffic by getting existing customers to buy again. So, a company should never forget that maintaining a persistent relationship with customers leads to improved Contribution Margin.
Spending to Drive Higher Growth Can Mean Lower Contribution Margin
Unless the GM on the first purchase a new customer makes exceeds their CAC, there is an inverse relationship between expanding growth and achieving high contribution margin. Think of it this way: suppose that going into a month the likely organic traffic and repeat buyers are somewhat set. Boosting that month’s growth means increasing the number of new paid customers, which in turn makes paid customers a higher proportion of blended CAC and therefore increases CAC. For an example consider the following assumptions for Company B:
The GM is $60 on an average order of $100
Paid CAC is $150
The company will have 1,000 new customers through organic means and 2,000 repeat buyers or $300,000 in revenue with 60% GM ($180,000) from these customers before spending on paid customers
G&A besides marketing for the month will be $150,000
Last year Company B had $400,000 in revenue in the same month
The company is considering the ramifications of targeting 25%, 50% or 100% year-over-year growth
Table 1: The Relationship Between Contribution Margin & Growth
Since the paid CAC is $150 while Gross Margin is only $60 per new customer, each acquired customer generates negative $90 in contribution margin in the period. As can be seen in Table 1, the company would shrink 25% if there is no acquisition spend but would have $180,000 in contribution margin and positive operating profit. On the other end of the spectrum, driving 100% growth requires spending $750,000 to acquire 5,000 new customers and results in a negative $270,000 in contribution margin and an Operating Loss of $420,000 in the period. Of course, if new customers are expected to make multiple future purchases than the number of repeat customers would rise in future periods.
Subscription Models Create More Consistency but are not a Panacea
When a company’s customers are monthly subscribers, each month starts with the prior month’s base less churn. To put it another way, if churn from the prior month is modest (for example 5%) then that month already has 95% of the prior months revenue from repeat customers. Additionally, if the company increases the average invoice value from these customers, it might even have a starting point where return customers account for as much revenue as the prior month. For B-to-B companies, high revenue retention is the norm, where an average customer will pay them for 10 years or more.
Consumer ecommerce subscriptions typically have much more substantial churn, with an average life of two years being closer to the norm. Additionally, the highest level of churn (which can be as much as 30% or more) occurs in the second month, and the next highest, the third month before tapering off. What this means is that companies trying to drive high sequential growth will have a higher % churn rate than those that target more modest growth. Part of a company’s acquisition spend is needed just to stay even. For example, if we assume all new customers come from paid acquisition, the CAC is $200, and that 15% of 10,000 customers churn then the first $300,000 in marketing spend would just serve to replace the churned customers and additional spend would be needed to drive sequential growth.
Investing in Companies with High Contribution Margin
As a VC, I tend to appreciate strong business models and like to invest after some baseline proof points are in place. In my last post I outlined a number of metrics that were important ways to track a company’s health with the ratio of LTV (life time value) to CAC being one of the most important. When a company has a high contribution margin they have the time to build that ratio by adding more products or establishing subscriptions without burning through a lot of capital. Further, companies that have a high LTV/CAC ratio should have a high contribution margin as they mature since this usually means customers buy many times – leading to an expansion in repeat business as part of each month’s total revenue.
This thought process also applies to public companies. One of the most extreme is Facebook, which I’ve owned and recommended for five years. Even after the recent pullback its stock price is about 7x what it was five years ago (or has appreciated at a compound rate of nearly 50% per year since I’ve been recommending it). Not a surprise as Facebook’s contribution margin runs over 70% and revenue was up year/year 42% in Q2. These are extraordinary numbers for a company its size.
To give the reader some idea of how this method can be used as one screen for public companies, Table 2 shows gross margin, contribution margin, revenue growth and this year’s stock market performance for seven public companies.
Table 2: Public Company Contribution Margin Analysis
Two of the seven companies shown stand out as having both high Contribution Margin and strong revenue growth: Etsy and Stitch Fix. Each had year/year revenue growth of around 30% in Q2 coupled with 44% and 29% contribution margins, respectively. This likely has been a factor in Stitch Fix stock appreciating 53% and Etsy 135% since the beginning of the year.
Three of the seven have weak models and are struggling to balance revenue growth and contribution margin: Blue Apron, Overstock, and Groupon. Both Blue Apron and Groupon have been attempting to reduce their losses by dropping their marketing spend. While this increased their CM by 10% and 20% respectively, it also meant that they both have negative growth while still losing money. The losses for Blue Apron were over 16% of revenue. This coupled with shrinking revenue feels like a lethal combination. Blue Apron stock is only down a marginal amount year-to-date but is 59% lower than one year ago. Groupon, because of much higher gross margins than Blue Apron (52% vs 35%), still seems to have a chance to turn things around, but does have a lot of work to do. Overstock went in the other direction, increasing marketing spend to drive modest revenue growth of 12%. But this led to a negative CM and substantially increased losses. That strategy did not seem to benefit shareholders as the stock has declined 53% since the beginning of the year.
eBay is a healthy company from a contribution margin point of view but has sub 10% revenue growth. I can’t tell if increasing their market spend by a substantial amount (at the cost of lower CM) would be a better balance for them.
For me, Spotify is the one anomaly in the table as its stock has appreciated 46% since the IPO despite weak contribution margins which was one reason for my negative view expressed in a prior post. I think that is driven by three reasons: its product is an iconic brand; there is not a lot of float in the stock creating some scarcity; and contribution margin has been improving giving bulls on the stock a belief that it can get to profitability eventually. I say it is an anomaly, as comparing it to Facebook, it is hard to justify the relative valuations. Facebook grew 42% in Q2, Spotify 26%; Facebook is trading at a P/E of 24 whereas even if we assume Spotify can eventually get to generating 6% net profit (it currently is at a 7% loss before finance charges and 31% loss after finance charges, so this feels optimistic) Spotify would be trading at 112 times this theoretic future earnings.
SoundBytes
I found the recent controversy over Elon Musk’s sharing his thoughts on taking Tesla private interesting. On the one hand, people want transparency from companies and Elon certainly provides that! On the other hand, it clearly impacted the stock price for a few days and the SEC abhors anything that can be construed as stock manipulation. Of course, Elon may not have been as careful as he should have been when he sent out his tweet regarding whether financing was lined up…but like most entrepreneurs he was optimistic.
In working with early stage businesses, I often get the question as to what metrics should management and the board use to help understand a company’s progress. It is important for every company to establish a set of consistent KPIs that are used to objectively track progress. While these need to be a part of each board package, it is even more important for the executive team to utilize this for managing their company. While this post focuses on SaaS/Subscription companies, the majority of it applies to most other types of businesses.
Areas KPIs Should Cover
P&L Trends
MRR (Monthly Recurring Revenue) and LTR (Lifetime Revenue)
CAC (Cost of Customer Acquisition)
Marketing to create leads
Customers acquired electronically
Customers acquired using sales professionals
Gross Margin and LTV (Life Time Value of a customer)
Marketing Efficiency
Many companies will also need KPIs regarding inventory in addition to the ones above.
While there may be very complex analysis behind some of these numbers, it’s important to try to keep KPIs to 2-5 pages of a board package. Use of the right KPIs will give a solid, objective, consistent top-down view of the company’s progress. The P&L portion of the package is obviously critical, but I have a possibly unique view on how this should be included in the body of a board package.
P&L Trends: Less is More
One mistake many companies make is confusing detail with better analysis. I often see models that have 50-100 line items for expenses and show this by month for 3 or more years out… but show one or no years of history. What this does is waste a great deal of time on predicting things that are inconsequential and controllable (by month), while eliminating all perspective. Things like seasonality are lost if one is unable to view 3 years of revenue at a time without scrolling from page to page. Of course, for the current year’s budget it is appropriate for management to establish monthly expectations in detail, but for any long-term planning, success revolves around revenue, gross margins, marketing/sales spend and the number of employees. For some companies that are deep technology players there may be significant costs in R&D other than payroll, but this is the exception. By using a simple formula for G&A based on the number of employees, the board can apply a sanity check on whether cost estimates in the long-term model will be on target assuming revenue is on target. So why spend excessive time on nits? Aggregating cost frees up time for better understanding how and why revenue will ramp, the relationship between revenue types and gross margin, the cost of acquiring a customer, the lifetime value of a customer and the average spend per employee.
In a similar way, the board is well served by viewing a simple P&L by quarter for 2 prior years plus the current one (with a forecast of remaining quarters). The lines could be:
Table1: P&L by Quarter
A second version of the P&L should be produced for budget comparison purposes. It should have the same rows but have the columns be current period actual, current period budget, year to date (YTD) actual, year to date budget, current full year forecast, budget for the full year.
Table 2: P&L Actual / Budget Comparison
Tracking MRR and LTR
For any SaaS/Subscription company (I’ll simply refer to this as SaaS going forward) MRR growth is the lifeblood of the company with two caveats: excessive churn makes MRR less valuable and excessive cost in growing MRR also leads to deceptive prosperity. More about that further on. MRR should be viewed on a rolling basis. It can be done by quarter for the board but by month for the management team. Doing it by quarter for the board enables seeing a 3-year trend on one page and gives the board sufficient perspective for oversight. Management needs to track this monthly to better manage the business. A relatively simple set of KPIs for each of 12 quarterly periods would be:
Table 3: MRR and Retention
Calculating Life Time Revenue through Cohort Analysis
The detailed method of calculating LTR does not need to be shown in every board package but should be included at least once per year, but calculated monthly for management.
The LTR calculation uses a grid where the columns would be the various Quarterly cohorts, that is all customers that first purchased that quarter (management might also do this using monthly instead of quarterly). This analysis can be applied to non-SaaS companies as well as SaaS entities. The first row would be the number of customers in the cohort. The next row would be the first month’s revenue for the cohort, the next the second months revenue, and so on until reaching 36 months (or whatever number the board prefers for B2B…I prefer 60 months). The next row would be the total for the full period and the final row would be the average Lifetime Revenue, LTR, per member of the cohort.
Table 4: Customer Lifetime Revenue
A second table would replicate the grid but show average per member of the cohort for each month (row). That table allows comparisons of cohorts to see if the average revenue of a newer cohort is getting better or worse than older ones for month 2 or month 6 or month 36, etc.
Table 5: Average Revenue per Cohort
Cohorts that have a full 36 months of data need to be at least 36 months old. What this means is that more recent cohorts will not have a full set of information but still can be used to see what trends have occurred. For example, is the second months average revenue for a current cohort much less than it was for a cohort one year ago? While newer cohorts do not have full sets of monthly revenue data, they still are very relevant in calculating more recent LTR. This can be done by using average monthly declines in sequential months and applying them to cohorts with fewer months of data.
Customer Acquisition Cost (CAC)
Calculating CAC is done in a variety of ways and is quite different for customers acquired electronically versus those obtained by a sales force. Many companies I’ve seen have a combination of the two.
Marketing used to generate leads should always be considered part of CAC. The marketing cost in a month first is divided by the number of leads to generate a cost/lead. The next step is to estimate the conversion rate of leads to customers. A simple table would be as follows:
Table 6: Customer Acquisition Costs
For an eCommerce company, the additional cost to convert might be one free month of product or a heavily subsidized price for the first month. If the customer is getting the item before becoming a regular paying customer than the CAC would be:
CAC = MCTC / the percent that converts from the promotional trial to a paying customer.
CAC when a Sales Force is Involved
For many eCommerce companies and B2B companies that sell electronically, marketing is the primary cost involved in acquiring a paying customer. For those utilizing a sales force, the marketing expense plus the sales expense must be accumulated to determine CAC.
Typically, what this means is steps 1 through 3 above would still be used to determine CPL, but step 1 above might include marketing personnel used to generate leads plus external marketing spend:
CPL (cost per lead) as above
Sales Cost = current month’s cost of the sales force including T&E
New Customers in the month = NC
Conversion Rate to Customer = NC/number of leads= Y%
CAC = CPL/Y% + (Sales Cost)/NC
There are many nuances ignored in the simple method shown. For example, some leads may take many months to close. Some may go through a pilot before closing. Therefore, there are more sophisticated methods of calculating CAC but using this method would begin the process of understanding an important indicator of efficiency of customer acquisition.
Gross Margin (GM) is a Critical Part of the Equation
While revenue is obviously an important measure of success, not all revenue is the same. Revenue that generates 90% gross margin is a lot more valuable per dollar than revenue that generates 15% gross margin. When measuring a company’s potential for future success it’s important to understand what level of revenue is required to reach profitability. A first step is understanding how gross margin may evolve. When a business scales there are many opportunities to improve margins:
Larger volumes may lead to larger discounts from suppliers
Larger volumes for products that are software/content may lower the hosting cost as a percent of revenue
Shipping to a larger number of customers may allow opening additional distribution centers (DCs) to facilitate serving customers from a DC closer to their location lowering shipping cost
Larger volumes may mean improved efficiency in the warehouse. For example, it may make more automation cost effective
When forecasting gross margin, it is important to be cautious in predicting some of these savings. The board should question radical changes in GM in the forecast. Certain efficiencies should be seen in a quarterly trend, and a marked improvement from the trend needs to be justified. The more significant jump in GM from a second DC can be calculated by looking at the change in shipping rates for customers that will be serviced from the new DC vs what rates are for these customers from the existing one.
Calculating LTV (Lifetime Value)
Gross Margin, by itself may be off as a measure of variable profits of a customer. If payment is by credit card, then the credit card cost per customer is part of variable costs. Some companies do not include shipping charges as part of cost of goods, but they should always be part of variable cost. Customer service cost is typically another cost that rises in proportion to the number of customers. So:
Variable cost = Cost of Goods sold plus any cost that varies directly with sales
The calculation of VP% should be based on current numbers as they will apply going forward. Determining a company’s marketing efficiency requires comparing LTV to the cost of customer acquisition. As mentioned earlier in the post, if the CAC is too large a proportion of LTV, a company may be showing deceptive (profitless) growth. So, the next set of KPIs address marketing efficiency.
Marketing Efficiency
It does not make sense to invest in an inefficient company as they will burn through capital at a rapid rate and will find it difficult to become profitable. A key measure of efficiency is the relationship between LTV and CAC or LTV/CAC. Essentially this is how many dollars of variable profit the company will make for every dollar it spends on marketing and sales. A ratio of 5 or more usually means the company is efficient. The period used for calculating LTR will influence this number. Since churn tends to be much lower for B2B companies, 5 years is often used to calculate LTR and LTV. But, using 5 years means waiting longer to receive resulting profits and can obscure cash flow implications of slower recovery of CAC. So, a second metric important to understand burn is how long it takes to recover CAC:
CAC Recovery Time = number of months until variable profit equals the CAC
The longer the CAC recovery time, the more capital required to finance growth. Of course, existing customers are also contributing to the month’s revenue alongside new customers. So, another interesting KPI is contribution margin which measures the current state of balance between marketing/sales and Variable Profits:
Contribution Margin = Variable Profits – Sales and Marketing Cost
Early on this number will be negative as there aren’t enough older customers to cover the investment in new ones. But eventually the contribution margin in a month needs to turn positive. To reach profitability it needs to exceed all other costs of the business (G&A, R&D, etc.). By reducing a month’s marketing cost, a company can improve contribution margin that month at the expense of sequential growth… which is why this is a balancing act.
I realize this post is long but wanted to include a substantial portion of KPIs in one post. However, I’ll leave more detailed measurement of sales force productivity and deeper analysis of several of the KPIs discussed here for one or more future posts.
Soundbytes
I’ll begin by apologizing for a midyear brag, but I always tell others to enjoy success and therefore am about to do that myself. In my top ten predictions for 2018 I included a market prediction and 4 stock predictions. I was feeling pretty good that they were all working well when I started to create this post. However, the stock prices for high growth stocks can experience serious shifts in very short periods. Facebook and Tesla both had (what I consider) minor shortfalls against expectations in the 10 days since and have subsequently declined quite a bit in that period. But given the strength of my other two recommendations, Amazon and Stitchfix, the four still have an average gain of 15% as of July 27. Since I’ve only felt comfortable predicting the market when it was easy (after 9/11 and after the 2008 mortgage blowup), I was nervous about predicting the S&P would be up this year as it was a closer call and was somewhat controversial given the length of the bull market prior to this year. But it seemed obvious that the new tax law would be very positive for corporate earnings. So, I thought the S&P would be up despite the likelihood of rising interest rates. So far, it is ahead 4.4% year to date driven by stronger earnings. Since I always fear that my record of annual wins can’t continue I wanted to take a midyear victory lap just in case everything collapses in the second half of the year (which I don’t expect but always fear). So I continue to hold all 4 stocks and in fact bought a bit more Facebook today.
After many years of successfully picking public and private companies to invest in, I thought I’d share some of the core fundamentals I use to think about how a company should be valued. Let me start by saying numerous companies defy the logic that I will lay out in this post, often for good reasons, sometimes for poor ones. However, eventually most companies will likely approach this method, so it should at least be used as a sanity check against valuations.
When a company is young, it may not have any earnings at all, or it may be at an earnings level (relative to revenue) that is expected to rise. In this post, I’ll start by considering more mature companies that are approaching their long-term model for earnings to establish a framework, before addressing how this framework applies to less mature companies. The post will be followed by another one where I apply the rules to Tesla and discuss how it carries over into private companies.
Growth and Earnings are the Starting Points for Valuing Mature Companies
When a company is public, the most frequently cited metric for valuation is its price to earnings ratio (PE). This may be done based on either a trailing 12 months or a forward 12 months. In classic finance theory a company should be valued based on the present value of future cash flows. What this leads to is our first rule:
Rule 1: Higher Growth Rates should result in a higher PE ratio.
When I was on Wall Street, I studied hundreds of growth companies (this analysis does not apply to cyclical companies) over the prior 10-year period and found that there was a very strong correlation between a given year’s revenue growth rate and the next year’s revenue growth rate. While the growth rate usually declined year over year if it was over 10%, on average this decline was less than 20% of the prior year’s growth rate. What this means is that if we took a group of companies with a revenue growth rate of 40% this year, the average organic growth for the group would likely be about 33%-38% the next year. Of course, things like recessions, major new product releases, tax changes, and more could impact this, but over a lengthy period of time this tended to be a good sanity test. As of January 2, 2018, the average S&P company had a PE ratio of 25 on trailing earnings and was growing revenue at 5% per year. Rule 1 implies that companies growing faster should have higher PEs and those growing slower, lower PEs than the average.
Graph 1: Growth Rates vs. Price Earnings Ratios
The graph shows the correlation between growth and PE based on the valuations of 21 public companies. Based on Rule 1, those above the line may be relatively under-priced and those below relatively over-priced. I say ‘may be’ as there are many other factors to consider, and the above is only one of several ways to value companies. Notice that most of the theoretically over-priced companies with growth rates of under 5% are traditional companies that have long histories of success and pay a dividend. What may be the case is that it takes several years for the market to adjust to their changed circumstances or they may be valued based on the return from the dividend. For example, is Coca Cola trading on: past glory, its 3.5% dividend, or is there something about current earnings that is deceptive (revenue growth has been a problem for several years as people switch from soda to healthier drinks)? I am not up to speed enough to know the answer. Those above the line may be buys despite appearing to be highly valued by other measures.
Relatively early in my career (in 1993-1995) I applied this theory to make one of my best calls on Wall Street: “Buy Dell sell Kellogg”. At the time Dell was growing revenue over 50% per year and Kellogg was struggling to grow it over 4% annually (its compounded growth from 1992 to 1995, this was partly based on price increases). Yet Dell’s PE was about half that of Kellogg and well below the S&P average. So, the call, while radical at the time, was an obvious consequence of Rule 1. Fortunately for me, Dell’s stock appreciated over 65X from January 1993 to January 2000 (and well over 100X while I had it as a top pick) while Kellogg, despite large appreciation in the overall stock market, saw its stock decline slightly over the same 7-year period (but holders did receive annual dividends).
Rule 2: Predictability of Revenue and Earnings Growth should drive a higher trailing PE
Investors place a great deal of value on predictability of growth and earnings, which is why companies with subscription/SaaS models tend to get higher multiples than those with regular sales models. It is also why companies with large sales backlogs usually get additional value. In both cases, investors can more readily value the companies on forward earnings since they are more predictable.
Rule 3: Market Opportunity should impact the Valuation of Emerging Leaders
When one considers why high growth rates might persist, the size of the market opportunity should be viewed as a major factor. The trick here is to make sure the market being considered is really the appropriate one for that company. In the early 1990s, Dell had a relatively small share of a rapidly growing PC market. Given its competitive advantages, I expected Dell to gain share in this mushrooming market. At the same time, Kellogg had a stable share of a relatively flat cereal market, hardly a formula for growth. In recent times, I have consistently recommended Facebook in this blog for the very same reasons I had recommended Dell: in 2013, Facebook had a modest share of the online advertising, a market expected to grow rapidly. Given the advantages Facebook had (and they were apparent as I saw every Azure ecommerce portfolio company moving a large portion of marketing spend to Facebook), it was relatively easy for me to realize that Facebook would rapidly gain share. During the time I’ve owned it and recommended it, this has worked out well as the share price is up over 8X.
How the rules can be applied to companies that are pre-profit
As a VC, it is important to evaluate what companies should be valued at well before they are profitable. While this is nearly impossible to do when we first invest (and won’t be covered in this post), it is feasible to get a realistic range when an offer comes in to acquire a portfolio company that has started to mature. Since they are not profitable, how can I apply a PE ratio?
What needs to be done is to try to forecast eventual profitability when the company matures. A first step is to see where current gross margins are and to understand whether they can realistically increase. The word realistic is the key one here. For example, if a young ecommerce company currently has one distribution center on the west coast, like our portfolio company Le Tote, the impact on shipping costs of adding a second eastern distribution center can be modeled based on current customer locations and known shipping rates from each distribution center. Such modeling, in the case of Le Tote, shows that gross margins will increase 5%-7% once the second distribution center is fully functional. On the other hand, a company that builds revenue city by city, like food service providers, may have little opportunity to save on shipping.
Calculating variable Profit Margin
Once the forecast range for “mature” gross margin is estimated, the next step is to identify other costs that will increase in some proportion to revenue. For example, if a company is an ecommerce company that acquires most of its new customers through Facebook, Google and other advertising and has high churn, the spend on customer acquisition may continue to increase in direct proportion to revenue. Similarly, if customer service needs to be labor intensive, this can also be a variable cost. So, the next step in the process is to access where one expects the “variable profit margin” to wind up. While I don’t know the company well, this appears to be a significant issue for Blue Apron: marketing and cost of goods add up to about 90% of revenue. I suspect that customer support probably eats up (no pun intended) 5-10% of what is left, putting variable margins very close to zero. If I assume that the company can eventually generate 10% variable profit margin (which is giving it credit for strong execution), it would need to reach about $4 billion in annual revenue to reach break-even if other costs (product, technology and G&A) do not increase. That means increasing revenue nearly 5-fold. At their current YTD growth rate this would take 9 years and explains why the stock has a low valuation.
Estimating Long Term Net Margin
Once the variable profit margin is determined, the next step would be to estimate what the long-term ratio of all other operating cost might be as a percent of revenue. Using this estimate I can determine a Theoretic Net Earnings Percent. Applying this percent to current (or next years) revenue yields a Theoretic Earnings and a Theoretic PE (TPE):
TPE= Market Cap/Theoretic Earnings
To give you a sense of how I successfully use this, review my recap of the Top Ten Predictions from 2017 where I correctly predicted that Spotify would not go public last year despite strong top line growth as it was hard to see how its business model could support more than 2% or so positive operating margin, and that required renegotiating royalty deals with record labels. Now that Spotify has successfully negotiated a 3% lower royalty rate from several of the labels, it appears that the 16% gross margins in 2016 could rise to 19% or more by the end of 2018. This means that variable margins (after marketing cost) might be 6%. This would narrow its losses, but still means it might be several years before the company achieves the 2% operating margins discussed in that post. As a result, Spotify appears headed for a non-traditional IPO, clearly fearing that portfolio managers would not be likely to value it at its private valuation price since that would lead to a TPE of over 200. Since Spotify is loved by many consumers, individuals might be willing to overpay relative to my valuation analysis.
Our next post will pick up this theme by walking through why this leads me to believe Tesla continues to have upside, and then discussing how entrepreneurs should view exit opportunities.
SoundBytes
I’ve often written about effective shooting percentage relative to Stephen Curry, and once again he leads the league among players who average 15 points or more per game. What also accounts for the Warriors success is the effective shooting of Klay Thompson, who is 3rd in the league, and Kevin Durant who is 6th. Not surprisingly, Lebron is also in the top 10 (4th). The table below shows the top ten among players averaging 15 points or more per game. Of the top ten scorers in the league, 6 are among the top 10 effective shooters with James Harden only slightly behind at 54.8%. The remaining 3 are Cousins (53.0%), Lillard (52.2%), and Westbrook, the only one below the league average of 52.1% at 47.4%.
Table: Top Ten Effective Shooters in the League
*Note: Bolded players denote those in the top 10 in Points per Game
In my recap of 2017 predictions I pointed out how boring my stock predictions have been with Tesla and Facebook on my list every year since 2013 and Amazon on for two of the past three years. But what I learned on Wall Street is that sticking with companies that have strong competitive advantages in a potentially mega-sized market can create great performance over time (assuming one is correct)! So here we go again, because as stated in my January 5 post, I am again including Tesla, Facebook and Amazon in my Top ten list for 2018. I believe they each continue to offer strong upside, as explained below. I’m also adding a younger company, with a modest market cap, thus more potential upside coupled with more risk. The company is Stitch Fix, an early leader in providing women with the ability to shop for fashion-forward clothes at home. My belief in the four companies is backed up by my having an equity position in each of them.
I’m expecting the four stocks to outperform the market. So, in a steeply declining market, out-performance might occur with the stock itself being down (but less than the market). Having mentioned the possibility of a down market, I’m predicting the market will rise this year. This is a bit scary for me, as predicting the market as a whole is not my specialty.
We’ll start with the stock picks (with January 2 opening prices of stocks shown in parenthesis) and then move on to the remainder of my 10 predictions.
1. Tesla stock appreciation will continue to outpace the market (it opened the year at $312/share).
The good news and bad news on Tesla is the delays in production of the Model 3. The good part is that we can still look forward to massive increases in the number of cars the company sells once Tesla gets production ramping (I estimate the Model 3 backlog is well in excess of 500,000 units going into 2018 and demand appears to be growing). In 2017, Tesla shipped between 80,000 and 100,000 vehicles with revenue up 30% in Q3 without help from the model 3. If the company is successful at ramping capacity (and acquiring needed parts), it expects to reach a production rate of 5,000 cars per week by the end of Q1 and 10,000 by the end of the year. That could mean that the number of units produced in Q4 2018 will be more than four times that sold in Q4 2017 (with revenue about 2.0-2.5x due to the Model 3 being a lower priced car). Additionally, while it is modest compared to revenue from selling autos, the company appears to be the leader in battery production. It recently announced the largest battery deal ever, a $50 million contract (now completed on time) to supply what is essentially a massive backup battery complex for energy to Southern Australia. While this type of project is unlikely to be a major portion of revenue in the near term, it can add to Tesla’s growth rate and profitability.
2. Facebook stock appreciation will continue to outpace the market (it opened the year at $182/share).
The core Facebook user base growth has slowed considerably but Facebook has a product portfolio that includes Instagram, WhatsApp and Oculus. This gives Facebook multiple opportunities for revenue growth: Improve the revenue per DAU (daily active user) on Facebook itself; increase efforts to monetize Instagram and WhatsApp in more meaningful ways; and build the install base of Oculus. Facebook advertising rates have been increasing steadily as more mainstream companies shift budget from traditional advertising to Facebook, especially in view of declining TV viewership coupled with increased use of DVRs (allowing viewers to skip ads). Higher advertising rates, combined with modest growth in DAUs, should lead to continued strong revenue growth. And while the Oculus product did not get out of the gate as fast as expected, it began picking up steam in Q3 2017 after Facebook reduced prices. At 210,000 units for the quarter it may have contributed up to 5% of Q3 revenue. The wild card here is if a “killer app” (a software application that becomes a must have) launches that is only available on the Oculus, sales of Oculus could jump substantially in a short time.
3. Amazon stock appreciation will outpace the market (it opened the year at $1188/share).
Amazon, remarkably, increased its revenue growth rate in 2017 as compared to 2016. This is unusual for companies of this size. In 2018, we expect online to continue to pick up share in retail and Amazon to gain more share of online. The acquisition of Whole Foods will add approximately $4B per quarter in revenue, boosting year/year revenue growth of Amazon an additional 9%-11% per quarter, if Whole Foods revenue remains flattish. If Amazon achieves organic growth of 25% (in Q3 it was 29% so that would be a drop) in 2018, this would put the 3 quarters starting in Q4 2017 at about 35% growth. While we do expect Amazon to boost Whole Foods revenue, that is not required to reach those levels. In Q4 2018, reported revenue will return to organic growth levels. The Amazon story also features two other important growth drivers. First, I expect the Echo to have another substantial growth year and continue to emerge as a new platform in the home. Additionally, Amazon appears poised to benefit from continued business migration to the cloud coupled with increased market share and higher average revenue per cloud customer. This will be driven by modest price increases and introduction of more services as part of its cloud offering. The success of the Amazon Echo with industry leading voice technology should continue to provide another boost to Amazon’s revenue. Additionally, having a large footprint of physical stores will allow Amazon to increase distribution of many products.
4. Stitch Fix stock appreciation will outpace the market (it opened the year at $25/share and is at the same level as I write this post).
Stitch Fix is my riskiest stock forecast. As a new public company, it has yet to establish a track record of performance that one can depend upon. On the other hand, it’s the early leader in a massive market that will increasingly move online, at-home shopping for fashion forward clothes. The number of people who prefer shopping at home to going to a physical store is on the increase. The type of goods they wish to buy expands every year. Now, clothing is becoming a new category on the rapid rise (it grew from 11% of overall clothing retail sales in 2011 to 19% in 2016). It is important for women buying this way to feel that the provider understands what they want and facilitates making it easy to obtain clothes they prefer. Stitch Fix uses substantial data analysis to personalize each box it sends a customer. The woman can try them on, keep (and pay for) those they like, and return the rest very easily.
5. The stock market will rise in 2018 (the S&P opened the year at 2,696 on January 2).
While I have been accurate on recommending individual stocks over a long period, I rarely believe that I understand what will happen to the overall market. Two prior exceptions were after 9/11 and after the 2008 mortgage crisis generated meltdown. I was correct both times but those seemed like easy calls. So, it is with great trepidation that I’m including this prediction as it is based on logic and I know the market does not always follow logic! To put it simply, the new tax bill is quite favorable to corporations and therefore should boost after-tax earnings. What larger corporations pay is often a blend of taxes on U.S. earnings and those on earnings in various countries outside the U.S. There can be numerous other factors as well. Companies like Microsoft have lower blended tax rates because much of R&D and corporate overhead is in the United States and several of its key products are sold out of a subsidiary in a low tax location, thereby lowering the portion of pre-tax earnings here. This and other factors (like tax benefits in fiscal 2017 from previous phone business losses) led to blended tax rates in fiscal 2015, 2016 and 2017 of 34%, 15% and 8%, respectively. Walmart, on the other hand, generated over 75% of its pre-tax earnings in the United States over the past three fiscal years, so their blended rate was over 30% in each of those years
Table 1: Walmart Blended Tax Rates 2015-2017
The degree to which any specific company’s pre-tax earnings mix changes between the United States and other countries is unpredictable to me, so I’m providing a table showing the impact on after-tax earnings growth for theoretical companies instead. Table 2 shows the impact of lowering the U.S. corporate from 35% to 21% on four example companies. To provide context, I show two companies growing pre-tax earnings by 10% and two companies by 30%. If blended tax rates didn’t change, EPS would grow by the same amount as pre-tax earnings. For Companies 1 and 3, Table 2 shows what the increase in earnings would be if their blended 2017 tax rate was 35% and 2018 shifts to 21%. For companies 2 and 4, Table 2 shows what the increase in earnings would be if the 2017 rate was 30% (Walmart’s blended rate the past three years) and the 2018 blended rate is 20%.
Table 2: Impact on After-Tax Earnings Growth
As you can see, companies that have the majority of 2018 pre-tax earnings subject to the full U.S. tax rate could experience EPS growth 15%-30% above their pre-tax earnings growth. On the other hand, if a company has a minimal amount of earnings in the U.S. (like the 5% of earnings Microsoft had in fiscal 2017), the benefit will be minimal. Whatever benefits do accrue will also boost cash, leading to potential investments that could help future earnings. If companies that have maximum benefits from this have no decline in their P/E ratio, this would mean a substantial increase in their share price, thus the forecast of an up market. But as I learned on Wall Street, it’s important to sight risk. The biggest risks to this forecast are the expected rise in interest rates this year (which usually is negative for the market) and the fact that the market is already at all-time highs.
6. Battles between the federal government and states will continue over marijuana use but the cannabis industry will emerge as one to invest in.
The battle over legalization of Marijuana reached a turning point in 2017 as polls showed that over 60% of Americans now favor full legalization (as compared to 12% in 1969). Prior to 2000, only three states (California, Oregon and Maine) had made medical cannabis legal. Now 29 states have made it legal for medical use and six have legalized sale for recreational use. Given the swing in voter sentiment (and a need for additional sources of tax revenue), more states are moving towards legalization for recreational and medical purposes. This has put the “legal” marijuana industry on a torrid growth curve. In Colorado, one of the first states to broadly legalize use, revenue is over $1 billion per year and overall 2017 industry revenue is estimated at nearly $8 billion, up 20% year/year. Given expected legalization by more states and the ability to market product openly once it is legal, New Frontier Data predicts that industry revenue will more than triple by 2025. The industry is making a strong case that medical use has compelling results for a wide variety of illnesses and high margin, medical use is forecast to generate over 50% of the 2025 revenue. Given this backdrop, public cannabis companies have had very strong performance. Despite this, in 2016, VCs only invested about $49 million in the sector. We expect that number to escalate dramatically in 2017 through 2019. While public cannabis stocks are trading at nosebleed valuations, they could have continued strong performance as market share consolidates and more states (and Canada) head towards legalization. One caveat to this is that Federal law still makes marijuana use illegal and the Trump administration is adopting a more aggressive policy towards pursuing producers, even in states that have made use legal. The states that have legalized marijuana use are gearing up to battle the federal government.
7. At least one city will announce a new approach to Urban transport
Traffic congestion in cities continues to worsen. Our post on December 14, 2017 discussed a new approach to urban transportation, utilizing small footprint automated cars (one to two passengers, no trunk, no driver) in a dedicated corridor. This appears much more cost effective than a Rapid Bus Transit solution and far more affordable than new subway lines. As discussed in that post, Uber and other ride services increase traffic and don’t appear to be a solution. The thought that automating these vehicles will relieve pressure is overly optimistic. I expect at least one city to commit to testing the method discussed in the December post before the end of this year – it is unlikely to be a U.S. city. The approach outlined in that post is one of several that is likely to be tried over the coming years as new thinking is clearly needed to prevent the traffic congestion that makes cities less livable.
8. Offline retailers will increase the velocity of moving towards omnichannel.
Retailers will adopt more of a multi-pronged approach to increasing their participation in e-commerce. I expect this to include:
An increased pace of acquisition of e-commerce companies, technologies and brands with Walmart leading the way. Walmart and others need to participate more heavily in online as their core offline business continues to lose share to online. In 2017, Walmart made several large acquisitions and has emerged as the leader among large retailers in moving online. This, in turn, has helped its stock performance. After a stellar 12 months in which the stock was up over 40%, it finally exceeded its January 2015 high of $89 per share (it reached $101/share as we are finalizing the post). I expect Walmart and others in physical retail to make acquisitions that are meaningful in 2018 so as to speed up the transformation of their businesses to an omnichannel approach.
Collaborating to introduce more online/technology into their physical stores (which Amazon is likely to do in Whole Foods stores). This can take the form of screens in the stores to order online (a la William Sonoma), having online purchases shipped to your local store (already done by Nordstrom) and adding substantial ability to use technology to create personalized items right at the store, which would subsequently be produced and shipped by a partner.
9. Social commerce will begin to emerge as a new category.
Many e-commerce sites have added elements of social, and many social sites have begun trying to sell various products. But few of these have a fully integrated social approach to e-commerce. The elements of a social approach to e-commerce include:
A feed-based user experience
Friends’ actions impact your feed
Following trend setters to see what they are buying, wearing, and favoring
Notifications based on your likes and tastes
One click to buy
Following particular stores and/or friends
I expect to see existing e-commerce players adding more elements of social, existing social players improving their approach to commerce and a rising trend of emerging companies focused on fully integrated social commerce.
10. “The Empire Strikes Back”: automobile manufacturers will begin to take steps to reclaim use of its GPS.
It is almost shameful that automobile manufacturers, other than Tesla, have lost substantial usage of their onboard GPS systems as many people use their cell phones or a small device to run Google, Waze (owned by Google) or Garmin instead of the larger screen in their car. In the hundreds of times I’ve taken an Uber or Lyft, I’ve never seen the driver use their car’s system. To modernize their existing systems, manufacturers may need to license software from a third party. Several companies are offering next generation products that claim to replicate the optimization offered by Waze but also add new features that go beyond it like offering to order coffee and other items to enable the driver to stop at a nearby location and have the product prepaid and waiting for them. In addition to adding value to the user, this also leads to a lead-gen revenue opportunity. In 2018, I expect one or more auto manufacturers to commit to including a third-party product in one or more of their models.
Soundbytes
Tesla model 3 sample car generates huge buzz at Stanford Mall in Menlo Park California. This past weekend my wife and I experienced something we had not seen before – a substantial line of people waiting to check out a car, one of the first Model 3 cars seen live. We were walking through the Stanford Mall where Tesla has a “Guide Store” and came upon a line of about 60 people willing to wait a few hours to get to check out one of the two Model 3’s available for perusal in California (the other was in L.A.). An hour later we came back, and the line had grown to 80 people. To be clear, the car was not available for a test drive, only for seeing it, sitting in it, finding out more info, etc. Given the buzz involved, it seems to me that as other locations are given Model 3 cars to look at, the number of people ordering a Model 3 each week might increase faster than Tesla’s capacity to fulfill.
“When I was on Wall Street I became very boring by having the same three strong buy recommendations for many years… until I downgraded Compaq in 1998 (it was about 30X the original price at that point). The other two, Microsoft and Dell, remained strong recommendations until I left Wall Street in 2000. At the time, they were each well over 100X the price of my original recommendation. I mention this because my favorite stocks for this blog include Facebook and Tesla for the 4th year in a row. They are both over 5X what I paid for them in 2013 ($23 and $45, respectively) and I continue to own both. Will they get to 100X or more? This is not likely, as companies like them have had much higher valuations when going public compared with Microsoft or Dell, but I believe they continue to offer strong upside, as explained below.”
Be advised that my top ten for 2018 will continue to include all three picks from 2017. I’m quite pleased that I continue to be fortunate, as the three were up an average of 53% in 2017. Furthermore, each of my top ten forecasts proved pretty accurate, as well!
I’ve listed in bold the 2017 stock picks and trend forecasts below, and give a personal evaluation of how I fared on each. For context, the S&P was up 19% and the Nasdaq 28% in 2017.
Tesla stock appreciation will continue to outpace the market. Tesla, once again, posted very strong performance. While the Model 3 experienced considerable delays, backorders for it continued to climb as ratings were very strong. As of mid-August, Tesla was adding a net of 1,800 orders per day and I believe it probably closed the year at over a 500,000-unit backlog. So, while the stock tailed off a bit from its high ($385 in September), it was up 45% from January 3, 2017 to January 2, 2018 and ended the year at 7 times the original price I paid in 2013 when I started recommending it. Its competitors are working hard to catch up, but they are still trailing by quite a bit.
Facebook stock appreciation will continue to outpace the market. Facebook stock appreciated 57% year/year and opened on January 2, 2018 at $182 (nearly 8 times my original price paid in 2013 when I started recommending it). This was on the heels of 47% revenue growth (through 3 quarters) and even higher earnings growth.
Amazon stock appreciation will outpace the market. Amazon stock appreciated 57% in 2017 and opened on January 2, 2018 at $1,188 per share. It had been on my recommended list in 2015 when it appreciated 137%. Taking it off in 2016 was based on Amazon’s stock price getting a bit ahead of itself (and revenue did catch up that year growing 25% while the stock was only up about 12%). In 2017, the company increased its growth rate (even before the acquisition of Whole Foods) and appeared to consolidate its ability to dominate online retail.
Both online and offline retailers will increasingly use an omnichannel approach. Traditional retailers started accelerating the pace at which they attempted to blend online and offline in 2017. Walmart led, finally realizing it had to step up its game to compete with Amazon. While its biggest acquisition was Jet.com for over $3 billion, it also acquired Bonobos, Modcloth.com, Moosejaw, Shoebuy.com and Hayneedle.com, creating a portfolio of online brands that could also be sold offline. Target focused on becoming a leader in one-day delivery by acquiring Shipt and Grand Junction, two leaders in home delivery. While I had not predicted anything as large as a Whole Foods acquisition for Amazon, I did forecast that they would increase their footprint of physical locations (see October 2016 Soundbytes). The strategy for online brands to open “Guide” brick and mortar stores ( e.g. Tesla, Warby Parker, Everlane, etc.) continued at a rapid pace.
A giant piloted robot will be demo’d as the next form of entertainment. As expected, Azure portfolio company, Megabots, delivered on this forecast by staging an international fight with a giant robot from Japan. The fight was not live as the robots are still “temperamental” (meaning they occasionally stop working during combat). However, interest in this new form of entertainment was incredible as the video of the fight garnered over 5 million views (which is in the range of an average prime-time TV show). There is still a large amount of work to be done to convert this to an ongoing form of entertainment, but all the ingredients are there.
Virtual and Augmented reality products will escalate. Sales of VR/AR headsets appear to have well exceeded 10 million units for the year with some market gain for higher-end products. The types of applications have expanded from gaming to room design (and viewing), travel, inventory management, education, healthcare, entertainment and more. While the actual growth in unit sales fell short of what many expected, it still was substantial. With Apple’s acquisition of Vrvana (augmented reality headset maker) it seems clear that Apple plans to launch multiple products in the category over the next 2-3 years, and with Facebook’s launch of ArKIT, it’s social AR development platform, there is clearly a lot of focus and growth ahead.
Magic Leap will disappoint in 2017. Magic Leap, after 5 years of development and $1.5 billion of investment, did not launch a product in 2017. But, in late December they announced that their first product will launch in 2018. Once again, the company has made strong claims for what its product will do, and some have said early adopters (at a very hefty price likely to be in the $1,500 range) are said to be like those who bought the first iPod. So, while it disappointed in 2017, it is difficult to tell whether or not this will eventually be a winning company as it’s hard to separate hype from reality.
Cable companies will see a slide in adoption. According to eMarketer, “cord cutting”, i.e. getting rid of cable, reached record proportions in 2017, well exceeding their prior forecast. Just as worrisome to providers, the average time watching TV dropped as well, implying decreased dependence on traditional consumption. Given the increase now evident in cord cutting, UBS (as I did a year ago) is now forecasting substantial acceleration of the decline in subscribers. While the number of subscribers bounced around a bit between 2011 and 2015, when all was said and done, the aggregate drop in that four-year period was less than 0.02%. UBS now forecasts that between the end of 2016 and the end of 2018 the drop will be 7.3%. The more the industry tries to offset the drop by price increases, the more they will accelerate the pace of cord cutting.
Spotify will either postpone its IPO or have a disappointing one. When we made this forecast, Spotify was expected to go public in Q2 2017. Spotify postponed its IPO into 2018 while working on new contracts with the major music labels to try to improve its business model. It was successful in these negotiations in that the labels all agreed to new terms. Since the terms were not announced, we’ll need to see financials for Q1 2018 to better understand the magnitude of improvement. In the first half of the year, Spotify reported that gross margins improved from 16% to 22%, but this merely cut its loss level rather than move the company to profitability. It has stated that it expects to do a non-traditional IPO (a direct listing without using an investment bank) in the first half of 2018. If the valuation approaches its last private round, I would caution investors to stay away, as that valuation, coupled with 22% gross margins (and over 12% of revenue in sales and marketing cost to acquire customers), implies net margin in the mid-single digits at best (assuming they can reduce R&D and G&A as a percent of revenue). This becomes much more challenging in the face of a $1.6 billion lawsuit filed against it for illegally offering songs without compensating the music publisher. Even if they managed to successfully fight the lawsuit and improve margin, Spotify would be valued at close to 100 times “potential earnings” and these earnings may not even materialize.
Amazon’s Echo will gain considerable traction in 2017. Sales of the Echo exploded in 2017 with Amazon announcing that it “sold 10s of millions of Alexa-enabled devices” exceeding our aggressive forecast of 2-3x the 4.4 million units sold in 2016. The Alexa app was also the top app for both Android and iOS phones. It clearly has carved out a niche as a new major platform.
Stay tuned for my top 10 predictions of 2018!
SoundBytes
In our December 20, 2017 post, I discussed just how much Steph Curry improves teammate performance and how effective a shooter he is. I also mentioned that Russell Westbrook leading the league in scoring in the prior season might have been detrimental to his team as his shooting percentage falls well below the league average. Now, in his first game returning to the lineup, Curry had an effective shooting percentage that exceeded 100% while scoring 38 points (this means scoring more than 2 points for every shot taken). It would be interesting to know if Curry is the first player ever to score over 35 points with an effective shooting percentage above 100%! Also, as of now, the Warriors are scoring over 15 points more per game this season with Curry in the lineup than they did for the 11 games he was out (which directly ties to the 7.4% improvement in field goal percentage that his teammates achieve when playing with Curry as discussed in the post).
Search Engine Optimization: A step by step process recommended by experts
Azure just completed its annual ecommerce marketing day. It was attended by 15 of our portfolio companies, two high level executives at major corporations, a very strong SEO consultant and the Azure team. The purpose of the day is to help the CMOs in the Azure portfolio gain a broader perspective on hot marketing topics and share ideas and best practices. This year’s agenda included the following sessions:
Working with QVC/HSN
Brand building
Using TV, radio and/or podcasts for marketing
Techniques to improve email marketing
Measuring and improving email marketing effectiveness
Storytelling to build your brand and drive marketing success
Working with celebrities, brands, popular YouTube personalities, etc.
Optimizing SEO
Product Listing Ads (PLAs) and Search Engine Marketing (SEM)
One pleasant aspect of the day is that it generated quite a few interesting ideas for blog posts! In other words, I learned a lot regarding the topics covered. This post is on an area many of you may believe you know well, Search Engine Optimization (SEO). I thought I knew it well too… before being exposed to a superstar consultant, Allison Lantz, who provided a cutting-edge presentation on the topic. With her permission, this post borrows freely from her content. Of course, I’ve added my own ideas in places and may have introduced some errors in thinking, and a short post can only touch on a few areas and is not a substitute for true expertise.
SEO is Not Free if You Want to Optimize
I have sometimes labeled SEO as a free source of visitors to a site, but Allison correctly points out that if you want to focus on Optimization (the O in SEO) with the search engines, then it isn’t free, but rather an ongoing process (and investment) that should be part of company culture. The good news is that SEO likely will generate high quality traffic that lasts for years and leads to a high ROI against the cost of striving to optimize. All content creators should be trained to write in a manner that optimizes generating traffic by using targeted key words in their content and ensuring these words appear in the places that are optimal for search. To be clear, it’s also best if the content is relevant, well written and user-friendly. If you were planning to create the content anyway, then the cost of doing this is relatively minor. However, if the content is incremental to achieve higher SEO rankings, then the cost will be greater. But I’m getting ahead of myself and need to review the step by step process Allison recommends to move towards optimization.
Keyword Research
The first thing to know when developing an SEO Strategy is what you are targeting to optimize. Anyone doing a search enters a word or phrase they are searching for. Each such word or phrase is called a ‘keyword’. If you want to gain more users through SEO, it’s critical to identify thousands, tens of thousands or even hundreds of thousands of keywords that are relevant to your site. For a fashion site, these could be brands, styles, and designers. For an educational site like Education.com (an Azure portfolio company that is quite strong in SEO and ranks on over 600,000 keywords) keywords might be math, english, multiplication, etc. The broader the keywords, the greater the likelihood of higher volume. But along with that comes more competition for search rankings and a higher cost per keyword. The first step in the process is spending time brainstorming what combinations of words are relevant to your site – in other words if someone searched for that specific combination would your site be very relevant to them? To give you an idea of why the number gets very high, consider again Education.com. Going beyond searching on “math”, one can divide math into arithmetic, algebra, geometry, calculus, etc. Each of these can then be divided further. For example, arithmetic can include multiplication, addition, division, subtraction, exponentiation, fractions and more. Each of these can be subdivided further with multiplication covering multiplication games, multiplication lesson plans, multiplication worksheets, multiplication quizzes and more.
Ranking Keywords
Once keywords are identified the next step is deciding which ones to focus on. The concept leads to ranking keywords based upon the likely number of clicks to your site that could be generated from each one and the expected value of potential users obtained through these clicks. Doing this requires determining for each keyword:
Monthly searches
Competition for the keyword
Conversion potential
Effort (and possible cost) required to achieve a certain ranking
Existing tools report the monthly volume of searches for each keyword (remember to add searches on Bing to those on Google). Estimating the strength of competition requires doing a search using the keyword and learning who the top-ranking sites are currently (given the volume of keywords to analyze, this is very labor intensive). If Amazon is a top site they may be difficult to surpass but if the competition includes relatively minor players, they would be easier to outrank.
The next question to answer for each keyword is: “What is the likelihood of converting someone who is searching on the keyword if they do come to my site”. For example, for Education.com, someone searching on ‘sesame street math games’ might not convert well since they don’t have the license to use Sesame Street characters in their math games. But someone searching on ‘1st grade multiplication worksheets’ would have a high probability of converting since the company is world-class in that area. The other consideration mentioned above is the effort required to achieve a degree of success. If you already have a lot of content relevant to a keyword, then search optimizing that content for the keyword might not be very costly. But, if you currently don’t have any content that is relevant or the keyword is very broad, then a great deal more work might be required.
Example of Keyword Ranking Analysis
Source: Education.com
Comparing Effort Required to Estimated Value of Keywords
Once you have produced the first table, you can make a very educated guess on your possible ranking after about 12 months (the time it may take Google/Bing to recognize your new status for that keyword).
There are known statistics on what the likely click-through rates (share of searches against the keyword) will be if you rank 1st, 2nd, 3rd, etc. Multiplying that by the average search volume for that keyword gives a reasonable estimate of the monthly traffic that this would generate to your site. The next step is to estimate the rate at which you will convert that traffic to members (where they register so you get their email) and/or customers (I’ll assume customers for the rest of this post but the same method would apply to members). Since you already know your existing conversion rate, in general, this could be your estimate. But, if you have been buying clicks on that keyword from Google or Bing, you may already have a better estimate of conversion. Multiplying the number of customers obtained by the LTV (Life Time Value) of a customer yields the $ value generated if the keyword obtains the estimated rank. Subtract from this the current value being obtained from the keyword (based on its current ranking) to see the incremental benefit.
Content Optimization
One important step to improve rankings is to use keywords in titles of articles. While the words to use may seem intuitive, it’s important to test variations to see how each may improve results. Will “free online multiplication games” outperform “free times table games”. The way to test this is by trying each for a different 2-week (or month) time period and see which gives a higher CTR (Click Through Rate). As discussed earlier, it’s also important to optimize the body copy against keywords. Many of our companies create a guide for writing copy that provides rules that result in better CTR.
The Importance of Links
Google views links from other sites to yours as an indication of your level of authority. The more important the site linking to you, the more it impacts Google’s view. Having a larger number of sites linking to you can drive up your Domain Authority (a search engine ranking score) which in turn will benefit rankings across all keywords. However, it’s important to be restrained in acquiring links as those from “Black Hats” (sites Google regards as somewhat bogus) can actually result in getting penalized. While getting another site to link to you will typically require some motivation for them, Allison warns that paying cash for a link is likely to result in obtaining some of them from black hat sites. Instead, motivation can be your featuring an article from the other site, selling goods from a partner, etc.
Other Issues
I won’t review it here but site architecture is also a relevant factor in optimizing SEO benefits. For a product company with tens of thousands of products, it can be extremely important to have the right titles and structure in how you list products. If you have duplicative content on your site, removing it may help your rankings, even if there was a valid reason to have such duplication. Changing the wording of content on a regular basis will help you maintain rankings.
Summary
SEO requires a well-thought-out strategy and consistent, continued execution to produce results. This is not a short-term fix, as an SEO investment will likely only start to show improvements four to six months after implementation with ongoing management. But as many of our portfolio companies can attest, it’s well worth the effort.
SoundBytes
It’s a new basketball season so I can’t resist a few comments. First, as much as I am a fan of the Warriors, it’s pretty foolish to view them as a lock to win as winning is very tenuous. For example, in game 5 of the finals last year, had Durant missed his late game three point shot the Warriors may have been facing the threat of a repeat of the 2016 finals – going back to Cleveland for a potential tying game.
Now that Russell Westbrook has two star players to accompany him we can see if I am correct that he is less valuable than Curry, who has repeatedly shown the ability to elevate all teammates. This is why I believe that, despite his two MVPs, Curry is under-rated!
With Stitchfix filing for an IPO, we are seeing the first of several next generation fashion companies emerging. In the filing, I noted the emphasis they place on SEO as a key component of their success. I believe new fashion startups will continue to exert pressure on traditional players. One Azure company moving towards scale in this domain is Le Tote – keep an eye on them!
Dining and shopping today is very different than in days gone by – the Amazon acquisition of Whole Foods is a result
“I used to drink it,” said Andy Warhol once of Campbell’s soup. “I used to have the same lunch every day, for 20 years, I guess, the same thing over and over again.” In Warhol’s signature medium, silkscreen, the artist reproduced his daily Campbell’s soup can over and over again, changing only the label graphic on each one.
When I was growing up I didn’t have exactly the same thing over and over like Andy Warhol, but virtually every dinner was at home, at our kitchen table (we had no dining room in the 4-room apartment). Eating out was a rare treat and my father would have been abhorred if my mom brought in prepared food. My mom, like most women of that era, didn’t officially work, but did do the bookkeeping for my dad’s plumbing business. She would shop for food almost every day at a local grocery and wheel it home in her shopping cart.
When my wife and I were raising our kids, the kitchen remained the most important room in the house. While we tended to eat out many weekend nights, our Sunday through Thursday dinners were consumed at home, but were sprinkled with occasional meals brought in from the outside like pizza, fried chicken, ribs, and Chinese food. Now, given a high proportion of households where both parents work, eating out, fast foods and prepared foods have become a large proportion of how Americans consume dinner. This trend has reached the point where some say having a traditional kitchen may disappear as people may cease cooking at all.
In this post, I discuss the evolution of our eating habits, and how they will continue to change. Clearly, the changes that have already occurred in shopping for food and eating habits were motivations for Amazon’s acquisition of Whole Foods.
The Range of How We Dine
Dining can be broken into multiple categories and families usually participate in all of them. First, almost 60% of dinners eaten at home are still prepared there. While the percentage has diminished, it is still the largest of the 4 categories for dinners. Second, many meals are now purchased from a third party but still consumed at home. Given the rise of delivery services and greater availability of pre-cooked meals at groceries, the category spans virtually every type of food. Thirdly, many meals are purchased from a fast food chain (about 25% of Americans eat some type of fast food every day1) and about 20% of meals2 are eaten in a car. Finally, a smaller percentage of meals are consumed at a restaurant. (Sources: 1Schlosser, Eric. “Americans Are Obsessed with Fast Food: The Dark Side of the All-American Meal.” CBSNews. Accessed April 14, 2014 / 2Stanford University. “What’s for Dinner?” Multidisciplinary Teaching and Research at Stanford. Accessed April 14, 2014).
The shift to consuming food away from home has been a trend for the last 50 years as families began going from one worker to both spouses working. The proportion of spending on food consumed away from home has consistently increased from 1965-2014 – from 30% to 50%.
Source: Calculated by the Economic Research Service, USDA, from various data sets from the U.S. Census Bureau and the Bureau of Labor Statistics.
With both spouses working, the time available to prepare food was dramatically reduced. Yet, shopping in a supermarket remained largely the same except for more availability of prepared meals. Now, changes that have already begun could make eating dinner at home more convenient than eating out with a cost comparable to a fast food chain.
Why Shopping for Food Will Change Dramatically over the Next 30 Years
Eating at home can be divided between:
Cooking from scratch using ingredients from general shopping
Buying prepared foods from a grocery
Cooking from scratch from recipes supplied with the associated ingredients (meal kits)
Ordering meals that have previously been prepared and only need to be heated up
Ordering meals from a restaurant that are picked up or delivered to your home
Ordering “fast food” type meals like pizza, ribs, chicken, etc. for pickup or delivery.
I am starting with the assumption that many people will still want to cook some proportion of their dinners (I may be romanticizing given how I grew up and how my wife and I raised our family). But, as cooking for yourself becomes an even smaller percentage of dinners, shopping for food in the traditional way will prove inefficient. Why buy a package of saffron or thyme or a bag of onions, only to see very little of it consumed before it is no longer usable? And why start cooking a meal, after shopping at a grocery, only to find you are missing an ingredient of the recipe? Instead, why not shop by the meal instead of shopping for many items that may or may not end up being used.
Shopping by the meal is the essential value proposition offered by Blue Apron, Plated, Hello Fresh, Chef’d and others. Each sends you recipes and all the ingredients to prepare a meal. There is little food waste involved (although packaging is another story). If the meal preparation requires one onion, that is what is included, if it requires a pinch of saffron, then only a pinch is sent. When preparing one of these meals you never find yourself missing an ingredient. It takes a lot of the stress and the food waste out of the meal preparation process. But most such plans, in trying to keep the cost per meal to under $10, have very limited choices each week (all in a similar lower cost price range) and require committing to multiple meals per week. Chef’d, one of the exceptions to this, allows the user to choose individual meals or to purchase a weekly subscription. They also offer over 600 options to choose from while a service like Blue Apron asks the subscriber to select 3 out of 6 choices each week.
Blue Apron meals portioned perfectly for the amount required for the recipes
My second assumption is that the number of meals that are created from scratch in an average household will diminish each year (as it already has for the past 50 years). However, many people will want to have access to “preferred high quality” meals that can be warmed up and eaten, especially in two-worker households. This will be easier and faster (but perhaps less gratifying) than preparing a recipe provided by a food supplier (along with all the ingredients). I am talking about going beyond the pre-cooked items in your average grocery. There are currently sources of such meals arising as delivery services partner with restaurants to provide meals delivered to your doorstep. But this type of service tends to be relatively expensive on a per meal basis.
I expect new services to arise (we’ve already seen a few) that offer meals that are less expensive prepared by “home chefs” or caterers and ordered through a marketplace (this is category 4 in my list). The marketplace will recruit the chefs, supply them with packaging, take orders, deliver to the end customers, and collect the money. Since the food won’t be from a restaurant, with all the associated overhead, prices can be lower. Providing such a service will be a source of income for people who prefer to work at home. Like drivers for Uber and Lyft, there should be a large pool of available suppliers who want to work in this manner. It will be very important for the marketplaces offering such service to curate to ensure that the quality and food safety standards of the product are guaranteed. The availability of good quality, moderately priced prepared meals of one’s choice delivered to the home may begin shifting more consumption back to the home, or at a minimum, slow the shift towards eating dinners away from home.
Where will Amazon be in the Equation?
In the past, I predicted that Amazon would create physical stores, but their recent acquisition of Whole Foods goes far beyond anything I forecast by providing them with an immediate, vast network of physical grocery stores. It does make a lot of sense, as I expect omnichannel marketing to be the future of retail. My reasoning is simple: on the one hand, online commerce will always be some minority of retail (it currently is hovering around 10% of total retail sales); on the other hand, physical retail will continue to lose share of the total market to online for years to come, and we’ll see little difference between e-commerce and physical commerce players. To be competitive, major players will have to be both, and deliver a seamless experience to the consumer.
Acquiring Whole Foods can make Amazon the runaway leader in categories 1 and 2, buying ingredients and/or prepared foods to be delivered to your home. Amazon Fresh already supplies many people with products that are sourced from grocery stores, whether they be general food ingredients or traditional prepared foods supplied by a grocery. They also have numerous meal kits that they offer, and we expect (and are already seeing indications) that Amazon will follow the Whole Foods acquisition by increasing its focus on “meal kits” as it attempts to dominate this rising category (3 in our table).
One could argue that Whole Foods is already a significant player in category 4 (ordering meals that are prepared, and only need to be heated up), believing that category 4 is the same as category 2 (buying prepared meals from a grocery). But it is not. What we envision in the future is the ability to have individuals (who will all be referred to as “Home Chefs” or something like that) create brands and cook foods of every genre, price, etc. Customers will be able to order a set of meals completely to their taste from a local home chef. The logical combatants to control this market will be players like Uber and Lyft, guys like Amazon and Google, existing recipe sites like Blue Apron…and new startups we’ve never heard of.
A key marketing tool for companies is to hold an event like a user’s conference or a topical forum to build relationships with their customers and partners, drive additional revenue and/or generate business development opportunities. Azure held its 11th annual CEO Summit last week, and as we’re getting great feedback on the success of the conference, I thought it might be helpful to dig deeply into what makes a conference effective. I will use the Azure event as the example but try to abstract rules and lessons to be learned, as I have been asked for my advice on this topic by other firms and companies.
Step 1. Have a clear set of objectives
For the Azure CEO Summit, our primary objectives are to help our portfolio companies connect with:
Corporate and Business Development executives from relevant companies
Potential investors (VCs and Family Offices)
Investment banks so the companies are on the radar and can get invited to their conferences
Debt providers for those that can use debt as part of their capital structure
A secondary objective of the conference is to build Azure’s brand thereby increasing our deal flow and helping existing and potential investors in Azure understand some of the value we bring to the table.
When I created a Wall Street tech conference in the late 90’s, the objectives were quite different. They still included brand building, but I also wanted our firm to own trading in tech stocks for that week, have our sell side analysts gain reputation and following, help our bankers expand their influence among public companies, and generate a profit for the firm at the same time. We didn’t charge directly for attending but monetized through attendees increasing use of our trading desk and more companies using our firm for investment banking.
When Fortune began creating conferences, their primary objective was to monetize their brand in a new way. This meant charging a hefty price for attending. If people were being asked to pay, the program had to be very strong, which they market quite effectively.
Conferences that have clear objectives, and focus the activities on those objectives, are the most successful.
Step 2. Determine invitees based on who will help achieve those objectives
For our Summit, most of the invitees are a direct fallout from the objectives listed above. If we want to help our portfolio companies connect with the above-mentioned constituencies, we need to invite both our portfolio CEOs and the right players from corporations, VCs, family offices, investment banks and debt providers. To help our brand, inviting our LPs and potential LPs is important. To insure the Summit is at the quality level needed to attract the right attendees we also target getting great speakers. As suggested by my partners and Andrea Drager, Azure VP (and my collaborator on Soundbytes) we invited several non-Azure Canadian startups. In advance of the summit, we asked Canadian VCs to nominate candidates they thought would be interesting for us and we picked the best 6 to participate in the summit. This led to over 70 interesting companies nominated and added to our deal flow pipeline.
Step 3. Create a program that will attract target attendees to come
This is especially true in the first few years of a conference while you build its reputation. It’s important to realize that your target attendees have many conflicting pulls on their time. You won’t get them to attend just because you want them there! Driving attendance from the right people is a marketing exercise. The first step is understanding what would be attractive to them. In Azure’s case, they might not understand the benefit of meeting our portfolio companies, but they could be very attracted by the right keynotes.
Azure’s 2017 Summit Keynote Speakers: Mark Lavelle, CEO of Magento Commerce & Co-founder of Bill Me Later. Cameron Lester, Managing Director and Co-Head of Global Technology Investment Banking, Jeffries. Nagraj Kashyap, Corporate VP & Global Head, Microsoft Ventures.
Over the years we have had the heads of technology investment banking from Qatalyst, Morgan Stanley, Goldman, JP Morgan and Jeffries as one of our keynote speakers. From the corporate world, we also typically have a CEO, former CEO or chairman of notable companies like Microsoft, Veritas, Citrix, Concur and Audible as a second keynote. Added to these were CEOs of important startups like Stance and Magento and terrific technologists like the head of Microsoft Labs.
Finding the right balance of content, interaction and engagement is challenging, but it should be explicitly tied to meeting the core objectives of the conference.
Step 4. Make sure the program facilitates meeting your objectives
Since Azure’s primary objective is creating connections between our portfolio (and this year, the 6 Canadian companies) with the various other constituencies we invite, we start the day with speed dating one-on-ones of 10 minutes each. Each attendee participating in one-on-ones can be scheduled to meet up to 10 entities between 8:00AM and 9:40. Following that time, we schedule our first keynote.
In addition to participating in the one-on-ones, which start the day, 26 of our portfolio companies had speaking slots at the Summit, intermixed with three compelling keynote speakers. Company slots are scheduled between keynotes to maximize continued participation. This schedule takes us to about 5:00pm. We then invite the participants and additional VCs, lawyers and other important network connections to join us for dinner. The dinner increases everyone’s networking opportunity in a very relaxed environment.
These diverse types of interaction phases throughout the conference (one-on-ones, presentations, discussions, and networking) all facilitate a different type of connection between attendees, focused on maximizing the opportunity for our portfolio companies to build strong connections.
Azure Portfolio Company CEO Presentations: Chairish, Megabots & Atacama
Step 5. Market the program you create to the target attendees
I get invited to about 30 conferences each year plus another 20-30 events. It’s safe to assume that most of the invitees to the Azure conference get a similar (or greater) number of invitations. What this means is that it’s unlikely that people will attend if you send an invitation but then don’t effectively market the event (especially in the first few years). It is important to make sure every key invitee gets a personal call, email, or other message from an executive walking them through the agenda and highlighting the value to them (link to fortune could also go here). For the Azure event, we highlight the great speakers but also the value of meeting selected portfolio companies. Additionally, one of my partners or I connect with every attendee we want to do one-on-ones with portfolio companies to stress why this benefits them and to give them the chance to alter their one-on-one schedule. This year we managed over 320 such meetings.
When I created the first “Quattrone team” conference on Wall Street, we marketed it as an exclusive event to portfolio managers. While the information exchanged was all public, the portfolio managers still felt they would have an investment edge by being at a smaller event (and we knew the first year’s attendance would be relatively small) where all the important tech companies spoke and did one-on-one meetings. For user conferences, it can help to land a great speaker from one of your customers or from the industry. For example, if General Electric, Google, Microsoft or some similar important entity is a customer, getting them to speak will likely increase attendance. It also may help to have an industry guru as a speaker. If you have the budget, adding an entertainer or other star personality can also add to the attraction, as long as the core agenda is relevant to attendees.
Step 6. Decide on the metrics you will use to measure success
It is important to set targets for what you want to accomplish and then to measure whether you’ve achieved those targets. For Azure, the number of entities that attend (besides our portfolio), the number of one-on-one meetings and the number of follow-ups post the conference that emanate from one-on-one are three of the metrics we measure. One week after the conference, I already know that we had over 320 one-on-ones which, so far, has led to about 50 follow ups that we are aware of including three investments in our portfolio. We expect to learn of additional follow up meetings but this has already exceeded our targets.
Step 7. Make sure the value obtained from the conference exceeds its cost
It is easy to spend money but harder to make sure the benefit of that spend exceeds its cost. On one end of the spectrum, some conferences have profits as one of the objectives. But in many cases, the determination of success is not based on profits, but rather on meeting objectives at a reasonable cost. I’ve already discussed Azure’s objectives but most of you are not VCs. For those of you dealing with customers, your objectives can include:
Signing new customers
Reducing churn of existing customers
Developing a better understanding of how to evolve your product
Strong press pickup / PR opportunity
Spending money on a conference should always be compared to other uses of those marketing dollars. To the degree you can be efficient in managing it, the conference can become a solid way to utilize marketing dollars. Some of the things we do for the Azure conference to control cost which may apply to you include:
Partnering with a technology company to host our conference instead of holding it at a hotel. This only works if there is value to your partner. Cost savings is about 60-70%.
Making sure our keynotes are very relevant but are at no cost. You can succeed at this with keynotes from your customers and/or the industry. Cost savings is whatever you might have paid someone.
Having the dinner for 150 people at my house. This has two benefits: it is a much better experience for those attending and the cost is about 70% less than having it at a venue.
Summary
I have focused on using the Azure CEO Summit as the primary example but the rules laid out apply in general. They not only will help you create a successful conference but following them means only holding it if its value to you exceeds its cost.
If you look at that post, you’ll see that my logic appears to have been born out, as my main reason was that Durant was likely to win a championship and this would be very instrumental in helping his reputation/legacy.
Not mentioned in that post was the fact that he would also increase his enjoyment of playing, because playing with Curry, Thompson, Green and the rest of the Warriors is optimizing how the game should be played
Now it’s up to both Durant and Curry to agree to less than cap salaries so the core of the team can be kept intact for many years. If they do, and win multiple championships, they’ll probably increase endorsement revenue. But even without that offset my question is “How much is enough?” I believe one can survive nicely on $30-$32 million a year (Why not both agree to identical deals for 4 years, not two?). Trying for the maximum is an illusion that can be self-defeating. The difference will have zero impact on their lives, but will keep players like Iguodala and Livingston with the Warriors, which could have a very positive impact. I’m hoping they can also keep West, Pachulia and McGee as well.
It would also be nice if Durant and Curry got Thompson and Green to provide a handshake agreement that they would follow the Durant/Curry lead on this and sign for the same amount per year when their contracts came up. Or, if Thompson and Green can extend now, to do the extension at equal pay to what Curry and Durant make in the extension years. By having all four at the same salary at the end of the period, the Warriors would be making a powerful statement of how they feel about each other.
Amazon & Whole Foods…
Amazon’s announced acquisition of Whole Foods is very interesting. In a previous post, we predicted that Amazon would open physical stores. Our reasoning was that over 90% of retail revenue still occurs offline and Amazon would want to attack that. I had expected these to be Guide Stores (not carrying inventory but having samples of products). Clearly this acquisition shows that, at least in food, Amazon wants to go even further. I will discuss this in more detail in a future post.
One example of the anti-consumer practices by airline loyalty programs.
As more and more of our life consists of interacting with technology, it is easier and easier to have our time on an iPhone, computer or game device become all consuming. The good news is that it is so easy for each of us to interact with colleagues, friends and relatives; to shop from anywhere; to access transportation on demand; and to find information on just about anything anytime. The bad news is that anyone can interact with us: marketers can more easily bombard us, scammers can find new and better ways to defraud us, and identity thieves can access our financials and more. When friends email us or post something on Facebook, there is an expectation that we will respond. This leads to one of the less obvious negatives: marketers and friends may not consider whether what they send is relevant to us and can make us inefficient.
In this post, I want to focus on lessons entrepreneurs can learn from products and technologies that many of us use regularly but that have glaring inefficiencies in their design, or those that employ business practices that are anti-consumer. One of the overriding themes is that companies should try to adjust to each consumer’s preferences rather than force customers to do unwanted things. Some of our examples may sound like minor quibbles but customers have such high expectations that even small offenses can result in lost customers.
Lesson 1: Getting email marketing right
Frequency of email
The question: “How often should I be emailing existing and prospective customers?” has an easy answer. It is: “As often as they want you to.” If you email them too frequently the recipients may be turned off. If you send too few, you may be leaving money on the table. Today’s email marketing is still in a rudimentary stage but there are many products that will automatically adjust the frequency of emails based on open rates. Every company should use these. I have several companies that send me too many emails and I have either opted out of receiving them or only open them on rare occasions. In either case the marketer has not optimized their sales opportunity.
Relevance of email
Given the amount of data that companies have on each of us one would think that emails would be highly personalized around a customer’s preferences and product applicability. One thing to realize is that part of product applicability is understanding frequency of purchase of certain products and not sending a marketing email too soon for a product that your customer would be unlikely to be ready to buy. One Azure portfolio company, Filter Easy, offers a service for providing air filters. Filter Easy gives each customer a recommended replacement time from the manufacturer of their air conditioner. They then let the customer decide replacement frequency and the company only attempts to sell units based on this time table. Because of this attention to detail, Filter Easy has one of the lowest customer churn rates of any B to C company. In contrast to this, I receive marketing emails from the company I purchase my running shoes from within a week of buying new ones even though they should know my replacement cycle is about every 6 months unless there is a good sale (where I may buy ahead). I rarely open their emails now, but would open more and be a candidate for other products from them if they sent me fewer emails and thought more about which of their products was most relevant to me given what I buy and my purchase frequency. Even the vaunted Amazon has sent me emails to purchase a new Kindle within a week or so of my buying one, when the replacement cycle of a Kindle is about 3 years.
In an idea world, each customer or potential customer would receive emails uniquely crafted for them. An offer to a customer would be ranked by likely value based on the customer profile and item profile. For example, customers who only buy when items are on sale should be profiled that way and only sent emails when there is a sale. Open Road, another Azure company, has created a daily email of deeply discounted e-books and gets a very high open rate due to the relevance of their emails (but cuts frequency for subscribers whose open rates start declining).
Lesson 2: Learning from Best Practices of Others
I find it surprising when a company launches a new version of a software application without attempting to incorporate best practices of existing products. Remember Lotus 123? They refused to create a Windows version of their spreadsheet for a few years and instead developed one for OS/2 despite seeing Excel’s considerable functionality and ease of use sparking rapid adoption. By the time they created a Windows version, it was too late and they eventually saw their market share erode from a dominant position to a minimal level. In more modern times, Apple helped Blackberry survive well past it’s expected funeral by failing to incorporate many of Blackberry’s strong email features into the iPhone. Even today, after many updates to mail, Apple still is missing such simple features like being able to hit a “B” to go to the bottom of my email stack on the iPhone. Instead, one needs to scroll down through hundreds of emails to get to the bottom if you want to process older emails first. This wastes lots of time. But Microsoft Outlook in some ways is even worse as it has failed to incorporate lookup technology from Blackberry (and now from Apple) that always allows finding an email address from a person’s name. When one has not received a recent email from a person in your contact list, and the person’s email address is not their name, outlook requires an exact email address. When this happens, I wind up looking it the person’s contact information on my phone!
Best practices extends beyond software products to marketing, packaging, upselling and more. For example, every ecommerce company should study Apple packaging to understand how a best in class branding company packages its products. Companies also have learned that in many cases they need to replicate Amazon by providing free shipping.
Lesson 3: The Customer is Usually Right
Make sure customer loyalty programs are positive for customers but affordable for the company
With few exceptions, companies should adopt a philosophy that is very customer-centric. Failing to do so has negative consequences. For example, the airline industry has moved towards giving customers little consideration and this results in many customers no longer having a preferred airline, instead looking for best price and/or most convenient scheduling. Whereas the mileage programs from airlines were once a very attractive way of retaining customers, the value of miles has eroded to such a degree that travelers have lost much of the benefit. This may have been necessary for the airlines as the liability associated with outstanding points reached billions of dollars. But, in addition, airlines began using points as a profit center by selling miles to credit cards at 1.5 cents per mile. Then, to make this a profitable sale, moved average redemption value to what I estimate to be about 1 cent per point. This leads to a concern of mine for consumers. Airlines are selling points at Kiosks and online for 3 cents per point, in effect charging 3 times their cash redemption value.
The lesson here is that if you decide to initiate a loyalty points program, make sure the benefits to the customer increase retention, driving additional revenue. But also make sure that the cost of the program does not exceed the additional revenue. (This may not have been the case for airlines when their mileage points were worth 3-4 cents per mile). It is important to recognize the future cost associated with loyalty points at the time they are given out (based on their exchange value) as this lowers the gross margin of the transaction. We know of a company that failed to understand that the value of points awarded for a transaction so severely reduced the associated gross margin that it was nearly impossible for them to be profitable.
Make sure that customer service is very customer centric
During the Thanksgiving weekend I was buying a gift online and found that Best Buy had what I was looking for on sale. I filled out all the information to purchase the item, but when I went to the last step in the process, my order didn’t seem to be confirmed. I repeated the process and again had the same experience. So, I waited a few days to try again, but by then the sale was no longer valid. My assistant engaged in a chat session with their customer service to try to get them to honor the sale price, and this was refused (we think she was dealing with a bot but we’re not positive). After multiple chats, she was told that I could try going to one of their physical stores to see if they had it on sale (extremely unlikely). Instead I went to Amazon and bought a similar product at full price and decided to never buy from Best Buy’s online store again. I know from experience that Amazon would not behave that way and Azure tries to make sure none of our portfolio companies would either. Turning down what would still have been a profitable transaction and in the process losing a customer is not a formula for success! While there may be some lost revenue in satisfying a reasonable customer request the long term consequence of failing to do so usually will far outweigh this cost.
Combining a Top Marketing Specialist’s Framework with Our Thoughts
We just spent several hours speaking with Marc Schwartz, an Integrated Marketing Specialist. Marc has been in marketing for 25 years in various high level positions with companies like Kraft/Gevalia, Publishers Clearing House, Starwood Hotels, Wyndham, Pfizer and Sanofi. His experience spans both online and offline. In this post we combine his concept of a marketing framework with our thoughts on specific topics within that framework.
Creating a Marketing Framework
Marc points out that it is important for every company to have a marketing framework that has three common threads throughout:
Consistently build your brand throughout every step in the process.
Measure everything – “If you can’t measure it, don’t do it!”
Be customer centric – always think about how the customer will feel about anything you choose to do
Marketing can be broken down into 4 important steps and companies will likely need different people with different skill sets to address each step:
Acquisition
Retention
Upsell /Cross sell
Winning Back Customers
1. Customer Acquisition – The 40/40/20 Rule
Marc’s experience has shown that in acquiring new customers 40% of success has to do with targeting the right people, 40% with the nature of the offer and 20% with creative. Worth noting while creative and messaging is critical, in direct marketing the right offer delivered to the right audience is the most important factor. Targeting is not about mass marketing but rather about knowing your potential customers and finding the most efficient way to reach them.
Targeting
One important thing I have found is that it may make sense to spend more money per potential customer (referred to as Customer Acquisition Cost or CAC) if you reach individuals who will be greater spenders on your product (this is referred to as Life Time Revenue or LTR). For example Facebook charges more to find closer matches to your target demographic but spending more initially has led several Azure portfolio companies to acquire a stronger customer set which in turn increases LTR and and makes the higher spending worthwhile. The key is to compare the CAC of each particular acquisition channel to the value of the customer (Lifetime profits on the customer or LTV). When LTV is higher than the CAC that means the customer is profitable. But we discourage our companies from going after marginally profitable customers so I would encourage you to think in terms of LTV being at least twice the CAC (I won’t invest in a startup unless I believe the ratio can exceed 3X). Each acquisition channel can become less effective when going beyond a certain scale but that scale will differ dramatically with the products being offered. The determination of where to cap spend should be decided by gradually increasing your commitment on a successful channel until you find that the incremental spend is not yielding good incremental results. It is important to avoid being a one trick pony so using multiple channels helps scale customer acquisition without hitting diminishing returns for a much longer period. Any channel that tests well should be utilized with the total spend being apportioned based on effectiveness (the ratio of LTV/CAC) of each channel.
The Offer
Each campaign should lead with an offer that is a strong value proposition for the target customer. The offer must have a very clear call to action. Saying “try my product” would not usually be viewed as a compelling offer. At Gevalia Coffee, the company offered a free coffee maker if you began subscribing. At Publisher’s Clearing House the company entered you in a contest where you could win $1,000,000. More recently, Warren Buffet offered $1 billion to anyone who picked every game right in the NCAA tournament (his risk of paying out is low as the odds of there being a correct answer among 100 million unique entries is less than one in 10 billion!). Marc points out that his experience indicates there is a direct correlation between the value of what you give away and retention. The more compelling the offer, the lower the retention as more “cherry pickers” sign up so starting with a free month of a physical product can potentially backfire. In fact, these days, there are bloggers who tell their following, “Go to this site for a free month of some product”. It would be surprising if your company recovered it’s CAC on this set of potential customers as followers of such bloggers will rarely become paying customers.
Therefore it’s important to find the balance between your brand equity and the value of the premium used. While a lower valued premium will probably lead to fewer customers being acquired, it is likely to also lead to higher LTV for those customers and stronger brand equity. The key with this, as with everything in this blog post, is a continuous A/B testing philosophy to see what works best.
One note of caution: From early November through late December, the cost of virtually every form of marketing goes up due to increased purchasing that takes place for Christmas gifts. If your product won’t benefit from this, your annual plan should have the lowest spend (if any) during this period.
Creative
Marc ranks creative at 20% of the formula for winning customers. This is half the importance of proper targeting and the nature of the offer because great creative can’t overcome a poor offer or going after the wrong customers. However, the creative is where you get to explain who you are (your brand statement), why the offer has value to the target customer and your call to action. If the call to action is not clear enough than you won’t get the desired action. The creative needs to be A/B/C tested for best language, fonts, colors, graphics, etc. Every element of the creative has an impact on how well the offer performs. You also need to decide if different offers and/or creative should be used for different subsets of the target customers. One of the best examples of this that I have seen was a campaign that targeted graduates of various schools and led with something like: “Your Harvard degree is worth even more if you …” The conversion rate of this highly targeted campaign was more than double the norm for this company.
2. Optimizing Customer Retention
On Boarding
I’m sure you have heard the expression: “You only get one chance to make a good first impression.” Your best opportunity comes after the customer has placed their order (although the acquisition process was the first step). For this section I’m going to assume you are sending the customer physical goods. Marc calls this first experience “The Brand Moment”. If you think of how Apple packages its products, they have clearly enhanced their brand through the packaging with every element of the package as perfect as they can make it. Opening their box certainly enhances the Apple brand. So you need to balance the expense of better quality packaging against the degree to which it enhances your brand equity. The box itself should be branded and can contain a message that you want to relate to the customer. The nature of collateral material, how many items, what messaging on the materials and the order they are placed in the box needs to be researched. Have you included easy to find information on how to resolve a problem? Should there be a customer support phone number to call if something is amiss? Is your brand position re-emphasized in the materials? A good impression can lead to higher LTV, recommendations for other customers and more.
Communications
Marc believes the first step in communications should be to welcome the new customer. This would usually be through an email (or snail mail). Marc finds an actual phone call is highly effective but costly. Obviously your business model will determine the appropriate action to welcome the new customer. The welcome email (or call) is an opportunity to re-emphasize your brand and its value to the customer. It’s important to communicate regularly with every customer. He actually found that placing a phone call can often improve customer retention even more than giving something for free. To the degree that it makes sense, customers should be segmented and each segment should get their own drip campaign of emails. Don’t over communicate! This can be even more negative than under communicating and can cause churn. Of course if you can offer real value to the customer in greater frequency than do so – for example, customers that sign up to a “daily deal” product probably expect daily emails. There are some email platforms that automatically adjust frequency based on open rates (very low open rates are a good indicator of over communication with that customer).
Retention Offers
Various types of premiums can be used for retention. Much like those used in acquisition there should be careful testing of cost vs expanded LTV. For any offer, tests should be constructed that track how paired groups perform who haven’t received the offer vs those that have. If the LTV of the group receiving the offer doesn’t exceed the LTV of the paired group by more than the cost of the offer than the offer should not be rolled out. Marc found in the past (in a subscription model) that if an offer is too valuable the company may see a large churn of customers in the month subsequent to the offer being received.
3. Cross Sell/Upsell
There are multiple ways to think about increasing a customer’s LTR:
Keep them as customers longer
Get them to buy more frequently
Get their average invoice value to be higher, i.e. cross sell/upsell
The strategies I spoke about for retention actually focus on the first two of these. The third is an extremely valuable part of a marketing arsenal and I am surprised on how underutilized this tactic is among many companies. To begin, you need to have things in your product set to upsell or cross sell. The items should be relevant to your brand and to your customers. If you are already shipping a box to your customer as their base order, adding another item or shifting to a more expensive version of the base item typically makes the order not only higher in revenue but also can increase the Gross Margin on the order as shipping and fulfillment are unlikely to increase much, if at all (and these days shipping is usually absorbed by the seller). Every company needs to think about brand positive ways to make such offers.
When I was the primary analyst on Dell it was the early days of selling online. Dell quickly created a script that included several upsells like “add another x bytes of storage at 75% of the normal price” (and huge GM to Dell), “financing available for your computer”, etc. Several phone manufacturers started to offer the ability to insure your screen against breakage (usually from a drop). What is interesting there is insurance sometimes covers things the company would have done anyway but is now being paid extra.
For clothing companies, saying “this blouse would go very well with the skirt you’re buying” or “for the suit you bought which of these three ties would you like to buy”, can substantially increase cart size and increase margin. One company I’ve dealt with has an increasing discount on the entire order based on the total dollars you spend (net of the discount). Since it sells T-shirts, socks, underwear, etc., it’s easy to add to your order to get to the next discount level and given my personality I always wind up buying enough to qualify for the maximum 20% off.
4. Winning Back Customers
Cancel/Save Tactics
Customer service is usually the first line of defense for preventing customer cancellations. The key to saving a customer is to listen to his or her issue that is causing the cancellation and to be able to adjust your relationship in order to solve that issue. Most companies match each cancellation reason with a particular offer. A simple example is if a customer thinks the product/service is too expensive, a company may offer a discount.
Creating rebuttals and scripts
Your company should create a list of reasons why a customer might cancel. If a new reason why a customer cancels arises, add it to the list. For each reason they might cancel, you must prepare a rebuttal that addresses that issue. If she is receiving too many offers you can agree to cut the frequency to what she prefers, if she is unhappy with something you sent her you can agree to take it back or give a coupon towards the next purchase, etc. Marc says the key is creating scripts and emails that address every reason for cancellation with a counter that you believe will make the customer happy (without too much cost burden on you). Once you have this in place, anyone who will be dealing with the unhappy customer needs to be trained on how to use the script and what escalation (to a supervisor) procedure should be used.
Winning back Customers
The least expensive customer to acquire is a previous customer. You know quite a bit about them: what they prefer, how profitable they were and more. Given what you know, churned customers can be segregated into groups as you are probably willing to spend more to win back the high value group than a lower value one. For each group you need to go through the process of original acquisition, but with a lot more specific knowledge. So an offer needs to be determined for each group and creative needs to be created. The methodology should parallel that of customer acquisition with the difference being a defined target.
5. Summary
The steps of the framework have been outlined in detail. But there are a few more points to be made.
SEO should be utilized by all companies as it’s the lowest cost of access to target customers.
Work with a very strong agency partner who understands the fundamentals of marketing.
Have a solid set of vendors for things like email, campaign management, etc.
Data is crucial. Make sure you track as much as you can regarding every potential and actual customer.
If you can’t measure it don’t do it!
SoundBytes
There has been much chatter this season about Curry becoming the 8th player with 50/40/90 stats – 50% field goal shooting, 40% 3-point shooting and 90% from the foul line. My partner Paul Ferris noted that if we raise this to 50/45/90 Curry is only the third. And the surprise is that the other two are Steve Nash (not a surprise) and Steve Kerr! Data for this observation was gleaned from BasketballReference.com.
In this post I want to compare the buying experiences I’ve had recently when purchasing from an older generation company vs a newer one. I think it highlights the fact that ecommerce based models can create a much better buying experience than traditional brick and mortar sellers when coupled with a multi-channel approach. The two companies I want to highlight are Tesla (where my wife recently purchased a car) and Warby Parker (where I recently bought a pair of glasses). I’ll compare them to Mercedes and LensCrafters but you should understand it almost doesn’t matter which older gen companies I compared them to, so just consider the ones I’ve chosen (due to recent personal experience) as representative of their industries.
Controlling the buying experience
Warby Parker began opening retail “Guideshops” a few years ago. I recently went into one and was very pleased with the experience. They displayed all the frames they have and there were only two price categories which included the prescription lenses and the frames, $95 and $145. I selected a frame, went over to the desk and received assistance in completing the transaction. The person assisting me took one measurement of my eyes and then suggested I get slightly better lenses for a charge of $30 which I think was only necessary due to my particular prescription. There were no other charges, no salesperson, no other upsells, no waiting while the glasses are being made. Once I paid by credit card, the glasses were put in their cue to be made at their factory and shipped to my home within 10 days (with no shipping charge) and my receipt was sent by email rather than printed. From the time I entered the store until I left was about 10 minutes.
Compare this experience to buying a pair of glasses at LensCrafters. At LensCrafters the price range of frames is all over the map without any apparent reason except many carry a designer brand logo (but are unlikely to have been designed by that designer). To me the Warby Parker frames are as good or better looking as far more expensive ones at LensCrafters. Even if you select a frame at LensCrafters that costs $95-$300 or more, the lenses are not included. A salesperson then sits with you and begins the upselling process. Without going into all the details, suffice it to say that it is very difficult to discern what is really needed and therefore it is hard to walk out of the store without spending $100-$300 more than the cost of the frame. Further, since the glasses are made at the store you come back in a few hours to pick them up (of course this is a positive if you want them right away; I usually don’t care). I have typically spent well over an hour in the buying process plus going for a coffee for the 2 hours or so it took for them to make the lenses.
Tesla has been very adamant about owning and controlling their physical retail outlets rather than having their cars sold by independent dealerships. This gives them multiple advantages as they completely control the buying experience, eliminate competition between dealers, reduce distribution cost and can decide what the purpose of each location is and how it should look. They have also eliminated having cars to sell on the lot but instead use an ecommerce model where you order a car exactly the way you want it and it gets produced for you and brought to the Tesla physical location you want for pickup. Essentially, they have designed two types of physical stores: one that has a few demo models to enable test drives and one that also has a customer service department. This means that the latter is a much smaller size than a traditional car dealership (as it doesn’t need space for new car inventory on the lot) and the former is much smaller than that. The showroom approach occupies such a small footprint that Tesla has been able to locate showrooms in high foot traffic (high cost per foot) locations like malls. In their sites at the Stanford Mall and on Santana Row (two of the most expensive per square foot), Tesla kept the cars for test drives in the parking lots (at a fraction of the cost of store footage). When my wife decided to buy her second Tesla (trading in the older one) we spent about an hour at the dealer as there was no negotiation on price, the car could be configured to her exact specification on a screen at the dealership (or at home) and would be manufactured for her. There were no upsell attempts, no competing dealers to visit, and really no salesperson but rather a facilitator (much like at Warby Parker) that answered questions.
I bought my new car from Mercedes and had a much less pleasant buying experience. It starts with the fact that the price on the car isn’t the real price. This means that one needs to try to go to multiple dealers as well as online to get a better handle on what the real price is as the dealers are difficult to trust. Each dealer now has its own online person (or team) but this is actually still buying from a dealer. There is also a strong encouragement to buy a car in inventory (on the lot) and the idea of configuring the way one wants and ordering it is discouraged. The cars on the lot are frequently configured with costly (highly profitable) options that are unnecessary so that even with a discount from list one typically spends more than ordering it with only options you want and paying closer to list. After multiple days (and many, many hours) spent online and visiting dealerships I decided to replicate the Tesla concept and order a 2016 model to be built exactly how I wanted. Because I spent many hours shopping around, I still was able to get a price that was an extra $4,000 off list from what I had been offered if I bought a 2015 off the lot. The car was the color I wanted, only had the options I wanted and would have a higher resale value because of being a 2016. Since the list price had not increased and there were no unneeded options on the car I actually saved about $10,000 vs taking one off the lot with the lower discount even though all additional options I wanted were bundled with it.
Receiving the product
In the Warby Parker example, the glasses were shipped to my home in a very well designed box that enhanced their brand. The box contained an upscale case and a card that said: “For every pair of glasses sold, a pair is distributed to someone in need.” Buying at LensCrafters meant returning to the store for the glasses. The case included was a very cheap looking one (creating an upsell if one wanted a nicer case) and there was no packaging other than the case. However, I did get the glasses the same day and someone sat with me to make sure they fit well on my ears (fit was not an issue for me for the Warby Parker glasses but could be for some people).
On the automobile side, the car pickup at Tesla was a much better experience than the one at Mercedes. At Tesla, my wife and I spent a little over an hour at the pickup. We spent about 20 minutes on paperwork and 45 minutes getting a walk through on how various options on the car work. There were no attempts to upsell us on anything. At Mercedes the car pickup experience took nearly 4 hours and was very painful as over 3 hours of it was spent on paperwork and attempts at a variety of upsells. To be fair, we had decided to lease this car and that time occupied a portion of the paperwork. But the attempted upsells were extreme. The most ludicrous was trying to get us to buy an extended warranty when the included warranty exceeded the length of the lease. I could understand that it might be of value to some but, in our case, we told the lease person that we were only doing the lease so we wouldn’t own the car at the end of it. There were also upsells on various online services, and a number of other items. The time this took meant we did not have enough time left to go over all the features of the car. This process was clearly the way each person had been trained and was not a function of the particular people we dealt with. The actual salesperson who sold me the car was extremely nice but was working within a system that is not geared towards the customer experience as dealers can’t count on buyers returning even if they buy the same brand again.
Summary
There is a significant advantage being created by new models of doing business which control the complete distribution chain. Their physical locations have a much smaller footprint than traditional competitors which allow them to put their shops in high traffic locations without incurring commensurate cost. They consolidate inventory into a centralized location which reduces inventory cost, storage and obsolescence. They completely control the buying experience and understand that customer satisfaction leads to higher life time value of a customer.
SoundBytes
In my SoundByte post dated April 9, I discussed several of the metrics that caused me to conclude that Stephen Curry should be the 2014-15 season MVP. He subsequently received the award but it still appeared that many did not fully understand his value. I thought it was well captured in the post by looking at EFG, or effective shooting percentage (where a three point shot made counts as 1.5 two point shots made since its worth 50% more points), plus/minus and several other statistics not widely publicized. This year, Curry has become even better and I realized one other statistic might help highlight his value in an even better way, points created above the norm (PAN).
I define PAN as the extra points created versus an average NBA player through more effective shooting. It is calculated using this formula:
PAN= 2 x (the players average number of shots per game) x (players EFG- league norm EFG)
The league’s effective shooting percentage as of December 6 is 49.0%. Since Curry’s effective shooting percentage is 66.1% as of today date, the difference is 17.1%. Curry has been averaging 20.2 shots per game this year so his PAN = 2 x 20.2 x 17.1%= 6.9. This means Curry’s shooting alone (excluding foul shots) adds about 7 points per game to his team versus an average shooter. But, because Curry is unselfish and is often double teamed, he also contributes heavily to helping the team as a whole be more effective shooters. This leads to a team PAN of 14.0. Which means the Warriors score an extra 14 points a game due to more effective shooting.
Interestingly, when you compare this statistic to other league leaders and NBA stars, Curry’s contribution becomes even more remarkable. While Curry add about 7 points per game to his team versus an average shooter, James Harden, Dwayne Wade and Kobe Bryant are all contributing less than the average player. Given Curry’s wildly superior efficiency he is contributing almost twice as much as Kevin Durant.
With Curry’s far superior individual and team contribution to shooting efficiency, it is not surprising that the Warriors are outscoring their opponents by such record breaking margins.
To further emphasize how much Curry’s PAN impacts his team we compared him to Kobe Bryant. The difference in their PANs is 11.8 points per game. How much would it change the Lakers record if they had these extra 11.8 points per game and all else was equal? It would move the Lakers from the second worst point differential (only Philadelphia trails them) to 10th in the league and 4th among Western conference teams. Since point differential correlates closely to team record, that might mean the Lakers would be competing for home court in the playoffs instead of the worst record in the league!
I admit it, I’m a weird guy. How many others have a PhD in financial modeling combined with an MBA in finance and accounting? I’ve never put any of this on my business card (not even my CPA) because degrees are not necessarily the indicators of who will succeed in business. After all, the one thing Bill Gates, Mark Zuckerberg, Michael Dell, Ted Waitt and Larry Ellison have in common, besides 4 of the 5 being billionaires before turning 30, was they never graduated from college. Don’t get me wrong: I’m notadvocating dropping out of school. In fact, in this post, I will leverage my finance and modeling background to discuss further how to better predict the future success of companies. When we evaluate companies, we like to see that: