Defining Key Elements of the New Model for Retail

In our October, 2015 Soundbytes (https://soundbytes2.com/2015/10/)  I predicted that Omnichannel selling would become prevalent over the ensuing years with brick and mortar retailers being forced to offer an online solution, ecommerce companies needing to access buyers at physical locations and online brands (referred to as DTC or direct to consumer) being carried by 3rd party physical stores. Since that post, these trends have accelerated (including Amazon’s announcement last week that it is opening another “4-star store” in the bay area). Having had more time to observe this progression, I have developed several theories regarding this evolving new world that I would like to share in this post.  

Issues for Brick and Mortar Stores when they Create an Online Presence

Physical retailers are not set up to handle volumes of online sales. Their distribution centers are geared towards sending larger volumes of products to their stores rather than having the technology and know-how to deal directly with consumers (a situation which motivated Walmart to buy Jet for $3.3 billion). In general, a retailer starting to sell online will need to create one or more new distribution centers that are geared towards satisfying direct to consumer online demand.  

Another rude awakening for brick and mortar retailers when they go online is a dramatic increase in returns. On average, returns are about 9% of purchases from a retail store and 30% when purchased online. The discrepancy is even greater for clothing (especially shoes) as fit becomes a major issue. Given that consumers expect free shipping, and most want free return shipping, this becomes a cost that can eviscerate margins. The volume of returns also creates the problem of handling reverse logistics, that is tracking the return, crediting the customer, putting it back into the inventory system as available and restocking it into the appropriate bin location. Then there is the question as to whether the item can still be resold. For clothing this may require adding the cost of cleaning and pressing operations to keep the item fresh and having the systems to track movement of the inventory through this process.

Lastly, the question becomes whether a brick and mortar retailers’ online sales will (at least partly) cannibalize their in-store sales. If so, this, coupled with the growth of online buying, can make existing store footprints too large, reducing store profits.

If Brick and Mortar Retailers Struggle with an Omnichannel Approach, why do DTC Brands Want to Create an Offline Presence?

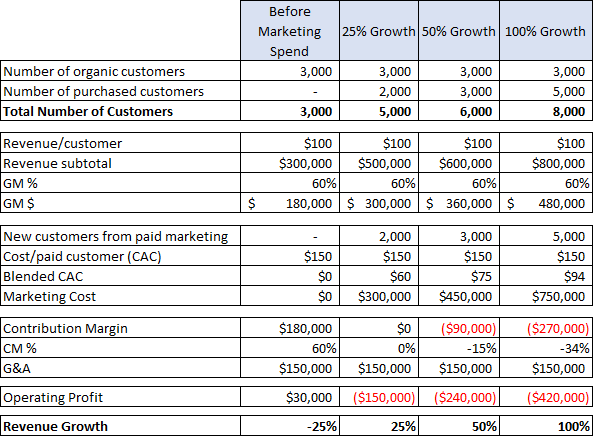
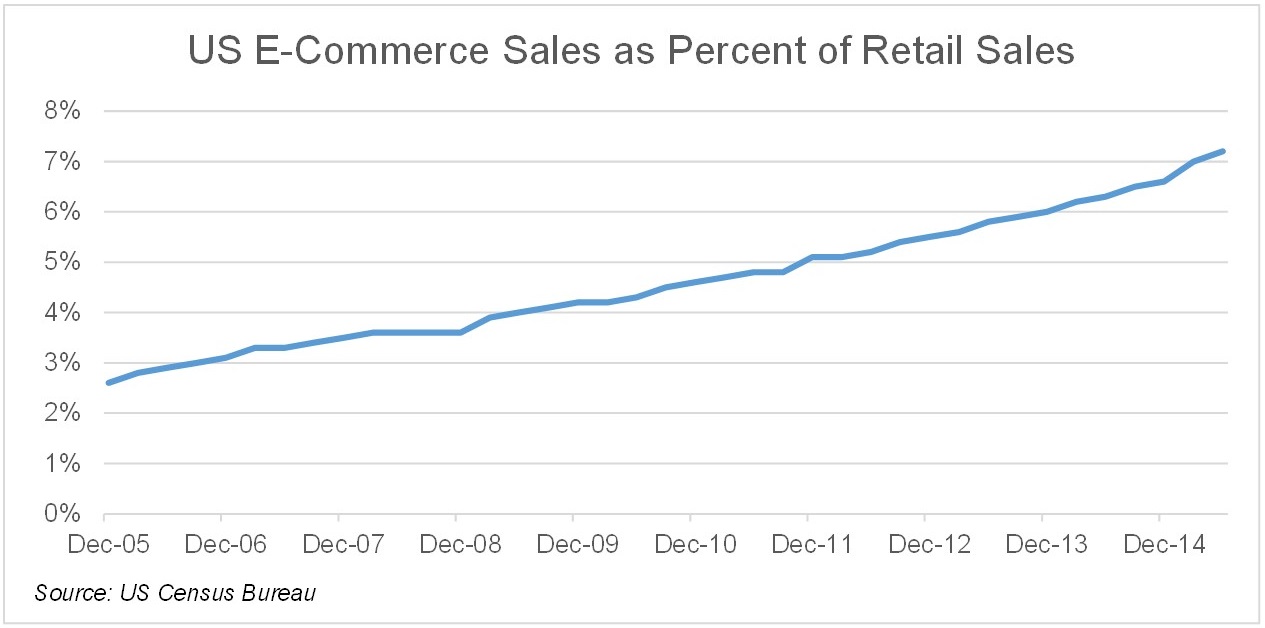
The answer is a pretty simple one: market access and customer acquisition.  Despite a steady gain of share for online sales, brick and mortar still accounts for over 70% of consumer purchases. Not too long ago, Facebook was a pretty efficient channel to acquire customers. For the past 5 years, Azure portfolio companies have experienced a steep rise in CAC (customer acquisition cost) when using Facebook as the acquisition vehicle. There are many theories as to why, but it seems obvious to me that it is simply the law of supply versus demand. Facebook usage growth has slowed but the demand for ad inventory has increased dramatically, driving up prices. For large brands that use advertising for brand building rather than customer acquisition this does not appear to be a problem, especially when comparing its value to ads on television. For brands that use it for customer acquisition, doubling CAC changes the ratio of LTV (lifetime value or lifetime profits on a customer) to CAC making this method of customer acquisition far less effective.

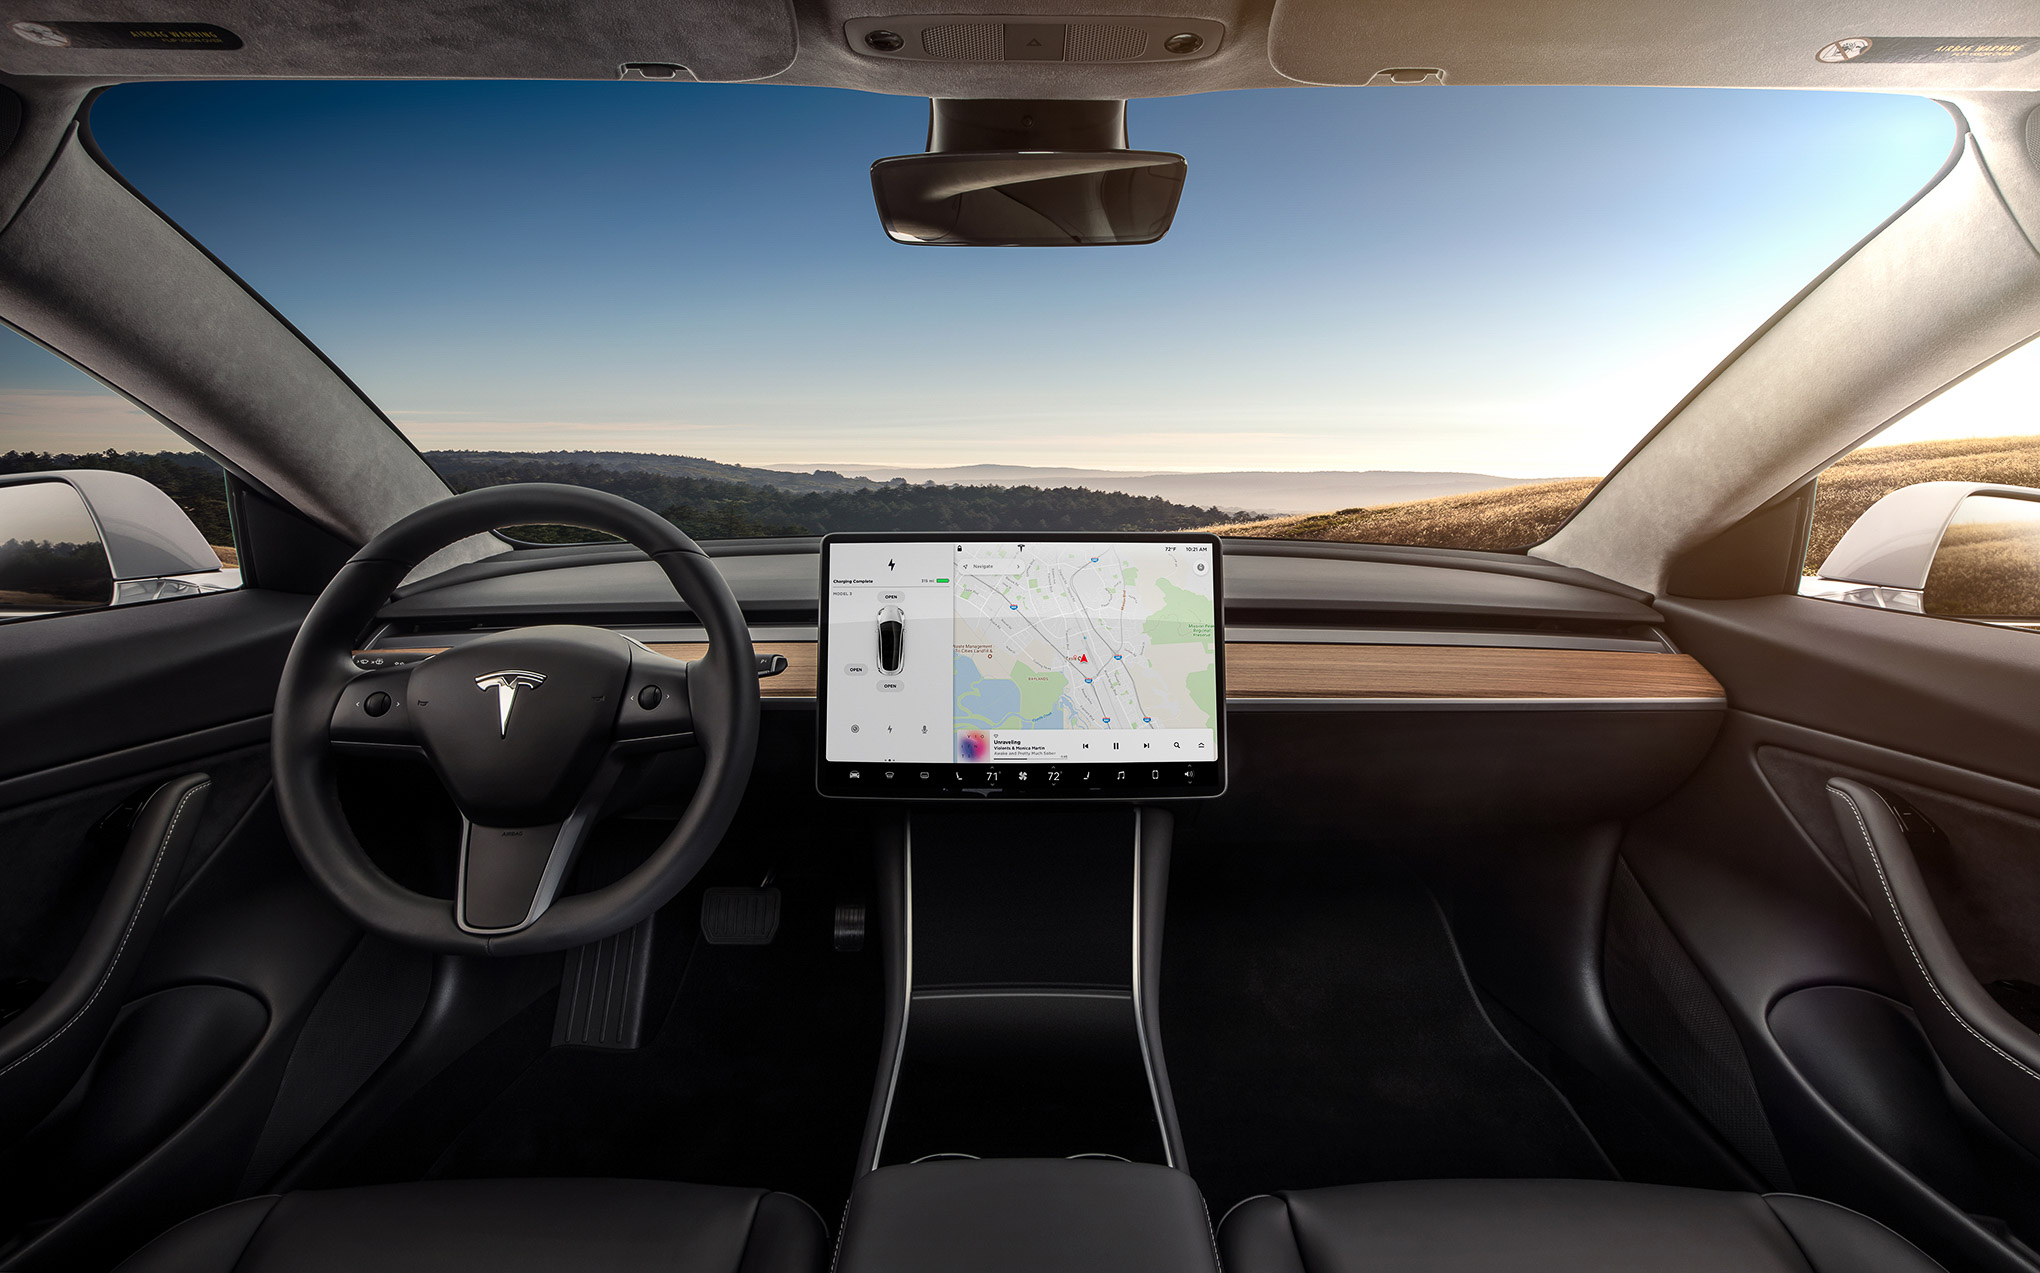
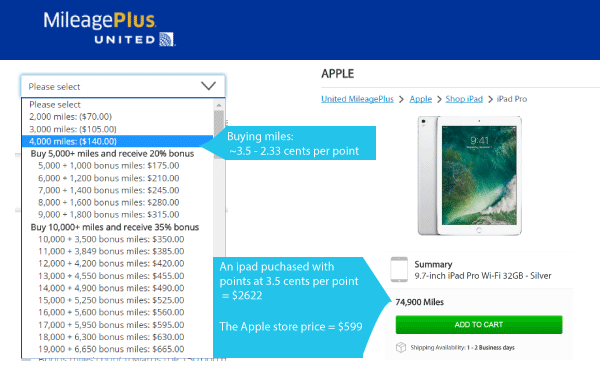
The combination of these factors has led larger (and smaller) online brands to open brick and mortar outlets. Players like Warby Parker, Casper, Bonobos and even Tesla have done it by creating stores that are a different experience than traditional retail. Warby Parker, Bonobos and Tesla do not stock inventory but rather use the presence to attract customers and enable them to try on/test drive their products. I have bought products, essentially online, while at Warby Parker and Tesla physical locations.

I then had to wait between 2 to 6 weeks for the product to be manufactured and delivered (see the soundbite on Tesla below). What this means in each of their cases is that they kept their business models as ones of “manufacture to demand” rather than build to inventory.  It seems clear that for all four of the companies cited above there is a belief that these physical outlets are a cost effective way of attracting customers with a CAC that is competitive to online ads. They also effectively use online follow-up once you have visited their brick and mortar outlet, thus creating a blend of the two methods. Once the customer is acquired, repeat purchases may occur directly online or in a combination of online and offline.

The Future Blend of Online/Offline

While we have seen a steady progression of companies experimenting with Omnichannel whether they started as offline or online players, we have yet to see an optimal solution. Rather, various players have demonstrated parts of that optimization. So, I’d like to outline a few thoughts regarding what steps might lead to more optimization:

  1. To the degree possible, online purchases by consumers should have an in-store pickup and review option at some savings versus shipping to the home. For clothing, there should also be an opportunity to try the online purchased items on before leaving the store. In that way consumers have the ability to buy online, coupled with the convenience of trying products on in a store. This would expose the customer to a broader set of inventory (online) than even a large footprint store might be able to carry. It would improve fit, lower cost to the brand (by lowering returns and reducing shipping cost) while allowing the brand to begin acquiring better information on fit – insuring an improvement for the next online purchase. A secondary benefit would be the increase in store traffic that was created.
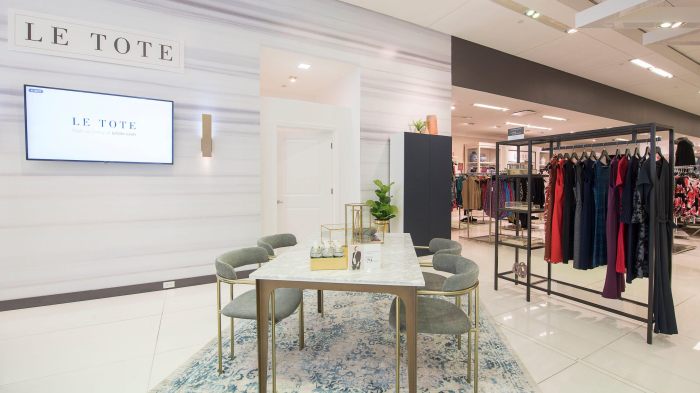
  2. Many retailers will add Rental to the mix of options offered to customers to improve profits. Azure portfolio company, Le Tote, is a subscription rental company for everyday women’s clothes. As women give feedback on a large variety of aspects of fit and preferences it can improve the fit dramatically with each successive box. Retailers need to have systems that replicates this knowledge of their customers. The problem for pure brick and mortar retailers is that they have not had a relationship that enables them to get the feedback…and they don’t have software systems to build this knowledge even if they were to get it. Le Tote has also built up strong knowledge of women’s preferences as to style and has created successful house brands that leverage that knowledge based on massive feedback from subscribers. You may have seen the announcement that Le Tote has just acquired Lord & Taylor, the oldest department store in the country. It plans to use the millions of existing Lord & Taylor customers as a source of potential subscribers to its service. It also has a rental vehicle that can be used to improve monetization of items that don’t sell through at the stores.
  3. Successful online brands will be carried by offline retailers. This has already started to occur but will accelerate over time as DTC brands like Le Tote (and perhaps Stitchfix) use their tens of millions of specific customer feedback data points to produce products that meet the needs expressed in the feedback. If they have correctly mined the data, these brands should be quite successful in offline stores, whether it be their own or a third party retailers’ outlet. The benefit to the retailor in carrying online brands is two-fold: first the online brands that have effectively analyzed their data create products they know can sell in each geography; and second carrying online brands will improve the image of the retailor in the eyes of shoppers who view DTC companies as more forward thinking.
  4. Department store footprints will need to shrink or be shared with online players. The issue discussed earlier of overall ecommerce coupled with brick and mortar stores cannibalizing store demand when they start selling online can be dramatically mitigated by having smaller stores. In that way retailers can maintain their brand presence, continue to get foot traffic, and improve store efficiency.  Any larger footprint store may need to take part of its space and either sublet it (as Macys is doing in some locations) or attract online brands that are willing to pay for a presence in those stores in the form of a percentage of revenue generated or rent. The offer to DTC brands may be to have a pop-up for a set period, or to agree to a longer-term relationship. By working with DTC brands in this way retailers can improve gross margin per square foot (a critical KPI for brick and mortar players) for poorly utilized portions of their store footprints. The secondary benefit to the retailer would be that the online brands will generate additional traffic to the stores. There are already a few startups that are creating a store within a store concept that carries DTC brands. They hope to be the middleman between DTC brands and large retailers/shopping malls making it easier for the DTC brands to penetrate more locations, and easier for the retailer to deal with one new player that will install multiple DTC brands in their locations.
  5. There will be more combinations of online and offline companies merging. By doing that the expertise needed for each area of the business can be optimized. The online companies presumably have better software, logistics and more efficient methods of acquiring online customers. The brick and mortar retailers have greater knowledge of running a physical store, an existing footprint to carry the online brands, locations that allow for delivery to their stores, and a customer base to market to online (reducing the CAC and increasing LTV).
  6. For Omnichannel companies, revenue attribution is complex but becomes essential to managing where dollars are spent. Revenue attribution is the tracking, connecting, and crediting marketing efforts to their downstream revenue creation. For example, if a potential customer responds to a Facebook ad by going online to look at items, then visits a store to check them out live, but eventually buys one or more of the items in response to a google ad, the question becomes: which channel should get credit for acquiring the customer? This is important as the answer may impact company strategy and help determine where marketing dollars get spent. Several Azure portfolio companies are now using 3rd party software from companies like Hive to appropriately give attribution to each channel that helped contribute to the eventual sale. This process is important as it helps determine future spending. We expect better run Omnichannel companies to evolve their analysis of marketing to include attribution models.  

Conclusion: The future winners in retail will be those that successfully migrate to the most optimal omnichannel models

What I have described in this post is inevitable. Some large proportion of customers will always want to do some or all of their shopping at a brick & mortar store. By blending the positive attributes of physical retail with the accessibility to the larger number of options that can exist online, companies can move to more optimal models that address all potential customers. But unless this is done in an intelligent way booby traps like inefficient floor space, excessive returns, high shipping costs and more will rear their ugly heads. This post describes steps for retailers/brands to take that are a starting point for optimizing an omnichannel approach.  

Soundbytes

  • When I had just left Wall Street, I received calls from the press and a very large investor in Hewlett Packard regarding my opinion of the proposed acquisition of Compaq Computer. I said: “HP is in 6 business areas with Imaging being their best and PCs their worst. Doubling up on the worst of the 6 does not make sense to me.” When asked what they should do instead, I replied: “Double up on the best business: acquire Xerox.” My how the tide has turned as Xerox was in trouble then and could have been bought at a very low price. Now it appears Xerox may acquire HP. To be clear, Xerox is still a much smaller market cap company…but I’m enjoying seeing how this process will work out.

  • In the last Soundbytes, I mentioned that I had purchased a Tesla Model 3. What is interesting is that 6 weeks later I am being told that it may take as long as 3-4 more weeks before I receive the car.  This means delivery times have extended to at least 9 weeks. I can’t say how reliable this is but the salesperson I am dealing with told me that Tesla has prioritized production of Model S, Model X and shipments to Europe and Asia over even the more expensive versions of Model 3’s (mine cost almost $59,000 before sales tax). One can easily conclude that production must be at full capacity and that the mix this quarter will contain more higher priced cars. So, demand in the quarter appears to be in excess of 100,000 units and price per car appears strong. Assuming the combination of maximum production in the U.S. and some production out of the Chinese factory, supply might also exceed 100,000 units. If the supply is available, then Tesla should have a strong Q4. However, there is the risk that Tesla doesn’t have the parts to supply both factories or that they have somehow become less efficient. The latest thing to drive down the Tesla stock price is the missteps in showcasing the new truck. I’m not sure why a company should be castigated for an esoteric feature not working in a prototype of a product that won’t be in production until sometime in 2021. Remember, Tesla at its core is a technology company producing next gen autos. I’ve seen other technology companies like Microsoft and Oracle have glitches in demos of future products without such a reaction. As for the design of the truck, I believe Tesla is targeting a 10% to 20% share of the truck market with a differentiated product rather than attempting to attract all potential buyers. 10% of the U.S. pickup market would result in 250,000 units per year. The company has announced pre-orders for the vehicle have already reached 200,000. If these orders are real, they have a home run on their hands but since the deposit is only $100 there is no guarantee that all deposits will convert to actual purchases when the truck goes into production.  

Why Contribution Margin is a Strong Predictor of Success for Companies

In the last post I concluded with a brief discussion of Contribution Margin as a key KPI. Recall:

Contribution Margin = Variable Profits – Sales and Marketing Cost

The higher the contribution margin, the more dollars available towards covering G&A. Once contribution margin exceeds G&A, a company reaches operating profits. For simplicity in this post, I’ll use gross margin (GM) as the definition of variable profits even though there may be other costs that vary directly with revenue.

The Drivers of Contribution Margin (CM)

There is an absolute correlation between GM percent and CM. Very high gross margin companies will, in general, get to strong contribution margins and low gross margin companies will struggle to get there. But the sales and marketing needed to drive growth is just as important. There are several underlying factors in how much needs to be spent on sales and marketing to drive growth:

  1. The profits on a new customer relative to the cost of acquiring her (or him). That is, the CAC (customer acquisition cost) for customers derived from paid advertising compared to the profits on those customers’ first purchase
  2. The portion of new traffic that is “free” from SEO (search engine optimization), PR, existing customers recommending your products, etc.
  3. The portion of revenue that comes from repeat customers

The Relationship Between CAC and First Purchase Profits Has a Dramatic Impact on CM

Suppose Company A spends $60 to acquire a customer and has GM of $90 on the initial purchase by that customer. The contribution margin will already be positive $30 without accounting for customers that are organic or those that are repeat customers; in other words, this tends to be extremely positive! Of course, the startups I see in eCommerce are rarely in this situation but those that are can get to profitability fairly quickly if this relationship holds as they scale.

It would be more typical for companies to find that the initial purchase GM only covers a portion of CAC but that subsequent purchases lead to a positive relationship between the LTV (life time value) of the customer and CAC. If I assume the spend to acquire a customer is $60 and the GM is $30 then the CM on the first purchase would be negative (-$30), and it would take a second purchase with the same GM dollars to cover that initial cost. Most startups require several purchases before recovering CAC which in turn means requiring investment dollars to cover the outlay.

Free Traffic and Contribution Margin

If a company can generate a high proportion of free/organic traffic, there is a benefit to contribution margin. CAC is defined as the marketing spend divided by the number of new customers derived from this spend. Blended CAC is defined as the marketing spend divided by all customers who purchased in the period. The more organically generated and return customers, the lower the “blended CAC”. Using the above example, suppose 50% of the new customers for Company A come from organic (free) traffic. Then the “blended CAC“ would be 50% of the paid CAC. In the above example that would be $30 instead of $60 and if the GM was only $30 the initial purchase would cover blended CAC.

Of course, in addition to obtaining customers for free from organic traffic, companies, as they build their customer base, have an increasing opportunity to obtain free traffic by getting existing customers to buy again. So, a company should never forget that maintaining a persistent relationship with customers leads to improved Contribution Margin.

Spending to Drive Higher Growth Can Mean Lower Contribution Margin

Unless the GM on the first purchase a new customer makes exceeds their CAC, there is an inverse relationship between expanding growth and achieving high contribution margin. Think of it this way: suppose that going into a month the likely organic traffic and repeat buyers are somewhat set. Boosting that month’s growth means increasing the number of new paid customers, which in turn makes paid customers a higher proportion of blended CAC and therefore increases CAC. For an example consider the following assumptions for Company B:

  • The GM is $60 on an average order of $100
  • Paid CAC is $150
  • The company will have 1,000 new customers through organic means and 2,000 repeat buyers or $300,000 in revenue with 60% GM ($180,000) from these customers before spending on paid customers
  • G&A besides marketing for the month will be $150,000
  • Last year Company B had $400,000 in revenue in the same month
  • The company is considering the ramifications of targeting 25%, 50% or 100% year-over-year growth

Table 1: The Relationship Between Contribution Margin & Growth

Since the paid CAC is $150 while Gross Margin is only $60 per new customer, each acquired customer generates negative $90 in contribution margin in the period. As can be seen in Table 1, the company would shrink 25% if there is no acquisition spend but would have $180,000 in contribution margin and positive operating profit. On the other end of the spectrum, driving 100% growth requires spending $750,000 to acquire 5,000 new customers and results in a negative $270,000 in contribution margin and an Operating Loss of $420,000 in the period. Of course, if new customers are expected to make multiple future purchases than the number of repeat customers would rise in future periods.

Subscription Models Create More Consistency but are not a Panacea

When a company’s customers are monthly subscribers, each month starts with the prior month’s base less churn. To put it another way, if churn from the prior month is modest (for example 5%) then that month already has 95% of the prior months revenue from repeat customers. Additionally, if the company increases the average invoice value from these customers, it might even have a starting point where return customers account for as much revenue as the prior month. For B-to-B companies, high revenue retention is the norm, where an average customer will pay them for 10 years or more.

Consumer ecommerce subscriptions typically have much more substantial churn, with an average life of two years being closer to the norm. Additionally, the highest level of churn (which can be as much as 30% or more) occurs in the second month, and the next highest, the third month before tapering off. What this means is that companies trying to drive high sequential growth will have a higher % churn rate than those that target more modest growth. Part of a company’s acquisition spend is needed just to stay even. For example, if we assume all new customers come from paid acquisition, the CAC is $200, and that 15% of 10,000 customers churn then the first $300,000 in marketing spend would just serve to replace the churned customers and additional spend would be needed to drive sequential growth.

Investing in Companies with High Contribution Margin

As a VC, I tend to appreciate strong business models and like to invest after some baseline proof points are in place.  In my last post I outlined a number of metrics that were important ways to track a company’s health with the ratio of LTV (life time value) to CAC being one of the most important. When a company has a high contribution margin they have the time to build that ratio by adding more products or establishing subscriptions without burning through a lot of capital. Further, companies that have a high LTV/CAC ratio should have a high contribution margin as they mature since this usually means customers buy many times – leading to an expansion in repeat business as part of each month’s total revenue.

This thought process also applies to public companies. One of the most extreme is Facebook, which I’ve owned and recommended for five years. Even after the recent pullback its stock price is about 7x what it was five years ago (or has appreciated at a compound rate of nearly 50% per year since I’ve been recommending it). Not a surprise as Facebook’s contribution margin runs over 70% and revenue was up year/year 42% in Q2. These are extraordinary numbers for a company its size.

To give the reader some idea of how this method can be used as one screen for public companies, Table 2 shows gross margin, contribution margin, revenue growth and this year’s stock market performance for seven public companies.

Table 2: Public Company Contribution Margin Analysis

Two of the seven companies shown stand out as having both high Contribution Margin and strong revenue growth: Etsy and Stitch Fix. Each had year/year revenue growth of around 30% in Q2 coupled with 44% and 29% contribution margins, respectively. This likely has been a factor in Stitch Fix stock appreciating 53% and Etsy 135% since the beginning of the year.

Three of the seven have weak models and are struggling to balance revenue growth and contribution margin: Blue Apron, Overstock, and Groupon. Both Blue Apron and Groupon have been attempting to reduce their losses by dropping their marketing spend. While this increased their CM by 10% and 20% respectively, it also meant that they both have negative growth while still losing money. The losses for Blue Apron were over 16% of revenue. This coupled with shrinking revenue feels like a lethal combination. Blue Apron stock is only down a marginal amount year-to-date but is 59% lower than one year ago. Groupon, because of much higher gross margins than Blue Apron (52% vs 35%), still seems to have a chance to turn things around, but does have a lot of work to do. Overstock went in the other direction, increasing marketing spend to drive modest revenue growth of 12%. But this led to a negative CM and substantially increased losses. That strategy did not seem to benefit shareholders as the stock has declined 53% since the beginning of the year.

eBay is a healthy company from a contribution margin point of view but has sub 10% revenue growth. I can’t tell if increasing their market spend by a substantial amount (at the cost of lower CM) would be a better balance for them.

For me, Spotify is the one anomaly in the table as its stock has appreciated 46% since the IPO despite weak contribution margins which was one reason for my negative view expressed in a prior post. I think that is driven by three reasons: its product is an iconic brand; there is not a lot of float in the stock creating some scarcity; and contribution margin has been improving giving bulls on the stock a belief that it can get to profitability eventually. I say it is an anomaly, as comparing it to Facebook, it is hard to justify the relative valuations. Facebook grew 42% in Q2, Spotify 26%; Facebook is trading at a P/E of 24 whereas even if we assume Spotify can eventually get to generating 6% net profit (it currently is at a 7% loss before finance charges and 31% loss after finance charges, so this feels optimistic) Spotify would be trading at 112 times this theoretic future earnings.


SoundBytes

I found the recent controversy over Elon Musk’s sharing his thoughts on taking Tesla private interesting. On the one hand, people want transparency from companies and Elon certainly provides that! On the other hand, it clearly impacted the stock price for a few days and the SEC abhors anything that can be construed as stock manipulation. Of course, Elon may not have been as careful as he should have been when he sent out his tweet regarding whether financing was lined up…but like most entrepreneurs he was optimistic.

Interesting KPIs (Key Performance Indicators) for a Subscription Company

what-are-key-performance-indicators-kpis

In working with early stage businesses, I often get the question as to what metrics should management and the board use to help understand a company’s progress. It is important for every company to establish a set of consistent KPIs that are used to objectively track progress. While these need to be a part of each board package, it is even more important for the executive team to utilize this for managing their company. While this post focuses on SaaS/Subscription companies, the majority of it applies to most other types of businesses.

Areas KPIs Should Cover

  1. P&L Trends
  2. MRR (Monthly Recurring Revenue) and LTR (Lifetime Revenue)
  3. CAC (Cost of Customer Acquisition)
    1. Marketing to create leads
    2. Customers acquired electronically
    3. Customers acquired using sales professionals
  4. Gross Margin and LTV (Life Time Value of a customer)
  5. Marketing Efficiency

Many companies will also need KPIs regarding inventory in addition to the ones above.

While there may be very complex analysis behind some of these numbers, it’s important to try to keep KPIs to 2-5 pages of a board package. Use of the right KPIs will give a solid, objective, consistent top-down view of the company’s progress. The P&L portion of the package is obviously critical, but I have a possibly unique view on how this should be included in the body of a board package.

P&L Trends: Less is More

One mistake many companies make is confusing detail with better analysis. I often see models that have 50-100 line items for expenses and show this by month for 3 or more years out… but show one or no years of history. What this does is waste a great deal of time on predicting things that are inconsequential and controllable (by month), while eliminating all perspective. Things like seasonality are lost if one is unable to view 3 years of revenue at a time without scrolling from page to page. Of course, for the current year’s budget it is appropriate for management to establish monthly expectations in detail, but for any long-term planning, success revolves around revenue, gross margins, marketing/sales spend and the number of employees. For some companies that are deep technology players there may be significant costs in R&D other than payroll, but this is the exception. By using a simple formula for G&A based on the number of employees, the board can apply a sanity check on whether cost estimates in the long-term model will be on target assuming revenue is on target. So why spend excessive time on nits? Aggregating cost frees up time for better understanding how and why revenue will ramp, the relationship between revenue types and gross margin, the cost of acquiring a customer, the lifetime value of a customer and the average spend per employee.

In a similar way, the board is well served by viewing a simple P&L by quarter for 2 prior years plus the current one (with a forecast of remaining quarters). The lines could be:

Table1: P&L by Quarter

A second version of the P&L should be produced for budget comparison purposes. It should have the same rows but have the columns be current period actual, current period budget, year to date (YTD) actual, year to date budget, current full year forecast, budget for the full year.

Table 2: P&L Actual / Budget Comparison

Tracking MRR and LTR

For any SaaS/Subscription company (I’ll simply refer to this as SaaS going forward) MRR growth is the lifeblood of the company with two caveats: excessive churn makes MRR less valuable and excessive cost in growing MRR also leads to deceptive prosperity. More about that further on. MRR should be viewed on a rolling basis. It can be done by quarter for the board but by month for the management team. Doing it by quarter for the board enables seeing a 3-year trend on one page and gives the board sufficient perspective for oversight. Management needs to track this monthly to better manage the business. A relatively simple set of KPIs for each of 12 quarterly periods would be:

Table 3: MRR and Retention

Calculating Life Time Revenue through Cohort Analysis

The detailed method of calculating LTR does not need to be shown in every board package but should be included at least once per year, but calculated monthly for management.

The LTR calculation uses a grid where the columns would be the various Quarterly cohorts, that is all customers that first purchased that quarter (management might also do this using monthly instead of quarterly). This analysis can be applied to non-SaaS companies as well as SaaS entities. The first row would be the number of customers in the cohort. The next row would be the first month’s revenue for the cohort, the next the second months revenue, and so on until reaching 36 months (or whatever number the board prefers for B2B…I prefer 60 months). The next row would be the total for the full period and the final row would be the average Lifetime Revenue, LTR, per member of the cohort.

Table 4: Customer Lifetime Revenue

A second table would replicate the grid but show average per member of the cohort for each month (row). That table allows comparisons of cohorts to see if the average revenue of a newer cohort is getting better or worse than older ones for month 2 or month 6 or month 36, etc.

Table 5: Average Revenue per Cohort

Cohorts that have a full 36 months of data need to be at least 36 months old. What this means is that more recent cohorts will not have a full set of information but still can be used to see what trends have occurred. For example, is the second months average revenue for a current cohort much less than it was for a cohort one year ago? While newer cohorts do not have full sets of monthly revenue data, they still are very relevant in calculating more recent LTR. This can be done by using average monthly declines in sequential months and applying them to cohorts with fewer months of data.

Customer Acquisition Cost (CAC)

Calculating CAC is done in a variety of ways and is quite different for customers acquired electronically versus those obtained by a sales force.  Many companies I’ve seen have a combination of the two.

Marketing used to generate leads should always be considered part of CAC. The marketing cost in a month first is divided by the number of leads to generate a cost/lead. The next step is to estimate the conversion rate of leads to customers. A simple table would be as follows:

Table 6: Customer Acquisition Costs

table 6.1

For an eCommerce company, the additional cost to convert might be one free month of product or a heavily subsidized price for the first month. If the customer is getting the item before becoming a regular paying customer than the CAC would be:

CAC = MCTC / the percent that converts from the promotional trial to a paying customer.

CAC when a Sales Force is Involved

For many eCommerce companies and B2B companies that sell electronically, marketing is the primary cost involved in acquiring a paying customer. For those utilizing a sales force, the marketing expense plus the sales expense must be accumulated to determine CAC.

Typically, what this means is steps 1 through 3 above would still be used to determine CPL, but step 1 above might include marketing personnel used to generate leads plus external marketing spend:

  1. CPL (cost per lead) as above
  2. Sales Cost = current month’s cost of the sales force including T&E
  3. New Customers in the month = NC
  4. Conversion Rate to Customer = NC/number of leads= Y%
  5. CAC = CPL/Y% + (Sales Cost)/NC

There are many nuances ignored in the simple method shown. For example, some leads may take many months to close. Some may go through a pilot before closing. Therefore, there are more sophisticated methods of calculating CAC but using this method would begin the process of understanding an important indicator of efficiency of customer acquisition.

Gross Margin (GM) is a Critical Part of the Equation

While revenue is obviously an important measure of success, not all revenue is the same. Revenue that generates 90% gross margin is a lot more valuable per dollar than revenue that generates 15% gross margin. When measuring a company’s potential for future success it’s important to understand what level of revenue is required to reach profitability. A first step is understanding how gross margin may evolve. When a business scales there are many opportunities to improve margins:

  • Larger volumes may lead to larger discounts from suppliers
  • Larger volumes for products that are software/content may lower the hosting cost as a percent of revenue
  • Shipping to a larger number of customers may allow opening additional distribution centers (DCs) to facilitate serving customers from a DC closer to their location lowering shipping cost
  • Larger volumes may mean improved efficiency in the warehouse. For example, it may make more automation cost effective

When forecasting gross margin, it is important to be cautious in predicting some of these savings. The board should question radical changes in GM in the forecast. Certain efficiencies should be seen in a quarterly trend, and a marked improvement from the trend needs to be justified. The more significant jump in GM from a second DC can be calculated by looking at the change in shipping rates for customers that will be serviced from the new DC vs what rates are for these customers from the existing one.

Calculating LTV (Lifetime Value)

Gross Margin, by itself may be off as a measure of variable profits of a customer. If payment is by credit card, then the credit card cost per customer is part of variable costs. Some companies do not include shipping charges as part of cost of goods, but they should always be part of variable cost. Customer service cost is typically another cost that rises in proportion to the number of customers. So:

Variable cost = Cost of Goods sold plus any cost that varies directly with sales

Variable Profit = Revenue – Variable Cost

Variable Profit% (VP%) = (Variable Profit)/Revenue

LTV = LTR x VP%

The calculation of VP% should be based on current numbers as they will apply going forward. Determining a company’s marketing efficiency requires comparing LTV to the cost of customer acquisition. As mentioned earlier in the post, if the CAC is too large a proportion of LTV, a company may be showing deceptive (profitless) growth. So, the next set of KPIs address marketing efficiency.

Marketing Efficiency

It does not make sense to invest in an inefficient company as they will burn through capital at a rapid rate and will find it difficult to become profitable. A key measure of efficiency is the relationship between LTV and CAC or LTV/CAC. Essentially this is how many dollars of variable profit the company will make for every dollar it spends on marketing and sales. A ratio of 5 or more usually means the company is efficient. The period used for calculating LTR will influence this number. Since churn tends to be much lower for B2B companies, 5 years is often used to calculate LTR and LTV. But, using 5 years means waiting longer to receive resulting profits and can obscure cash flow implications of slower recovery of CAC. So, a second metric important to understand burn is how long it takes to recover CAC:

CAC Recovery Time = number of months until variable profit equals the CAC

The longer the CAC recovery time, the more capital required to finance growth. Of course, existing customers are also contributing to the month’s revenue alongside new customers. So, another interesting KPI is contribution margin which measures the current state of balance between marketing/sales and Variable Profits:

Contribution Margin = Variable Profits – Sales and Marketing Cost

Early on this number will be negative as there aren’t enough older customers to cover the investment in new ones. But eventually the contribution margin in a month needs to turn positive. To reach profitability it needs to exceed all other costs of the business (G&A, R&D, etc.). By reducing a month’s marketing cost, a company can improve contribution margin that month at the expense of sequential growth… which is why this is a balancing act.

I realize this post is long but wanted to include a substantial portion of KPIs in one post. However, I’ll leave more detailed measurement of sales force productivity and deeper analysis of several of the KPIs discussed here for one or more future posts.

Soundbytes

I’ll begin by apologizing for a midyear brag, but I always tell others to enjoy success and therefore am about to do that myself. In my top ten predictions for 2018 I included a market prediction and 4 stock predictions. I was feeling pretty good that they were all working well when I started to create this post. However, the stock prices for high growth stocks can experience serious shifts in very short periods. Facebook and Tesla both had (what I consider) minor shortfalls against expectations in the 10 days since and have subsequently declined quite a bit in that period. But given the strength of my other two recommendations, Amazon and Stitchfix, the four still have an average gain of 15% as of July 27. Since I’ve only felt comfortable predicting the market when it was easy (after 9/11 and after the 2008 mortgage blowup), I was nervous about predicting the S&P would be up this year as it was a closer call and was somewhat controversial given the length of the bull market prior to this year. But it seemed obvious that the new tax law would be very positive for corporate earnings. So, I thought the S&P would be up despite the likelihood of rising interest rates. So far, it is ahead 4.4% year to date driven by stronger earnings. Since I always fear that my record of annual wins can’t continue I wanted to take a midyear victory lap just in case everything collapses in the second half of the year (which I don’t expect but always fear). So I continue to hold all 4 stocks and in fact bought a bit more Facebook today.

The Valuation Bible

Facebook valuation image

After many years of successfully picking public and private companies to invest in, I thought I’d share some of the core fundamentals I use to think about how a company should be valued. Let me start by saying numerous companies defy the logic that I will lay out in this post, often for good reasons, sometimes for poor ones. However, eventually most companies will likely approach this method, so it should at least be used as a sanity check against valuations.

When a company is young, it may not have any earnings at all, or it may be at an earnings level (relative to revenue) that is expected to rise. In this post, I’ll start by considering more mature companies that are approaching their long-term model for earnings to establish a framework, before addressing how this framework applies to less mature companies. The post will be followed by another one where I apply the rules to Tesla and discuss how it carries over into private companies.

Growth and Earnings are the Starting Points for Valuing Mature Companies

When a company is public, the most frequently cited metric for valuation is its price to earnings ratio (PE). This may be done based on either a trailing 12 months or a forward 12 months. In classic finance theory a company should be valued based on the present value of future cash flows. What this leads to is our first rule:

Rule 1: Higher Growth Rates should result in a higher PE ratio.

When I was on Wall Street, I studied hundreds of growth companies (this analysis does not apply to cyclical companies) over the prior 10-year period and found that there was a very strong correlation between a given year’s revenue growth rate and the next year’s revenue growth rate. While the growth rate usually declined year over year if it was over 10%, on average this decline was less than 20% of the prior year’s growth rate. What this means is that if we took a group of companies with a revenue growth rate of 40% this year, the average organic growth for the group would likely be about 33%-38% the next year. Of course, things like recessions, major new product releases, tax changes, and more could impact this, but over a lengthy period of time this tended to be a good sanity test. As of January 2, 2018, the average S&P company had a PE ratio of 25 on trailing earnings and was growing revenue at 5% per year. Rule 1 implies that companies growing faster should have higher PEs and those growing slower, lower PEs than the average.

Graph 1: Growth Rates vs. Price Earnings Ratios

graph

The graph shows the correlation between growth and PE based on the valuations of 21 public companies. Based on Rule 1, those above the line may be relatively under-priced and those below relatively over-priced. I say ‘may be’ as there are many other factors to consider, and the above is only one of several ways to value companies. Notice that most of the theoretically over-priced companies with growth rates of under 5% are traditional companies that have long histories of success and pay a dividend. What may be the case is that it takes several years for the market to adjust to their changed circumstances or they may be valued based on the return from the dividend. For example, is Coca Cola trading on: past glory, its 3.5% dividend, or is there something about current earnings that is deceptive (revenue growth has been a problem for several years as people switch from soda to healthier drinks)? I am not up to speed enough to know the answer. Those above the line may be buys despite appearing to be highly valued by other measures.

Relatively early in my career (in 1993-1995) I applied this theory to make one of my best calls on Wall Street: “Buy Dell sell Kellogg”. At the time Dell was growing revenue over 50% per year and Kellogg was struggling to grow it over 4% annually (its compounded growth from 1992 to 1995, this was partly based on price increases). Yet Dell’s PE was about half that of Kellogg and well below the S&P average. So, the call, while radical at the time, was an obvious consequence of Rule 1. Fortunately for me, Dell’s stock appreciated over 65X from January 1993 to January 2000 (and well over 100X while I had it as a top pick) while Kellogg, despite large appreciation in the overall stock market, saw its stock decline slightly over the same 7-year period (but holders did receive annual dividends).

Rule 2: Predictability of Revenue and Earnings Growth should drive a higher trailing PE

Investors place a great deal of value on predictability of growth and earnings, which is why companies with subscription/SaaS models tend to get higher multiples than those with regular sales models. It is also why companies with large sales backlogs usually get additional value. In both cases, investors can more readily value the companies on forward earnings since they are more predictable.

Rule 3: Market Opportunity should impact the Valuation of Emerging Leaders

When one considers why high growth rates might persist, the size of the market opportunity should be viewed as a major factor. The trick here is to make sure the market being considered is really the appropriate one for that company. In the early 1990s, Dell had a relatively small share of a rapidly growing PC market. Given its competitive advantages, I expected Dell to gain share in this mushrooming market. At the same time, Kellogg had a stable share of a relatively flat cereal market, hardly a formula for growth. In recent times, I have consistently recommended Facebook in this blog for the very same reasons I had recommended Dell: in 2013, Facebook had a modest share of the online advertising, a market expected to grow rapidly. Given the advantages Facebook had (and they were apparent as I saw every Azure ecommerce portfolio company moving a large portion of marketing spend to Facebook), it was relatively easy for me to realize that Facebook would rapidly gain share. During the time I’ve owned it and recommended it, this has worked out well as the share price is up over 8X.

How the rules can be applied to companies that are pre-profit

As a VC, it is important to evaluate what companies should be valued at well before they are profitable. While this is nearly impossible to do when we first invest (and won’t be covered in this post), it is feasible to get a realistic range when an offer comes in to acquire a portfolio company that has started to mature. Since they are not profitable, how can I apply a PE ratio?

What needs to be done is to try to forecast eventual profitability when the company matures. A first step is to see where current gross margins are and to understand whether they can realistically increase. The word realistic is the key one here. For example, if a young ecommerce company currently has one distribution center on the west coast, like our portfolio company Le Tote, the impact on shipping costs of adding a second eastern distribution center can be modeled based on current customer locations and known shipping rates from each distribution center. Such modeling, in the case of Le Tote, shows that gross margins will increase 5%-7% once the second distribution center is fully functional. On the other hand, a company that builds revenue city by city, like food service providers, may have little opportunity to save on shipping.

  • Calculating variable Profit Margin

Once the forecast range for “mature” gross margin is estimated, the next step is to identify other costs that will increase in some proportion to revenue. For example, if a company is an ecommerce company that acquires most of its new customers through Facebook, Google and other advertising and has high churn, the spend on customer acquisition may continue to increase in direct proportion to revenue. Similarly, if customer service needs to be labor intensive, this can also be a variable cost. So, the next step in the process is to access where one expects the “variable profit margin” to wind up. While I don’t know the company well, this appears to be a significant issue for Blue Apron: marketing and cost of goods add up to about 90% of revenue. I suspect that customer support probably eats up (no pun intended) 5-10% of what is left, putting variable margins very close to zero. If I assume that the company can eventually generate 10% variable profit margin (which is giving it credit for strong execution), it would need to reach about $4 billion in annual revenue to reach break-even if other costs (product, technology and G&A) do not increase. That means increasing revenue nearly 5-fold. At their current YTD growth rate this would take 9 years and explains why the stock has a low valuation.

  • Estimating Long Term Net Margin

Once the variable profit margin is determined, the next step would be to estimate what the long-term ratio of all other operating cost might be as a percent of revenue. Using this estimate I can determine a Theoretic Net Earnings Percent. Applying this percent to current (or next years) revenue yields a Theoretic Earnings and a Theoretic PE (TPE):

TPE= Market Cap/Theoretic Earnings     

To give you a sense of how I successfully use this, review my recap of the Top Ten Predictions from 2017 where I correctly predicted that Spotify would not go public last year despite strong top line growth as it was hard to see how its business model could support more than 2% or so positive operating margin, and that required renegotiating royalty deals with record labels.  Now that Spotify has successfully negotiated a 3% lower royalty rate from several of the labels, it appears that the 16% gross margins in 2016 could rise to 19% or more by the end of 2018. This means that variable margins (after marketing cost) might be 6%. This would narrow its losses, but still means it might be several years before the company achieves the 2% operating margins discussed in that post. As a result, Spotify appears headed for a non-traditional IPO, clearly fearing that portfolio managers would not be likely to value it at its private valuation price since that would lead to a TPE of over 200. Since Spotify is loved by many consumers, individuals might be willing to overpay relative to my valuation analysis.

Our next post will pick up this theme by walking through why this leads me to believe Tesla continues to have upside, and then discussing how entrepreneurs should view exit opportunities.


SoundBytes

I’ve often written about effective shooting percentage relative to Stephen Curry, and once again he leads the league among players who average 15 points or more per game. What also accounts for the Warriors success is the effective shooting of Klay Thompson, who is 3rd in the league, and Kevin Durant who is 6th. Not surprisingly, Lebron is also in the top 10 (4th). The table below shows the top ten among players averaging 15 points or more per game.  Of the top ten scorers in the league, 6 are among the top 10 effective shooters with James Harden only slightly behind at 54.8%. The remaining 3 are Cousins (53.0%), Lillard (52.2%), and Westbrook, the only one below the league average of 52.1% at 47.4%.

Table: Top Ten Effective Shooters in the League

table

*Note: Bolded players denote those in the top 10 in Points per Game

Ten Predictions for 2018

In my recap of 2017 predictions I pointed out how boring my stock predictions have been with Tesla and Facebook on my list every year since 2013 and Amazon on for two of the past three years. But what I learned on Wall Street is that sticking with companies that have strong competitive advantages in a potentially mega-sized market can create great performance over time (assuming one is correct)! So here we go again, because as stated in my January 5 post, I am again including Tesla, Facebook and Amazon in my Top ten list for 2018. I believe they each continue to offer strong upside, as explained below. I’m also adding a younger company, with a modest market cap, thus more potential upside coupled with more risk. The company is Stitch Fix, an early leader in providing women with the ability to shop for fashion-forward clothes at home. My belief in the four companies is backed up by my having an equity position in each of them.

I’m expecting the four stocks to outperform the market. So, in a steeply declining market, out-performance might occur with the stock itself being down (but less than the market). Having mentioned the possibility of a down market, I’m predicting the market will rise this year. This is a bit scary for me, as predicting the market as a whole is not my specialty.

We’ll start with the stock picks (with January 2 opening prices of stocks shown in parenthesis) and then move on to the remainder of my 10 predictions.

1. Tesla stock appreciation will continue to outpace the market (it opened the year at $312/share).

The good news and bad news on Tesla is the delays in production of the Model 3. The good part is that we can still look forward to massive increases in the number of cars the company sells once Tesla gets production ramping (I estimate the Model 3 backlog is well in excess of 500,000 units going into 2018 and demand appears to be growing). In 2017, Tesla shipped between 80,000 and 100,000 vehicles with revenue up 30% in Q3 without help from the model 3. If the company is successful at ramping capacity (and acquiring needed parts), it expects to reach a production rate of 5,000 cars per week by the end of Q1 and 10,000 by the end of the year. That could mean that the number of units produced in Q4 2018 will be more than four times that sold in Q4 2017 (with revenue about 2.0-2.5x due to the Model 3 being a lower priced car). Additionally, while it is modest compared to revenue from selling autos, the company appears to be the leader in battery production. It recently announced the largest battery deal ever, a $50 million contract (now completed on time) to supply what is essentially a massive backup battery complex for energy to Southern Australia. While this type of project is unlikely to be a major portion of revenue in the near term, it can add to Tesla’s growth rate and profitability.

2. Facebook stock appreciation will continue to outpace the market (it opened the year at $182/share).

The core Facebook user base growth has slowed considerably but Facebook has a product portfolio that includes Instagram, WhatsApp and Oculus. This gives Facebook multiple opportunities for revenue growth: Improve the revenue per DAU (daily active user) on Facebook itself; increase efforts to monetize Instagram and WhatsApp in more meaningful ways; and build the install base of Oculus. Facebook advertising rates have been increasing steadily as more mainstream companies shift budget from traditional advertising to Facebook, especially in view of declining TV viewership coupled with increased use of DVRs (allowing viewers to skip ads). Higher advertising rates, combined with modest growth in DAUs, should lead to continued strong revenue growth. And while the Oculus product did not get out of the gate as fast as expected, it began picking up steam in Q3 2017 after Facebook reduced prices. At 210,000 units for the quarter it may have contributed up to 5% of Q3 revenue. The wild card here is if a “killer app” (a software application that becomes a must have) launches that is only available on the Oculus, sales of Oculus could jump substantially in a short time.

3. Amazon stock appreciation will outpace the market (it opened the year at $1188/share).

Amazon, remarkably, increased its revenue growth rate in 2017 as compared to 2016. This is unusual for companies of this size. In 2018, we expect online to continue to pick up share in retail and Amazon to gain more share of online. The acquisition of Whole Foods will add approximately $4B per quarter in revenue, boosting year/year revenue growth of Amazon an additional 9%-11% per quarter, if Whole Foods revenue remains flattish. If Amazon achieves organic growth of 25% (in Q3 it was 29% so that would be a drop) in 2018, this would put the 3 quarters starting in Q4 2017 at about 35% growth. While we do expect Amazon to boost Whole Foods revenue, that is not required to reach those levels. In Q4 2018, reported revenue will return to organic growth levels. The Amazon story also features two other important growth drivers. First, I expect the Echo to have another substantial growth year and continue to emerge as a new platform in the home. Additionally, Amazon appears poised to benefit from continued business migration to the cloud coupled with increased market share and higher average revenue per cloud customer. This will be driven by modest price increases and introduction of more services as part of its cloud offering. The success of the Amazon Echo with industry leading voice technology should continue to provide another boost to Amazon’s revenue. Additionally, having a large footprint of physical stores will allow Amazon to increase distribution of many products.

4. Stitch Fix stock appreciation will outpace the market (it opened the year at $25/share and is at the same level as I write this post).

Stitch Fix is my riskiest stock forecast. As a new public company, it has yet to establish a track record of performance that one can depend upon. On the other hand, it’s the early leader in a massive market that will increasingly move online, at-home shopping for fashion forward clothes. The number of people who prefer shopping at home to going to a physical store is on the increase. The type of goods they wish to buy expands every year. Now, clothing is becoming a new category on the rapid rise (it grew from 11% of overall clothing retail sales in 2011 to 19% in 2016). It is important for women buying this way to feel that the provider understands what they want and facilitates making it easy to obtain clothes they prefer. Stitch Fix uses substantial data analysis to personalize each box it sends a customer. The woman can try them on, keep (and pay for) those they like, and return the rest very easily.

5. The stock market will rise in 2018 (the S&P opened the year at 2,696 on January 2).

While I have been accurate on recommending individual stocks over a long period, I rarely believe that I understand what will happen to the overall market. Two prior exceptions were after 9/11 and after the 2008 mortgage crisis generated meltdown. I was correct both times but those seemed like easy calls. So, it is with great trepidation that I’m including this prediction as it is based on logic and I know the market does not always follow logic! To put it simply, the new tax bill is quite favorable to corporations and therefore should boost after-tax earnings. What larger corporations pay is often a blend of taxes on U.S. earnings and those on earnings in various countries outside the U.S. There can be numerous other factors as well. Companies like Microsoft have lower blended tax rates because much of R&D and corporate overhead is in the United States and several of its key products are sold out of a subsidiary in a low tax location, thereby lowering the portion of pre-tax earnings here. This and other factors (like tax benefits in fiscal 2017 from previous phone business losses) led to blended tax rates in fiscal 2015, 2016 and 2017 of 34%, 15% and 8%, respectively. Walmart, on the other hand, generated over 75% of its pre-tax earnings in the United States over the past three fiscal years, so their blended rate was over 30% in each of those years

Table 1: Walmart Blended Tax Rates 2015-2017

The degree to which any specific company’s pre-tax earnings mix changes between the United States and other countries is unpredictable to me, so I’m providing a table showing the impact on after-tax earnings growth for theoretical companies instead. Table 2 shows the impact of lowering the U.S. corporate from 35% to 21% on four example companies. To provide context, I show two companies growing pre-tax earnings by 10% and two companies by 30%. If blended tax rates didn’t change, EPS would grow by the same amount as pre-tax earnings. For Companies 1 and 3, Table 2 shows what the increase in earnings would be if their blended 2017 tax rate was 35% and 2018 shifts to 21%. For companies 2 and 4, Table 2 shows what the increase in earnings would be if the 2017 rate was 30% (Walmart’s blended rate the past three years) and the 2018 blended rate is 20%.

Table 2: Impact on After-Tax Earnings Growth

As you can see, companies that have the majority of 2018 pre-tax earnings subject to the full U.S. tax rate could experience EPS growth 15%-30% above their pre-tax earnings growth. On the other hand, if a company has a minimal amount of earnings in the U.S. (like the 5% of earnings Microsoft had in fiscal 2017), the benefit will be minimal. Whatever benefits do accrue will also boost cash, leading to potential investments that could help future earnings.  If companies that have maximum benefits from this have no decline in their P/E ratio, this would mean a substantial increase in their share price, thus the forecast of an up market. But as I learned on Wall Street, it’s important to sight risk. The biggest risks to this forecast are the expected rise in interest rates this year (which usually is negative for the market) and the fact that the market is already at all-time highs.

6. Battles between the federal government and states will continue over marijuana use but the cannabis industry will emerge as one to invest in.

The battle over legalization of Marijuana reached a turning point in 2017 as polls showed that over 60% of Americans now favor full legalization (as compared to 12% in 1969). Prior to 2000, only three states (California, Oregon and Maine) had made medical cannabis legal. Now 29 states have made it legal for medical use and six have legalized sale for recreational use. Given the swing in voter sentiment (and a need for additional sources of tax revenue), more states are moving towards legalization for recreational and medical purposes. This has put the “legal” marijuana industry on a torrid growth curve. In Colorado, one of the first states to broadly legalize use, revenue is over $1 billion per year and overall 2017 industry revenue is estimated at nearly $8 billion, up 20% year/year. Given expected legalization by more states and the ability to market product openly once it is legal, New Frontier Data predicts that industry revenue will more than triple by 2025. The industry is making a strong case that medical use has compelling results for a wide variety of illnesses and high margin, medical use is forecast to generate over 50% of the 2025 revenue. Given this backdrop, public cannabis companies have had very strong performance. Despite this, in 2016, VCs only invested about $49 million in the sector. We expect that number to escalate dramatically in 2017 through 2019. While public cannabis stocks are trading at nosebleed valuations, they could have continued strong performance as market share consolidates and more states (and Canada) head towards legalization. One caveat to this is that Federal law still makes marijuana use illegal and the Trump administration is adopting a more aggressive policy towards pursuing producers, even in states that have made use legal. The states that have legalized marijuana use are gearing up to battle the federal government.

7. At least one city will announce a new approach to Urban transport

Traffic congestion in cities continues to worsen. Our post on December 14, 2017 discussed a new approach to urban transportation, utilizing small footprint automated cars (one to two passengers, no trunk, no driver) in a dedicated corridor. This appears much more cost effective than a Rapid Bus Transit solution and far more affordable than new subway lines. As discussed in that post, Uber and other ride services increase traffic and don’t appear to be a solution. The thought that automating these vehicles will relieve pressure is overly optimistic. I expect at least one city to commit to testing the method discussed in the December post before the end of this year – it is unlikely to be a U.S. city. The approach outlined in that post is one of several that is likely to be tried over the coming years as new thinking is clearly needed to prevent the traffic congestion that makes cities less livable.

8. Offline retailers will increase the velocity of moving towards omnichannel.

Retailers will adopt more of a multi-pronged approach to increasing their participation in e-commerce. I expect this to include:

  • An increased pace of acquisition of e-commerce companies, technologies and brands with Walmart leading the way. Walmart and others need to participate more heavily in online as their core offline business continues to lose share to online. In 2017, Walmart made several large acquisitions and has emerged as the leader among large retailers in moving online. This, in turn, has helped its stock performance. After a stellar 12 months in which the stock was up over 40%, it finally exceeded its January 2015 high of $89 per share (it reached $101/share as we are finalizing the post). I expect Walmart and others in physical retail to make acquisitions that are meaningful in 2018 so as to speed up the transformation of their businesses to an omnichannel approach.
  • Collaborating to introduce more online/technology into their physical stores (which Amazon is likely to do in Whole Foods stores). This can take the form of screens in the stores to order online (a la William Sonoma), having online purchases shipped to your local store (already done by Nordstrom) and adding substantial ability to use technology to create personalized items right at the store, which would subsequently be produced and shipped by a partner.

9. Social commerce will begin to emerge as a new category.

Many e-commerce sites have added elements of social, and many social sites have begun trying to sell various products. But few of these have a fully integrated social approach to e-commerce. The elements of a social approach to e-commerce include:

  • A feed-based user experience
  • Friends’ actions impact your feed
  • Following trend setters to see what they are buying, wearing, and favoring
  • Notifications based on your likes and tastes
  • One click to buy
  • Following particular stores and/or friends

I expect to see existing e-commerce players adding more elements of social, existing social players improving their approach to commerce and a rising trend of emerging companies focused on fully integrated social commerce.

10. “The Empire Strikes Back”: automobile manufacturers will begin to take steps to reclaim use of its GPS.

It is almost shameful that automobile manufacturers, other than Tesla, have lost substantial usage of their onboard GPS systems as many people use their cell phones or a small device to run Google, Waze (owned by Google) or Garmin instead of the larger screen in their car. In the hundreds of times I’ve taken an Uber or Lyft, I’ve never seen the driver use their car’s system. To modernize their existing systems, manufacturers may need to license software from a third party. Several companies are offering next generation products that claim to replicate the optimization offered by Waze but also add new features that go beyond it like offering to order coffee and other items to enable the driver to stop at a nearby location and have the product prepaid and waiting for them. In addition to adding value to the user, this also leads to a lead-gen revenue opportunity. In 2018, I expect one or more auto manufacturers to commit to including a third-party product in one or more of their models.

Soundbytes

Tesla model 3 sample car generates huge buzz at Stanford Mall in Menlo Park California. This past weekend my wife and I experienced something we had not seen before – a substantial line of people waiting to check out a car, one of the first Model 3 cars seen live. We were walking through the Stanford Mall where Tesla has a “Guide Store” and came upon a line of about 60 people willing to wait a few hours to get to check out one of the two Model 3’s available for perusal in California (the other was in L.A.). An hour later we came back, and the line had grown to 80 people. To be clear, the car was not available for a test drive, only for seeing it, sitting in it, finding out more info, etc. Given the buzz involved, it seems to me that as other locations are given Model 3 cars to look at, the number of people ordering a Model 3 each week might increase faster than Tesla’s capacity to fulfill.

How much do you know about SEO?

Search Engine Optimization: A step by step process recommended by experts

Azure just completed its annual ecommerce marketing day. It was attended by 15 of our portfolio companies, two high level executives at major corporations, a very strong SEO consultant and the Azure team. The purpose of the day is to help the CMOs in the Azure portfolio gain a broader perspective on hot marketing topics and share ideas and best practices. This year’s agenda included the following sessions:

  1. Working with QVC/HSN
  2. Brand building
  3. Using TV, radio and/or podcasts for marketing
  4. Techniques to improve email marketing
  5. Measuring and improving email marketing effectiveness
  6. Storytelling to build your brand and drive marketing success
  7. Working with celebrities, brands, popular YouTube personalities, etc.
  8. Optimizing SEO
  9. Product Listing Ads (PLAs) and Search Engine Marketing (SEM)

One pleasant aspect of the day is that it generated quite a few interesting ideas for blog posts! In other words, I learned a lot regarding the topics covered. This post is on an area many of you may believe you know well, Search Engine Optimization (SEO). I thought I knew it well too… before being exposed to a superstar consultant, Allison Lantz, who provided a cutting-edge presentation on the topic. With her permission, this post borrows freely from her content. Of course, I’ve added my own ideas in places and may have introduced some errors in thinking, and a short post can only touch on a few areas and is not a substitute for true expertise.

SEO is Not Free if You Want to Optimize

I have sometimes labeled SEO as a free source of visitors to a site, but Allison correctly points out that if you want to focus on Optimization (the O in SEO) with the search engines, then it isn’t free, but rather an ongoing process (and investment) that should be part of company culture. The good news is that SEO likely will generate high quality traffic that lasts for years and leads to a high ROI against the cost of striving to optimize. All content creators should be trained to write in a manner that optimizes generating traffic by using targeted key words in their content and ensuring these words appear in the places that are optimal for search. To be clear, it’s also best if the content is relevant, well written and user-friendly. If you were planning to create the content anyway, then the cost of doing this is relatively minor. However, if the content is incremental to achieve higher SEO rankings, then the cost will be greater. But I’m getting ahead of myself and need to review the step by step process Allison recommends to move towards optimization.

Keyword Research

The first thing to know when developing an SEO Strategy is what you are targeting to optimize. Anyone doing a search enters a word or phrase they are searching for. Each such word or phrase is called a ‘keyword’. If you want to gain more users through SEO, it’s critical to identify thousands, tens of thousands or even hundreds of thousands of keywords that are relevant to your site. For a fashion site, these could be brands, styles, and designers. For an educational site like Education.com (an Azure portfolio company that is quite strong in SEO and ranks on over 600,000 keywords) keywords might be math, english, multiplication, etc. The broader the keywords, the greater the likelihood of higher volume.  But along with that comes more competition for search rankings and a higher cost per keyword. The first step in the process is spending time brainstorming what combinations of words are relevant to your site – in other words if someone searched for that specific combination would your site be very relevant to them? To give you an idea of why the number gets very high, consider again Education.com. Going beyond searching on “math”, one can divide math into arithmetic, algebra, geometry, calculus, etc. Each of these can then be divided further. For example, arithmetic can include multiplication, addition, division, subtraction, exponentiation, fractions and more.  Each of these can be subdivided further with multiplication covering multiplication games, multiplication lesson plans, multiplication worksheets, multiplication quizzes and more.

Ranking Keywords

Once keywords are identified the next step is deciding which ones to focus on. The concept leads to ranking keywords based upon the likely number of clicks to your site that could be generated from each one and the expected value of potential users obtained through these clicks. Doing this requires determining for each keyword:

  • Monthly searches
  • Competition for the keyword
  • Conversion potential
  • Effort (and possible cost) required to achieve a certain ranking

Existing tools report the monthly volume of searches for each keyword (remember to add searches on Bing to those on Google). Estimating the strength of competition requires doing a search using the keyword and learning who the top-ranking sites are currently (given the volume of keywords to analyze, this is very labor intensive). If Amazon is a top site they may be difficult to surpass but if the competition includes relatively minor players, they would be easier to outrank.

The next question to answer for each keyword is: “What is the likelihood of converting someone who is searching on the keyword if they do come to my site”. For example, for Education.com, someone searching on ‘sesame street math games’ might not convert well since they don’t have the license to use Sesame Street characters in their math games. But someone searching on ‘1st grade multiplication worksheets’ would have a high probability of converting since the company is world-class in that area. The other consideration mentioned above is the effort required to achieve a degree of success. If you already have a lot of content relevant to a keyword, then search optimizing that content for the keyword might not be very costly. But, if you currently don’t have any content that is relevant or the keyword is very broad, then a great deal more work might be required.

Example of Keyword Ranking Analysis

Source: Education.com

Comparing Effort Required to Estimated Value of Keywords

Once you have produced the first table, you can make a very educated guess on your possible ranking after about 12 months (the time it may take Google/Bing to recognize your new status for that keyword).

There are known statistics on what the likely click-through rates (share of searches against the keyword) will be if you rank 1st, 2nd, 3rd, etc. Multiplying that by the average search volume for that keyword gives a reasonable estimate of the monthly traffic that this would generate to your site. The next step is to estimate the rate at which you will convert that traffic to members (where they register so you get their email) and/or customers (I’ll assume customers for the rest of this post but the same method would apply to members). Since you already know your existing conversion rate, in general, this could be your estimate. But, if you have been buying clicks on that keyword from Google or Bing, you may already have a better estimate of conversion. Multiplying the number of customers obtained by the LTV (Life Time Value) of a customer yields the $ value generated if the keyword obtains the estimated rank. Subtract from this the current value being obtained from the keyword (based on its current ranking) to see the incremental benefit.

Content Optimization

One important step to improve rankings is to use keywords in titles of articles. While the words to use may seem intuitive, it’s important to test variations to see how each may improve results. Will “free online multiplication games” outperform “free times table games”. The way to test this is by trying each for a different 2-week (or month) time period and see which gives a higher CTR (Click Through Rate). As discussed earlier, it’s also important to optimize the body copy against keywords. Many of our companies create a guide for writing copy that provides rules that result in better CTR.

The Importance of Links

Google views links from other sites to yours as an indication of your level of authority. The more important the site linking to you, the more it impacts Google’s view. Having a larger number of sites linking to you can drive up your Domain Authority (a search engine ranking score) which in turn will benefit rankings across all keywords. However, it’s important to be restrained in acquiring links as those from “Black Hats” (sites Google regards as somewhat bogus) can actually result in getting penalized. While getting another site to link to you will typically require some motivation for them, Allison warns that paying cash for a link is likely to result in obtaining some of them from black hat sites. Instead, motivation can be your featuring an article from the other site, selling goods from a partner, etc.

Other Issues

I won’t review it here but site architecture is also a relevant factor in optimizing SEO benefits. For a product company with tens of thousands of products, it can be extremely important to have the right titles and structure in how you list products. If you have duplicative content on your site, removing it may help your rankings, even if there was a valid reason to have such duplication. Changing the wording of content on a regular basis will help you maintain rankings.

Summary

SEO requires a well-thought-out strategy and consistent, continued execution to produce results. This is not a short-term fix, as an SEO investment will likely only start to show improvements four to six months after implementation with ongoing management. But as many of our portfolio companies can attest, it’s well worth the effort.


SoundBytes

  • It’s a new basketball season so I can’t resist a few comments. First, as much as I am a fan of the Warriors, it’s pretty foolish to view them as a lock to win as winning is very tenuous. For example, in game 5 of the finals last year, had Durant missed his late game three point shot the Warriors may have been facing the threat of a repeat of the 2016 finals – going back to Cleveland for a potential tying game.
  • Now that Russell Westbrook has two star players to accompany him we can see if I am correct that he is less valuable than Curry, who has repeatedly shown the ability to elevate all teammates. This is why I believe that, despite his two MVPs, Curry is under-rated!
  • With Stitchfix filing for an IPO, we are seeing the first of several next generation fashion companies emerging. In the filing, I noted the emphasis they place on SEO as a key component of their success. I believe new fashion startups will continue to exert pressure on traditional players. One Azure company moving towards scale in this domain is Le Tote – keep an eye on them!

Will Grocery Shopping Ever be the Same?

Will grocery shopping ever be the same?

Dining and shopping today is very different than in days gone by – the Amazon acquisition of Whole Foods is a result

“I used to drink it,” said Andy Warhol once of Campbell’s soup. “I used to have the same lunch every day, for 20 years, I guess, the same thing over and over again.” In Warhol’s signature medium, silkscreen, the artist reproduced his daily Campbell’s soup can over and over again, changing only the label graphic on each one.

When I was growing up I didn’t have exactly the same thing over and over like Andy Warhol, but virtually every dinner was at home, at our kitchen table (we had no dining room in the 4-room apartment). Eating out was a rare treat and my father would have been abhorred if my mom brought in prepared food. My mom, like most women of that era, didn’t officially work, but did do the bookkeeping for my dad’s plumbing business. She would shop for food almost every day at a local grocery and wheel it home in her shopping cart.

When my wife and I were raising our kids, the kitchen remained the most important room in the house. While we tended to eat out many weekend nights, our Sunday through Thursday dinners were consumed at home, but were sprinkled with occasional meals brought in from the outside like pizza, fried chicken, ribs, and Chinese food. Now, given a high proportion of households where both parents work, eating out, fast foods and prepared foods have become a large proportion of how Americans consume dinner. This trend has reached the point where some say having a traditional kitchen may disappear as people may cease cooking at all.

In this post, I discuss the evolution of our eating habits, and how they will continue to change. Clearly, the changes that have already occurred in shopping for food and eating habits were motivations for Amazon’s acquisition of Whole Foods.

The Range of How We Dine

Dining can be broken into multiple categories and families usually participate in all of them. First, almost 60% of dinners eaten at home are still prepared there. While the percentage has diminished, it is still the largest of the 4 categories for dinners. Second, many meals are now purchased from a third party but still consumed at home. Given the rise of delivery services and greater availability of pre-cooked meals at groceries, the category spans virtually every type of food. Thirdly, many meals are purchased from a fast food chain (about 25% of Americans eat some type of fast food every day1) and about 20% of meals2 are eaten in a car. Finally, a smaller percentage of meals are consumed at a restaurant. (Sources: 1Schlosser, Eric. “Americans Are Obsessed with Fast Food: The Dark Side of the All-American Meal.” CBSNews. Accessed April 14, 2014 / 2Stanford University. “What’s for Dinner?” Multidisciplinary Teaching and Research at Stanford. Accessed April 14, 2014).

The shift to consuming food away from home has been a trend for the last 50 years as families began going from one worker to both spouses working. The proportion of spending on food consumed away from home has consistently increased from 1965-2014 – from 30% to 50%.

Source: Calculated by the Economic Research Service, USDA, from various data sets from the U.S. Census Bureau and the Bureau of Labor Statistics.

With both spouses working, the time available to prepare food was dramatically reduced. Yet, shopping in a supermarket remained largely the same except for more availability of prepared meals. Now, changes that have already begun could make eating dinner at home more convenient than eating out with a cost comparable to a fast food chain.

Why Shopping for Food Will Change Dramatically over the Next 30 Years

Eating at home can be divided between:

  1. Cooking from scratch using ingredients from general shopping
  2. Buying prepared foods from a grocery
  3. Cooking from scratch from recipes supplied with the associated ingredients (meal kits)
  4. Ordering meals that have previously been prepared and only need to be heated up
  5. Ordering meals from a restaurant that are picked up or delivered to your home
  6. Ordering “fast food” type meals like pizza, ribs, chicken, etc. for pickup or delivery.

I am starting with the assumption that many people will still want to cook some proportion of their dinners (I may be romanticizing given how I grew up and how my wife and I raised our family). But, as cooking for yourself becomes an even smaller percentage of dinners, shopping for food in the traditional way will prove inefficient. Why buy a package of saffron or thyme or a bag of onions, only to see very little of it consumed before it is no longer usable? And why start cooking a meal, after shopping at a grocery, only to find you are missing an ingredient of the recipe? Instead, why not shop by the meal instead of shopping for many items that may or may not end up being used.

Shopping by the meal is the essential value proposition offered by Blue Apron, Plated, Hello Fresh, Chef’d and others. Each sends you recipes and all the ingredients to prepare a meal. There is little food waste involved (although packaging is another story). If the meal preparation requires one onion, that is what is included, if it requires a pinch of saffron, then only a pinch is sent. When preparing one of these meals you never find yourself missing an ingredient. It takes a lot of the stress and the food waste out of the meal preparation process. But most such plans, in trying to keep the cost per meal to under $10, have very limited choices each week (all in a similar lower cost price range) and require committing to multiple meals per week. Chef’d, one of the exceptions to this, allows the user to choose individual meals or to purchase a weekly subscription. They also offer over 600 options to choose from while a service like Blue Apron asks the subscriber to select 3 out of 6 choices each week.

Blue Apron meals portioned perfectly for the amount required for the recipes

My second assumption is that the number of meals that are created from scratch in an average household will diminish each year (as it already has for the past 50 years). However, many people will want to have access to “preferred high quality” meals that can be warmed up and eaten, especially in two-worker households. This will be easier and faster (but perhaps less gratifying) than preparing a recipe provided by a food supplier (along with all the ingredients). I am talking about going beyond the pre-cooked items in your average grocery. There are currently sources of such meals arising as delivery services partner with restaurants to provide meals delivered to your doorstep. But this type of service tends to be relatively expensive on a per meal basis.

I expect new services to arise (we’ve already seen a few) that offer meals that are less expensive prepared by “home chefs” or caterers and ordered through a marketplace (this is category 4 in my list). The marketplace will recruit the chefs, supply them with packaging, take orders, deliver to the end customers, and collect the money. Since the food won’t be from a restaurant, with all the associated overhead, prices can be lower. Providing such a service will be a source of income for people who prefer to work at home. Like drivers for Uber and Lyft, there should be a large pool of available suppliers who want to work in this manner. It will be very important for the marketplaces offering such service to curate to ensure that the quality and food safety standards of the product are guaranteed. The availability of good quality, moderately priced prepared meals of one’s choice delivered to the home may begin shifting more consumption back to the home, or at a minimum, slow the shift towards eating dinners away from home.

Where will Amazon be in the Equation?

In the past, I predicted that Amazon would create physical stores, but their recent acquisition of Whole Foods goes far beyond anything I forecast by providing them with an immediate, vast network of physical grocery stores. It does make a lot of sense, as I expect omnichannel marketing to be the future of retail.  My reasoning is simple: on the one hand, online commerce will always be some minority of retail (it currently is hovering around 10% of total retail sales); on the other hand, physical retail will continue to lose share of the total market to online for years to come, and we’ll see little difference between e-commerce and physical commerce players.  To be competitive, major players will have to be both, and deliver a seamless experience to the consumer.

Acquiring Whole Foods can make Amazon the runaway leader in categories 1 and 2, buying ingredients and/or prepared foods to be delivered to your home.  Amazon Fresh already supplies many people with products that are sourced from grocery stores, whether they be general food ingredients or traditional prepared foods supplied by a grocery. They also have numerous meal kits that they offer, and we expect (and are already seeing indications) that Amazon will follow the Whole Foods acquisition by increasing its focus on “meal kits” as it attempts to dominate this rising category (3 in our table).

One could argue that Whole Foods is already a significant player in category 4 (ordering meals that are prepared, and only need to be heated up), believing that category 4 is the same as category 2 (buying prepared meals from a grocery). But it is not. What we envision in the future is the ability to have individuals (who will all be referred to as “Home Chefs” or something like that) create brands and cook foods of every genre, price, etc. Customers will be able to order a set of meals completely to their taste from a local home chef. The logical combatants to control this market will be players like Uber and Lyft, guys like Amazon and Google, existing recipe sites like Blue Apron…and new startups we’ve never heard of.

Lessons Learned from Anti-Consumer Practices/Technologies in Tech and eCommerce

One example of the anti-consumer practices by airline loyalty programs.

As more and more of our life consists of interacting with technology, it is easier and easier to have our time on an iPhone, computer or game device become all consuming. The good news is that it is so easy for each of us to interact with colleagues, friends and relatives; to shop from anywhere; to access transportation on demand; and to find information on just about anything anytime. The bad news is that anyone can interact with us: marketers can more easily bombard us, scammers can find new and better ways to defraud us, and identity thieves can access our financials and more. When friends email us or post something on Facebook, there is an expectation that we will respond.  This leads to one of the less obvious negatives: marketers and friends may not consider whether what they send is relevant to us and can make us inefficient.

In this post, I want to focus on lessons entrepreneurs can learn from products and technologies that many of us use regularly but that have glaring inefficiencies in their design, or those that employ business practices that are anti-consumer. One of the overriding themes is that companies should try to adjust to each consumer’s preferences rather than force customers to do unwanted things. Some of our examples may sound like minor quibbles but customers have such high expectations that even small offenses can result in lost customers.

Lesson 1: Getting email marketing right

Frequency of email 

The question: “How often should I be emailing existing and prospective customers?” has an easy answer. It is: “As often as they want you to.”  If you email them too frequently the recipients may be turned off. If you send too few, you may be leaving money on the table. Today’s email marketing is still in a rudimentary stage but there are many products that will automatically adjust the frequency of emails based on open rates. Every company should use these. I have several companies that send me too many emails and I have either opted out of receiving them or only open them on rare occasions. In either case the marketer has not optimized their sales opportunity.

Relevance of email

Given the amount of data that companies have on each of us one would think that emails would be highly personalized around a customer’s preferences and product applicability. One thing to realize is that part of product applicability is understanding frequency of purchase of certain products and not sending a marketing email too soon for a product that your customer would be unlikely to be ready to buy. One Azure portfolio company, Filter Easy, offers a service for providing air filters. Filter Easy gives each customer a recommended replacement time from the manufacturer of their air conditioner. They then let the customer decide replacement frequency and the company only attempts to sell units based on this time table. Because of this attention to detail, Filter Easy has one of the lowest customer churn rates of any B to C company. In contrast to this, I receive marketing emails from the company I purchase my running shoes from within a week of buying new ones even though they should know my replacement cycle is about every 6 months unless there is a good sale (where I may buy ahead). I rarely open their emails now, but would open more and be a candidate for other products from them if they sent me fewer emails and thought more about which of their products was most relevant to me given what I buy and my purchase frequency. Even the vaunted Amazon has sent me emails to purchase a new Kindle within a week or so of my buying one, when the replacement cycle of a Kindle is about 3 years.

In an idea world, each customer or potential customer would receive emails uniquely crafted for them. An offer to a customer would be ranked by likely value based on the customer profile and item profile. For example, customers who only buy when items are on sale should be profiled that way and only sent emails when there is a sale. Open Road, another Azure company, has created a daily email of deeply discounted e-books and gets a very high open rate due to the relevance of their emails (but cuts frequency for subscribers whose open rates start declining).

Lesson 2: Learning from Best Practices of Others

I find it surprising when a company launches a new version of a software application without attempting to incorporate best practices of existing products. Remember Lotus 123? They refused to create a Windows version of their spreadsheet for a few years and instead developed one for OS/2 despite seeing Excel’s considerable functionality and ease of use sparking rapid adoption. By the time they created a Windows version, it was too late and they eventually saw their market share erode from a dominant position to a minimal level.  In more modern times, Apple helped Blackberry survive well past it’s expected funeral by failing to incorporate many of Blackberry’s strong email features into the iPhone. Even today, after many updates to mail, Apple still is missing such simple features like being able to hit a “B” to go to the bottom of my email stack on the iPhone. Instead, one needs to scroll down through hundreds of emails to get to the bottom if you want to process older emails first. This wastes lots of time. But Microsoft Outlook in some ways is even worse as it has failed to incorporate lookup technology from Blackberry (and now from Apple) that always allows finding an email address from a person’s name. When one has not received a recent email from a person in your contact list, and the person’s email address is not their name, outlook requires an exact email address. When this happens, I wind up looking it the person’s contact information on my phone!

Best practices extends beyond software products to marketing, packaging, upselling and more. For example, every ecommerce company should study Apple packaging to understand how a best in class branding company packages its products. Companies also have learned that in many cases they need to replicate Amazon by providing free shipping.

Lesson 3: The Customer is Usually Right

Make sure customer loyalty programs are positive for customers but affordable for the company

With few exceptions, companies should adopt a philosophy that is very customer-centric. Failing to do so has negative consequences. For example, the airline industry has moved towards giving customers little consideration and this results in many customers no longer having a preferred airline, instead looking for best price and/or most convenient scheduling. Whereas the mileage programs from airlines were once a very attractive way of retaining customers, the value of miles has eroded to such a degree that travelers have lost much of the benefit. This may have been necessary for the airlines as the liability associated with outstanding points reached billions of dollars. But, in addition, airlines began using points as a profit center by selling miles to credit cards at 1.5 cents per mile. Then, to make this a profitable sale, moved average redemption value to what I estimate to be about 1 cent per point. This leads to a concern of mine for consumers. Airlines are selling points at Kiosks and online for 3 cents per point, in effect charging 3 times their cash redemption value.

The lesson here is that if you decide to initiate a loyalty points program, make sure the benefits to the customer increase retention, driving additional revenue. But also make sure that the cost of the program does not exceed the additional revenue. (This may not have been the case for airlines when their mileage points were worth 3-4 cents per mile).  It is important to recognize the future cost associated with loyalty points at the time they are given out (based on their exchange value) as this lowers the gross margin of the transaction. We know of a company that failed to understand that the value of points awarded for a transaction so severely reduced the associated gross margin that it was nearly impossible for them to be profitable.

Make sure that customer service is very customer centric

During the Thanksgiving weekend I was buying a gift online and found that Best Buy had what I was looking for on sale. I filled out all the information to purchase the item, but when I went to the last step in the process, my order didn’t seem to be confirmed. I repeated the process and again had the same experience. So, I waited a few days to try again, but by then the sale was no longer valid. My assistant engaged in a chat session with their customer service to try to get them to honor the sale price, and this was refused (we think she was dealing with a bot but we’re not positive). After multiple chats, she was told that I could try going to one of their physical stores to see if they had it on sale (extremely unlikely). Instead I went to Amazon and bought a similar product at full price and decided to never buy from Best Buy’s online store again. I know from experience that Amazon would not behave that way and Azure tries to make sure none of our portfolio companies would either. Turning down what would still have been a profitable transaction and in the process losing a customer is not a formula for success! While there may be some lost revenue in satisfying a reasonable customer request the long term consequence of failing to do so usually will far outweigh this cost.


Soundbytes

My friend, Adam Lashinsky, from Fortune has just reported that an insurance company is now offering lower rates for drivers of Teslas who deploy Autopilot driver-assistance. Recall that Tesla was one of our stock picks for 2017 and this only reinforces our belief that the stock will continue to outperform.


Next Gen Selling vs Old (or “Traditional”) Methods

In this post I want to compare the buying experiences I’ve had recently when purchasing from an older generation company vs a newer one. I think it highlights the fact that ecommerce based models can create a much better buying experience than traditional brick and mortar sellers when coupled with a multi-channel approach. The two companies I want to highlight are Tesla (where my wife recently purchased a car) and Warby Parker (where I recently bought a pair of glasses). I’ll compare them to Mercedes and LensCrafters but you should understand it almost doesn’t matter which older gen companies I compared them to, so just consider the ones I’ve chosen (due to recent personal experience) as representative of their industries.

Controlling the buying experience

Warby Parker began opening retail “Guideshops” a few years ago. I recently went into one and was very pleased with the experience. They displayed all the frames they have and there were only two price categories which included the prescription lenses and the frames, $95 and $145. I selected a frame, went over to the desk and received assistance in completing the transaction. The person assisting me took one measurement of my eyes and then suggested I get slightly better lenses for a charge of $30 which I think was only necessary due to my particular prescription. There were no other charges, no salesperson, no other upsells, no waiting while the glasses are being made. Once I paid by credit card, the glasses were put in their cue to be made at their factory and shipped to my home within 10 days (with no shipping charge) and my receipt was sent by email rather than printed. From the time I entered the store until I left was about 10 minutes.

Compare this experience to buying a pair of glasses at LensCrafters. At LensCrafters the price range of frames is all over the map without any apparent reason except many carry a designer brand logo (but are unlikely to have been designed by that designer). To me the Warby Parker frames are as good or better looking as far more expensive ones at LensCrafters.  Even if you select a frame at LensCrafters that costs $95-$300 or more, the lenses are not included. A salesperson then sits with you and begins the upselling process. Without going into all the details, suffice it to say that it is very difficult to discern what is really needed and therefore it is hard to walk out of the store without spending $100-$300 more than the cost of the frame. Further, since the glasses are made at the store you come back in a few hours to pick them up (of course this is a positive if you want them right away; I usually don’t care).  I have typically spent well over an hour in the buying process plus going for a coffee for the 2 hours or so it took for them to make the lenses.

Tesla has been very adamant about owning and controlling their physical retail outlets rather than having their cars sold by independent dealerships. This gives them multiple advantages as they completely control the buying experience, eliminate competition between dealers, reduce distribution cost and can decide what the purpose of each location is and how it should look. They have also eliminated having cars to sell on the lot but instead use an ecommerce model where you order a car exactly the way you want it and it gets produced for you and brought to the Tesla physical location you want for pickup. Essentially, they have designed two types of physical stores: one that has a few demo models to enable test drives and one that also has a customer service department. This means that the latter is a much smaller size than a traditional car dealership (as it doesn’t need space for new car inventory on the lot) and the former is much smaller than that. The showroom approach occupies such a small footprint that Tesla has been able to locate showrooms in high foot traffic (high cost per foot) locations like malls.  In their sites at the Stanford Mall and on Santana Row (two of the most expensive per square foot), Tesla kept the cars for test drives in the parking lots (at a fraction of the cost of store footage). When my wife decided to buy her second Tesla (trading in the older one) we spent about an hour at the dealer as there was no negotiation on price, the car could be configured to her exact specification on a screen at the dealership (or at home) and would be manufactured for her. There were no upsell attempts, no competing dealers to visit, and really no salesperson but rather a facilitator (much like at Warby Parker) that answered questions.

I bought my new car from Mercedes and had a much less pleasant buying experience. It starts with the fact that the price on the car isn’t the real price. This means that one needs to try to go to multiple dealers as well as online to get a better handle on what the real price is as the dealers are difficult to trust. Each dealer now has its own online person (or team) but this is actually still buying from a dealer. There is also a strong encouragement to buy a car in inventory (on the lot) and the idea of configuring the way one wants and ordering it is discouraged. The cars on the lot are frequently configured with costly (highly profitable) options that are unnecessary so that even with a discount from list one typically spends more than ordering it with only options you want and paying closer to list. After multiple days (and many, many hours) spent online and visiting dealerships I decided to replicate the Tesla concept and order a 2016 model to be built exactly how I wanted. Because I spent many hours shopping around, I still was able to get a price that was an extra $4,000 off list from what I had been offered if I bought a 2015 off the lot. The car was the color I wanted, only had the options I wanted and would have a higher resale value because of being a 2016. Since the list price had not increased and there were no unneeded options on the car I actually saved about $10,000 vs taking one off the lot with the lower discount even though all additional options I wanted were bundled with it.

Receiving the product

In the Warby Parker example, the glasses were shipped to my home in a very well designed box that enhanced their brand. The box contained an upscale case and a card that said: “For every pair of glasses sold, a pair is distributed to someone in need.” Buying at LensCrafters meant returning to the store for the glasses. The case included was a very cheap looking one (creating an upsell if one wanted a nicer case) and there was no packaging other than the case. However, I did get the glasses the same day and someone sat with me to make sure they fit well on my ears (fit was not an issue for me for the Warby Parker glasses but could be for some people).

On the automobile side, the car pickup at Tesla was a much better experience than the one at Mercedes. At Tesla, my wife and I spent a little over an hour at the pickup. We spent about 20 minutes on paperwork and 45 minutes getting a walk through on how various options on the car work. There were no attempts to upsell us on anything. At Mercedes the car pickup experience took nearly 4 hours and was very painful as over 3 hours of it was spent on paperwork and attempts at a variety of upsells. To be fair, we had decided to lease this car and that time occupied a portion of the paperwork. But the attempted upsells were extreme. The most ludicrous was trying to get us to buy an extended warranty when the included warranty exceeded the length of the lease. I could understand that it might be of value to some but, in our case, we told the lease person that we were only doing the lease so we wouldn’t own the car at the end of it. There were also upsells on various online services, and a number of other items. The time this took meant we did not have enough time left to go over all the features of the car. This process was clearly the way each person had been trained and was not a function of the particular people we dealt with. The actual salesperson who sold me the car was extremely nice but was working within a system that is not geared towards the customer experience as dealers can’t count on buyers returning even if they buy the same brand again.

Summary

There is a significant advantage being created by new models of doing business which control the complete distribution chain. Their physical locations have a much smaller footprint than traditional competitors which allow them to put their shops in high traffic locations without incurring commensurate cost. They consolidate inventory into a centralized location which reduces inventory cost, storage and obsolescence. They completely control the buying experience and understand that customer satisfaction leads to higher life time value of a customer.


SoundBytes

In my SoundByte post dated April 9, I discussed several of the metrics that caused me to conclude that Stephen Curry should be the 2014-15 season MVP. He subsequently received the award but it still appeared that many did not fully understand his value. I thought it was well captured in the post by looking at EFG, or effective shooting percentage (where a three point shot made counts as 1.5 two point shots made since its worth 50% more points), plus/minus and several other statistics not widely publicized. This year, Curry has become even better and I realized one other statistic might help highlight his value in an even better way, points created above the norm (PAN).

I define PAN as the extra points created versus an average NBA player through more effective shooting. It is calculated using this formula:

PAN= 2 x (the players average number of shots per game) x (players EFG- league norm EFG)

The league’s effective shooting percentage as of December 6 is 49.0%. Since Curry’s effective shooting percentage is 66.1% as of today date, the difference is 17.1%. Curry has been averaging 20.2 shots per game this year so his PAN = 2 x 20.2 x 17.1%= 6.9. This means Curry’s shooting alone (excluding foul shots) adds about 7 points per game to his team versus an average shooter. But, because Curry is unselfish and is often double teamed, he also contributes heavily to helping the team as a whole be more effective shooters. This leads to a team PAN of 14.0. Which means the Warriors score an extra 14 points a game due to more effective shooting.

Interestingly, when you compare this statistic to other league leaders and NBA stars, Curry’s contribution becomes even more remarkable. While Curry add about 7 points per game to his team versus an average shooter, James Harden, Dwayne Wade and Kobe Bryant are all contributing less than the average player. Given Curry’s wildly superior efficiency he is contributing almost twice as much as Kevin Durant.

Efficiency

With Curry’s far superior individual and team contribution to shooting efficiency, it is not surprising that the Warriors are outscoring their opponents by such record breaking margins.

To further emphasize how much Curry’s PAN impacts his team we compared him to Kobe Bryant. The difference in their PANs is 11.8 points per game. How much would it change the Lakers record if they had these extra 11.8 points per game and all else was equal? It would move the Lakers from the second worst point differential (only Philadelphia trails them) to 10th in the league and 4th among Western conference teams. Since point differential correlates closely to team record, that might mean the Lakers would be competing for home court in the playoffs instead of the worst record in the league!

OmniChannel Selling

The latest trend in retail is the concept of “OmniChannel” selling. While many players have been engaged in this arena for some time, there has been acceleration in the practice. Online retailers are now attempting to find ways to add an in-store experience and many brands, larger retailers, and numerous smaller ones have added more of a push towards e-tail. Additionally, direct sales through TV (QVC, Home Shopping, etc.), telemarketing and consumer-to-consumer fill out the spectrum of options.

The concept of selling through multiple and diverse channels is not a new concept, but the increased integration of in-store and e-tail channels is becoming more sophisticated. With 93% of consumer sales still occurring offline, many e-tailers understand that a physical presence can help escalate sales. Similarly, with this percentage shrinking and with $1.6 trillion in e-commerce sales expected this year, brick and mortar cannot ignore the importance of being online. Earlier this year, Square, in partnership with Bigcommerce, announced a new integration that provides merchants with a simple and seamless way to expand their businesses online. Similarly, Shopify’s POS system allows physical retailers to easily sell online.

US retail sales

E-Tailers Move to Physical Retail

This post focuses on the trend of e-tailers moving into physical retail and when and why it can work. E-tailers fall into three categories: those that only sell other company’s brands, those that are creating their own brand, and those that sell other brands as well as their own.

The dominant player in the first category is Amazon. ver time, it has built an overwhelming network of distribution centers geared towards efficiently shipping one or more items to an individual consumer. Now it has begun experimenting with physical locations, the first of which opened on the Purdue campus in February with additional locations being planned on other college campuses. There are also reports that it will follow this with other types of store openings. Given its widespread distribution centers, the company already has significant capability to inexpensively pick and pack goods for an individual consumer. But, despite limiting most shipments to one zone, there is still a relatively large cost to deliver a single order to an individual household. If it can begin getting non-Amazon Prime customers to come to a convenient location for pickup (Amazon locker or store), shipping cost could be reduced quite a bit. Further, having physical locations will undoubtedly add to the company’s sales and its brand. Since it would not need to stock the stores the way a traditional retailer does, it could capture the efficiency associated with centralized inventory locations combined with the brick-and-mortar efficiency of shipping a large number of goods to one location (probably in an Amazon-owned truck). I expect to see a major expansion of Amazon into physical locations over the next 5 years.

Trading High Shipping Cost for Brick and Mortar Cost

In e-commerce companies that we know well, fulfillment (picking and packing) and shipping can be as much as 40% or more of COGS.  Moving to one’s own physical retail stores adds substantial cost but removes shipping cost. Most e-tailers now offer some version of free shipping, but whether the seller or the customer pays for shipping, it is a major factor. What this means is that such an e-tailer can spend that money on its own stores or by offering to discount its products to a third-party brick and mortar reseller without necessarily incurring any loss in gross margin dollars (of course a larger discount may be required). Even if gross margins are lower when partnering with a third party brick and mortar retailer, it can still be as profitable as the e-tailer’s online sales since  brick and mortar stores already attract many customers whereas online sales normally require a marketing spend to create greater volume.

The OmniChannel Approach for Branded Product

Amazon is in a unique position because of its size. Although there are other e-tailers of third-party products with sufficient size to open their own physical locations, the bigger opportunity to increase sales resides with e-tailers that have their own branded product. A great example of this is Warby Parker, an emerging brand in eyewear. About 2 ½ years ago it opened its first brick and mortar store in New York City. What it found is that this not only added to its client base through in-store purchases, but also drove additional online sales. Why would this occur? Besides the obvious fact that many people still prefer buying from a physical location, trying on a pair of frames and having them fitted to your needs improves the experience. The inability to do this online may have inhibited some customers from purchasing. But once you have had the opportunity to have eyeglasses fitted to your requirements, it is much easier to buy subsequent pairs online with the knowledge that the fit should be appropriate.  The same issue of good fit applies to shoes and clothes.

Fit is one reason why Bonobos, an online e-tailer of men’s clothes, began opening shops.  But unlike Warby Parker, the Bonobos shops are “Guideshops” (where clothing can be tried on and then ordered for delivery). By taking this approach, Bonobos keeps inventory centralized and the stores much smaller (only requiring one unit of each SKU) but gains the benefit of addressing people less comfortable with shopping online and also insuring that the clothes fit. By locating the shops in malls and other high traffic areas, Bonobos gains exposure to a fair amount of foot traffic making the stores another customer acquisition vehicle. Note that the stores we expect Amazon to open are essentially Guideshops but on a much larger scale.

Online Brands Partnering with Brick and Mortar Retailers Will Continue to Increase

Bonobos has also partnered with Nordstrom but in its case it’s simply as another brand offered in Nordstrom stores.  In August, Warby Parker announced their first retail partnership with Nordstrom. Once Nordstrom saw the benefits of OmniChannel brands, it acquired Trunk Club (another men’s clothing e-tailer). Subsequent to the acquisition, it began adding space in some of its stores for men to come in, get fitted and talk to a stylist about preferences. The stylist then acts as a personal shopper and picks Trunk Club clothes for the customer to try. This results in a much larger average order than online sales for Trunk Club. In this case the customer takes the clothes with him. Again, once this occurs, buying subsequent items online becomes easier as there is more confidence that the fit will be good. Now Trunk Club is entering the women’s clothing market to compete with the successful online brand, Stitchfix.

Shoes are even more difficult to buy without trying on than eyeglasses or clothes. As a result, Shoes of Prey, which offers women the ability to design their own custom shoes, has also opened Guideshops but in their case they are in known retailers like Nordstrom. This makes sense to me as I prefer buying my first pair of shoes in a store and “refills” online. And now most brands that once were only available in brick and mortar stores can be purchased online. For the first pair I sometimes try on 8-10 styles/sizes before finding one that satisfies my needs (this is a major problem for Zappos who appears to have about a 35% return rate. If I try to buy a second pair a few months later from the same store, odds are they won’t have it. Instead, it’s seamless to go online for the follow-on pair. With the acquisition of Trunk Club, Nordstrom has taken a strong initiative in blending the online/offline experience.

Notice the difference between Warby Parker and Bonobos versus Trunk Club. Warby Parker and Bonobos, in addition to being another brand at third party retailers, opened their own branded stores whereas Trunk Club began expanding into an existing major retailer (albeit its new parent) as a service to customers. Opening your own stores can involve substantial capital expenditures and large ongoing operating cost. The alternative of getting one’s online branded product to be carried by a retailer reduces risk and saves substantial fixed cost. But, there’s a trade-off; the brand gives up margin as the third-party retailer will be buying at a discount. Merely getting into stores does not guarantee added success. In the store, the control of the purchase experience moves to the retailer so it becomes very important that the brand is comfortable with the way the retailer will position its products in terms of shelf space and point of purchase marketing through materials and/or sales people in the store. Julep, a successful online brand in the cosmetics space, has partly solved the issue of positioning by partnering with QVC as well as several brick and mortar retailers including Nordstrom. A strong advantage of a QVC partnership is that “shelf space” allocated to the brand consists of a brand spokesperson going on the TV show to market the brand to a very large audience. Resulting sales occur immediately through QVC but other channels also benefit.

Advantages to the Retailer of Carrying Online Brands in Their Physical Stores

An online brand should have substantial information regarding customer demand. It knows the geographies in which its products sell best, the demographics of its customers, which of its products will be in greater demand, etc. It also may have very substantial traffic to its site, to which it can offer the alternative of buying at physical retail. Furthermore, unlike physical retail, e-commerce retailers have a deeper understanding of customer acquisition metrics and customer conversion funnel, and can readily A/B test various elements on their site. Such insights can help a physical store decide which items to carry, volumes needed in different geographies and more.  It can also mean the online brand will drive additional customers to their store. A brand like Le Tote, one of Azure’s portfolio companies, which offers women a subscription that entitles them to rent everyday clothes, has even more data as an average customer will have worn over 50 of their clothing items over the course of a year. Since the company receives ongoing feedback on most of the items it ships, it has very substantial data on customer preferences regarding third party brands as well as house brands. The company believes that it is likely to form one or more partnerships with brick and mortar retailers to begin selling its “house” brands.

Intelligently Moving to OmniChannel Selling Makes Sense for Many Players

Given the growing synergism between online and offline retail, there is substantial opportunity for heightened growth for startups that are able to intelligently emerge from an e-tail only model to one that uses both online and brick and mortar distribution. If the e-tailer has its own branded goods, then this can be done through partnering with existing stores. In executing this strategy, it is important to ensure that the presentation and knowledge of the products placed in such stores are sufficient to enable customers of the store to adequately learn about the products. In turn, the e-tailer can provide a deeper understanding of the customer in order to accelerate growth and improve sales conversions in all channels. The abundance of data being provided from online channels as well as in-store tracking can provide significant insight to retailers, and startups that best capitalize on this information are better positioned for success.  Startups that are able to capitalize on this trend can experience a significant escalation in growth.

SoundBytes

  • The recent acquisition of EMC by Dell brought back memories of my thesis while still on Wall Street as a top analyst covering technology. In 1999 I predicted that successful PC companies would hit roadblocks to growth and profitability if they didn’t move “Beyond the Box”. As we’ve seen the prediction proved true as Apple thrived by doing so and others like Compaq, Dell, Gateway and HP ran into difficulty. I’m not as close to it now but the merger of these two companies seems to create obvious cross-selling opportunities and numerous efficiencies that should benefit the combined entity.