In working with early stage businesses, I often get the question as to what metrics should management and the board use to help understand a company’s progress. It is important for every company to establish a set of consistent KPIs that are used to objectively track progress. While these need to be a part of each board package, it is even more important for the executive team to utilize this for managing their company. While this post focuses on SaaS/Subscription companies, the majority of it applies to most other types of businesses.
Areas KPIs Should Cover
- P&L Trends
- MRR (Monthly Recurring Revenue) and LTR (Lifetime Revenue)
- CAC (Cost of Customer Acquisition)
- Marketing to create leads
- Customers acquired electronically
- Customers acquired using sales professionals
- Gross Margin and LTV (Life Time Value of a customer)
- Marketing Efficiency
Many companies will also need KPIs regarding inventory in addition to the ones above.
While there may be very complex analysis behind some of these numbers, it’s important to try to keep KPIs to 2-5 pages of a board package. Use of the right KPIs will give a solid, objective, consistent top-down view of the company’s progress. The P&L portion of the package is obviously critical, but I have a possibly unique view on how this should be included in the body of a board package.
P&L Trends: Less is More
One mistake many companies make is confusing detail with better analysis. I often see models that have 50-100 line items for expenses and show this by month for 3 or more years out… but show one or no years of history. What this does is waste a great deal of time on predicting things that are inconsequential and controllable (by month), while eliminating all perspective. Things like seasonality are lost if one is unable to view 3 years of revenue at a time without scrolling from page to page. Of course, for the current year’s budget it is appropriate for management to establish monthly expectations in detail, but for any long-term planning, success revolves around revenue, gross margins, marketing/sales spend and the number of employees. For some companies that are deep technology players there may be significant costs in R&D other than payroll, but this is the exception. By using a simple formula for G&A based on the number of employees, the board can apply a sanity check on whether cost estimates in the long-term model will be on target assuming revenue is on target. So why spend excessive time on nits? Aggregating cost frees up time for better understanding how and why revenue will ramp, the relationship between revenue types and gross margin, the cost of acquiring a customer, the lifetime value of a customer and the average spend per employee.
In a similar way, the board is well served by viewing a simple P&L by quarter for 2 prior years plus the current one (with a forecast of remaining quarters). The lines could be:
Table1: P&L by Quarter

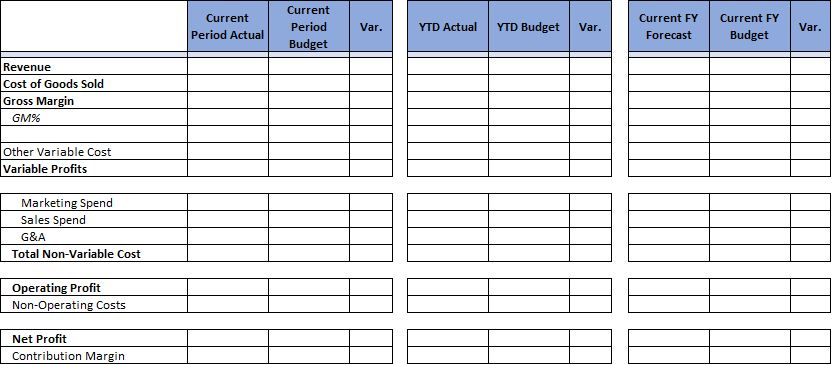
A second version of the P&L should be produced for budget comparison purposes. It should have the same rows but have the columns be current period actual, current period budget, year to date (YTD) actual, year to date budget, current full year forecast, budget for the full year.
Table 2: P&L Actual / Budget Comparison
Tracking MRR and LTR
For any SaaS/Subscription company (I’ll simply refer to this as SaaS going forward) MRR growth is the lifeblood of the company with two caveats: excessive churn makes MRR less valuable and excessive cost in growing MRR also leads to deceptive prosperity. More about that further on. MRR should be viewed on a rolling basis. It can be done by quarter for the board but by month for the management team. Doing it by quarter for the board enables seeing a 3-year trend on one page and gives the board sufficient perspective for oversight. Management needs to track this monthly to better manage the business. A relatively simple set of KPIs for each of 12 quarterly periods would be:
Table 3: MRR and Retention

Calculating Life Time Revenue through Cohort Analysis
The detailed method of calculating LTR does not need to be shown in every board package but should be included at least once per year, but calculated monthly for management.
The LTR calculation uses a grid where the columns would be the various Quarterly cohorts, that is all customers that first purchased that quarter (management might also do this using monthly instead of quarterly). This analysis can be applied to non-SaaS companies as well as SaaS entities. The first row would be the number of customers in the cohort. The next row would be the first month’s revenue for the cohort, the next the second months revenue, and so on until reaching 36 months (or whatever number the board prefers for B2B…I prefer 60 months). The next row would be the total for the full period and the final row would be the average Lifetime Revenue, LTR, per member of the cohort.
Table 4: Customer Lifetime Revenue

A second table would replicate the grid but show average per member of the cohort for each month (row). That table allows comparisons of cohorts to see if the average revenue of a newer cohort is getting better or worse than older ones for month 2 or month 6 or month 36, etc.
Table 5: Average Revenue per Cohort

Cohorts that have a full 36 months of data need to be at least 36 months old. What this means is that more recent cohorts will not have a full set of information but still can be used to see what trends have occurred. For example, is the second months average revenue for a current cohort much less than it was for a cohort one year ago? While newer cohorts do not have full sets of monthly revenue data, they still are very relevant in calculating more recent LTR. This can be done by using average monthly declines in sequential months and applying them to cohorts with fewer months of data.
Customer Acquisition Cost (CAC)
Calculating CAC is done in a variety of ways and is quite different for customers acquired electronically versus those obtained by a sales force. Many companies I’ve seen have a combination of the two.
Marketing used to generate leads should always be considered part of CAC. The marketing cost in a month first is divided by the number of leads to generate a cost/lead. The next step is to estimate the conversion rate of leads to customers. A simple table would be as follows:
Table 6: Customer Acquisition Costs

For an eCommerce company, the additional cost to convert might be one free month of product or a heavily subsidized price for the first month. If the customer is getting the item before becoming a regular paying customer than the CAC would be:
CAC = MCTC / the percent that converts from the promotional trial to a paying customer.
CAC when a Sales Force is Involved
For many eCommerce companies and B2B companies that sell electronically, marketing is the primary cost involved in acquiring a paying customer. For those utilizing a sales force, the marketing expense plus the sales expense must be accumulated to determine CAC.
Typically, what this means is steps 1 through 3 above would still be used to determine CPL, but step 1 above might include marketing personnel used to generate leads plus external marketing spend:
- CPL (cost per lead) as above
- Sales Cost = current month’s cost of the sales force including T&E
- New Customers in the month = NC
- Conversion Rate to Customer = NC/number of leads= Y%
- CAC = CPL/Y% + (Sales Cost)/NC
There are many nuances ignored in the simple method shown. For example, some leads may take many months to close. Some may go through a pilot before closing. Therefore, there are more sophisticated methods of calculating CAC but using this method would begin the process of understanding an important indicator of efficiency of customer acquisition.
Gross Margin (GM) is a Critical Part of the Equation
While revenue is obviously an important measure of success, not all revenue is the same. Revenue that generates 90% gross margin is a lot more valuable per dollar than revenue that generates 15% gross margin. When measuring a company’s potential for future success it’s important to understand what level of revenue is required to reach profitability. A first step is understanding how gross margin may evolve. When a business scales there are many opportunities to improve margins:
- Larger volumes may lead to larger discounts from suppliers
- Larger volumes for products that are software/content may lower the hosting cost as a percent of revenue
- Shipping to a larger number of customers may allow opening additional distribution centers (DCs) to facilitate serving customers from a DC closer to their location lowering shipping cost
- Larger volumes may mean improved efficiency in the warehouse. For example, it may make more automation cost effective
When forecasting gross margin, it is important to be cautious in predicting some of these savings. The board should question radical changes in GM in the forecast. Certain efficiencies should be seen in a quarterly trend, and a marked improvement from the trend needs to be justified. The more significant jump in GM from a second DC can be calculated by looking at the change in shipping rates for customers that will be serviced from the new DC vs what rates are for these customers from the existing one.
Calculating LTV (Lifetime Value)
Gross Margin, by itself may be off as a measure of variable profits of a customer. If payment is by credit card, then the credit card cost per customer is part of variable costs. Some companies do not include shipping charges as part of cost of goods, but they should always be part of variable cost. Customer service cost is typically another cost that rises in proportion to the number of customers. So:
Variable cost = Cost of Goods sold plus any cost that varies directly with sales
Variable Profit = Revenue – Variable Cost
Variable Profit% (VP%) = (Variable Profit)/Revenue
LTV = LTR x VP%
The calculation of VP% should be based on current numbers as they will apply going forward. Determining a company’s marketing efficiency requires comparing LTV to the cost of customer acquisition. As mentioned earlier in the post, if the CAC is too large a proportion of LTV, a company may be showing deceptive (profitless) growth. So, the next set of KPIs address marketing efficiency.
Marketing Efficiency
It does not make sense to invest in an inefficient company as they will burn through capital at a rapid rate and will find it difficult to become profitable. A key measure of efficiency is the relationship between LTV and CAC or LTV/CAC. Essentially this is how many dollars of variable profit the company will make for every dollar it spends on marketing and sales. A ratio of 5 or more usually means the company is efficient. The period used for calculating LTR will influence this number. Since churn tends to be much lower for B2B companies, 5 years is often used to calculate LTR and LTV. But, using 5 years means waiting longer to receive resulting profits and can obscure cash flow implications of slower recovery of CAC. So, a second metric important to understand burn is how long it takes to recover CAC:
CAC Recovery Time = number of months until variable profit equals the CAC
The longer the CAC recovery time, the more capital required to finance growth. Of course, existing customers are also contributing to the month’s revenue alongside new customers. So, another interesting KPI is contribution margin which measures the current state of balance between marketing/sales and Variable Profits:
Contribution Margin = Variable Profits – Sales and Marketing Cost
Early on this number will be negative as there aren’t enough older customers to cover the investment in new ones. But eventually the contribution margin in a month needs to turn positive. To reach profitability it needs to exceed all other costs of the business (G&A, R&D, etc.). By reducing a month’s marketing cost, a company can improve contribution margin that month at the expense of sequential growth… which is why this is a balancing act.
I realize this post is long but wanted to include a substantial portion of KPIs in one post. However, I’ll leave more detailed measurement of sales force productivity and deeper analysis of several of the KPIs discussed here for one or more future posts.
Soundbytes
I’ll begin by apologizing for a midyear brag, but I always tell others to enjoy success and therefore am about to do that myself. In my top ten predictions for 2018 I included a market prediction and 4 stock predictions. I was feeling pretty good that they were all working well when I started to create this post. However, the stock prices for high growth stocks can experience serious shifts in very short periods. Facebook and Tesla both had (what I consider) minor shortfalls against expectations in the 10 days since and have subsequently declined quite a bit in that period. But given the strength of my other two recommendations, Amazon and Stitchfix, the four still have an average gain of 15% as of July 27. Since I’ve only felt comfortable predicting the market when it was easy (after 9/11 and after the 2008 mortgage blowup), I was nervous about predicting the S&P would be up this year as it was a closer call and was somewhat controversial given the length of the bull market prior to this year. But it seemed obvious that the new tax law would be very positive for corporate earnings. So, I thought the S&P would be up despite the likelihood of rising interest rates. So far, it is ahead 4.4% year to date driven by stronger earnings. Since I always fear that my record of annual wins can’t continue I wanted to take a midyear victory lap just in case everything collapses in the second half of the year (which I don’t expect but always fear). So I continue to hold all 4 stocks and in fact bought a bit more Facebook today.
