Calculating and Acting on the Right KPIs is Critical for Success

Advanced metrics for Customer Acquisition Cost (CAC) and Lifetime Value (LTV)

What is the purpose of CAC, LTV and Payback Period?

Often entrepreneurs we meet have a list of their KPI’s, but as we dig deeper, it becomes clear that they don’t fully comprehend the purpose of the KPI or why we think that they are so critical in helping us understand the health of a business. I’m a believer in thoroughly understanding the economics of your business, and the metrics around Customer Acquisition Cost (CAC), Customer Lifetime Revenue (LTR), Customer Lifetime Value (LTV) and Payback Period are important metrics to work on improving. In this post we use the word customer to mean a ‘buyer’, someone who actually orders product and will use customer and buyer interchangeably.

  • LTR (Customer Lifetime Revenue) is the total revenue from a customer over their estimated lifetime (we prefer using 5 years as representing lifetime)
  • MCA (Marketing Spend for Customer Acquisition) is the marketing cost directed towards new customer acquisition
  • CAC (Customer Acquisition Cost) captures the cost of acquiring a new buyer
  • LTV (Customer Lifetime Value) is the estimated lifetime profits on new customers once they have been acquired
  • Net LTV is the estimated lifetime profits on a new customer taking acquisition cost into account or: LTV – CAC
  • Payback Period is the time for a new customer to generate profits that equals his or her CAC

When LTV is compared to CAC a measure of the future health of the business can be seen. Most VCs will be loath to invest in any company where the ratio of LTV/CAC is less than 3X and enthusiastic when it exceeds 5X. I also favor companies with a short payback period especially if the recovery is from the first transaction as this means almost no cash is consumed when acquiring a customer.

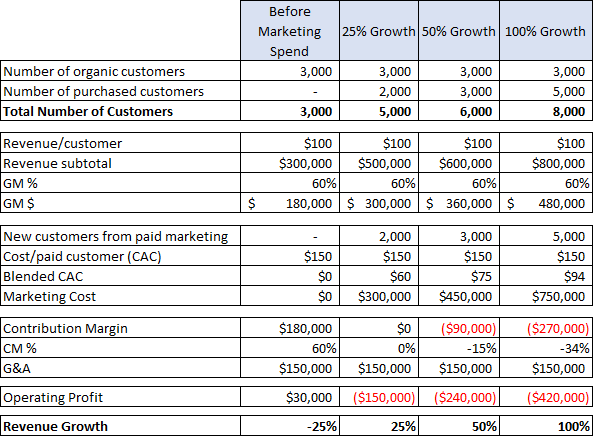
I have previously written about Contribution Margin (gross margin less marketing and sales spend) being one of the most important metrics for companies as it tells me how scaling revenue will help cover G&A and R&D costs. Once Contribution Margin exceeds these costs there is operating profit. A company with low Contribution Margin needs much greater scale to be able to reach profitability than one with high Contribution Margin. Both the LTV/CAC ratio and Payback Period are important predictors of future Contribution Margin levels. Table 1 shows two companies with the same revenue, R&D and G&A cost. Assuming R&D and G&A are fixed for both, at 5% Contribution Margin Company A would need to reach $50 million in revenue to break-even while Company B would be at break-even at under $4 million in revenue given its 65% Contribution Margin.

Break Even Revenue = (R&D + G&A)/ (Contribution Margin %)

For Company A = $2,500,000/ (5%) = $50,000,000

For Company B = $2,500,000/ (65%) = $3,846,154

The problem for Company A stems from the fact that for every $40 spent in acquiring a customer the total LTV (or subsequent profits on the customer) is only $76 making Net LTV $36. With such a low ratio of LTV/CAC, Contribution Margin is also quite low. I’ve chosen two extremes in gross margin to better illustrate the impact of gross margin on Contribution Margin. 

Table 1: Illustrative Example on the Importance of Contribution Margin

In a second example, Table 2, we show the impact of much more efficient marketing and remarketing on a company’s results. We assume gross margin, R&D and G&A are the same for Company C and Company D, but that Company D is much more efficient at acquiring and retaining customers, resulting in a lower CAC and a higher LTR and LTV for Company D. This could be due to higher spending on branding and remarketing, but also because they are very focused on the metrics that help them optimize acquisition and LTR. The result is considerably higher LTV/CAC and significantly higher Contribution Margin. 

Table 2: Impact of Efficient Marketing & Remarketing on a Company’s Results

A few rules regarding Contribution Margin

  1. Higher Gross Margin means greater opportunity for high Contribution Margin – for example, Company A at 20% Gross Margin is severely limited in reaching a reasonable Contribution Margin while Company B at 80% Gross Margin has an opportunity for high Contribution Margin and can reach profitability at lower revenue levels
  2. Companies with many new customers acquired through “free” methods like SEO, viral marketing, etc. have higher Contribution Margins than similar companies with a low proportion of free acquisitions.  Notice Company D can spend less on marketing than Company C because it acquires half of its customers from free sources whereas Company C has none from free sources.
  3. Returning buyers contribute heavily to Contribution Margin since they require little if any marketing cost. A high LTV/CAC ratio usually means customers return more often, which in turn should increase future Contribution Margin. Company D with its very high LTV/CAC likely has much lower churn than Company C and therefore most of its marketing spend is for adding incremental customers rather than just replacing those that churn. If a company simply stopped spending on marketing, its revenue would be from existing customers and new customers acquired from free methods making Contribution Margin roughly equal to Gross Margin. Of course, lack of marketing could have a major impact on future growth
  4. All other things being equal, companies with short Payback Periods tend to have higher Contribution Margin than those with longer Payback Periods

Marketing Spend on Branding versus Customer Acquisition

Branding is the communication of characteristics, values and attributes of an organization and its products. What is the purpose of spending on branding?  To create a strong image of the company and its products so that existing customers want to stay and spending on customer acquisition will be more efficient. Great brands should have a lower CAC and higher LTV than weak brands.

Nike’s “Just Do It” campaign worked well in establishing a brand message that resonated. Their more recent campaign centered around Colin Kaepernick was riskier as it had pictures of the quarterback and the slogan: “Believe in something even if it means sacrificing everything”. While Kaepernick is controversial, he appeals to a large part of the Nike existing and potential buying audience. The campaign helped lift sales by 27% in the first 4 days following the ad launch. Karen McFarlane, founder Kaye Media Partners summed up Nike’s strategy: “Nike’s mission is to bring inspiration and innovation to every athlete in the world. Colin Kaepernick, through his advocacy, conviction, and talent on and off the field, exemplifies those values in the strongest of terms. Couple that with Nike’s commitment to diversity and community, particularly against the backdrop of today’s America where politics have amplified cultural divisions, Nike took the opportunity to lean into their mission and values.”

Marketing campaigns that are for direct customer acquisition differ from branding campaigns as their goal is to directly acquire customers. It is not always clear whether marketing dollars should be classified as acquisition or branding. The key point is that branding is building for the future, whereas acquisition campaigns are measured by how efficiently they deliver current customers. This brings us back to measuring CAC, as the question becomes whether branding campaigns are part of the calculation of CAC. I believe they are not, as CAC should represent the direct cost of acquiring a customer so that increasing that spend will allow us to estimate how many more customers will result. So, I conclude that marketing for branding should be excluded from the calculation of CAC but can be an important strategy to improve efficiency in acquiring customers and maximizing their value. It should be part of the Contribution Margin calculation.

Paid CAC vs Blended CAC

If CAC represents what it costs to acquire a customer, what about those customers that are acquired through SEO, viral marketing, or some other free method? If one simply divides the spend on Marketing for Customer Acquisition (or MCA) by the total number of new customers, the result will be deceptive if it is used to estimate how many more customers will be acquired if MCA spend is increased. Instead companies should calculate CAC in two ways:

Blended CAC = MCA/ (total number of new customers)

Acquisition CAC = MCA/ (number of new customers generated from acquisition marketing only)

Attribution Models and how they help understand CAC by Channel

CAC helps predict the impact of different levels of spending on marketing. Companies also need to know where spending has the best impact, and therefore need to calculate a CAC (and LTV) for each channel of marketing. If a company uses multiple channels like Facebook, Google, and Snap they need to assign credit to each channel for the customers generated from that channel as compared to the spend for that channel to determine the channel CAC. The most simplistic way of doing this is to say, for example, that Google advertising gets credit for the customer if the purchase by the customer occurs after clicking to the site from Google. But what if a consumer sees a Facebook ad, goes to the site to look at products, then a week later comes back to the site from a Snap ad, and then visits the site again because the company sent them an email that they click on, and finally buys something after clicking on a Google ad?  Should Google get the entire credit for the customer?

Attribution models from companies like Amplitude and Hive attempt to appropriately credit each channel touchpoint for the role it played in acquiring a customer. For example, a company might assign 50% of the credit to the last touchpoint and divide the other 50% equally among prior touchpoints or use some other formula that is believed to capture how each channel participated in driving that consumer towards a purchase. Attribution models attempt to help companies understand how scaling spend in each channel will impact customer acquisition. For example:

Google CAC = (Google marketing spend)/ (number of customers attributed to Google ads)

One question that arises when using attribution models to credit each channel is whether “free” areas should share the credit when both paid and free touchpoints occur before converting a consumer into a buyer. The issue is whether the free touchpoints would have occurred had the company not spent on paid marketing. In my prior example the customer would never have received an email from the company had they not first seen the Facebook and Snap ads so eliminating these ads would also eliminate the email which in turn probably means they never would have become a customer. In a similar way, someone who clicked on a Google ad but did not buy, might later do a search for the product, and go to the site from SEO and then buy. So, one method of assigning attribution would be to divide the entire attribution among paid channels if a consumer touched both paid and free ones before becoming a customer. If the consumer only went to free channels, then they would count in blended CAC but not as a customer in calculating paid CAC or CAC by paid channel.

Where does Marketing to an existing customer fit in?

CAC is meant to measure new customer acquisition. So, marketing to an existing customer to get them to buy more should not be part of CAC but rather should be subtracted from MCA. I view it as a cost that reduces Lifetime Value (LTV). Many startups ignore the possibility of “reactivating” churned customers through marketing spend. Several Azure portfolio companies have seen success in deploying a reactivation strategy. I consider this spend as marketing to an existing customer and resulting profits an increase in LTV. Revising the definition of LTV (see Table 1):

LTV = LTR – COGS – Marketing Costs to existing customers

MCA (Marketing Cost for Customer Acquisition) = Marketing Costs – branding costs – marketing to existing customers

In Table 1, remarketing expense is 1% of Lifetime revenue for both Company A and Company B or:

Company A LTV = (GM% – remarketing%) X LTR = (20% – 1%) X $400 = $76

Company B LTV = (80%– 1%) X $400 = $316

What about new customers that return the product?

This is a thorny issue. If a consumer buys their first product from a company and then returns it, is she a customer? I think it would not be wrong with interpreting this either way. But I prefer considering her a customer as she was a buyer, and while the return zeros out the revenue from that purchase, she did become a customer. There is ample opportunity for marketing to her again. Considering her a customer lowers CAC as there are more customers for the spend, but it also lowers LTV for the same reason. So, if the interpretation is applied consistently over both CAC and LTV, I believe it would be correct.

More mature companies should apply the methods shown here to better understand their business

By better understanding acquisition CAC and LTV of each channel of customer acquisition a company can direct more spending to the most efficient ones (those with the highest LTV/CAC). By experimenting with “reactivation” spending a company can determine if this improves LTV/CAC. Companies that improve LTV/CAC will likely generate higher Contribution Margin. Those that increase the proportion of customers acquired for “free” can also improve Contribution Margin. Improving CAC and LTV can be accomplished in several ways as described in prior posts:

Optimizing the cost of customer acquisition modeling metrics to drive startup success (March 2014)

How to improve Contribution Margin (Nov 2018)

Without proper metrics a company is essentially flying blind and will be far less likely to succeed. This post provides a blueprint towards a more sophisticated approach to understanding any business.

Why Contribution Margin is a Strong Predictor of Success for Companies

In the last post I concluded with a brief discussion of Contribution Margin as a key KPI. Recall:

Contribution Margin = Variable Profits – Sales and Marketing Cost

The higher the contribution margin, the more dollars available towards covering G&A. Once contribution margin exceeds G&A, a company reaches operating profits. For simplicity in this post, I’ll use gross margin (GM) as the definition of variable profits even though there may be other costs that vary directly with revenue.

The Drivers of Contribution Margin (CM)

There is an absolute correlation between GM percent and CM. Very high gross margin companies will, in general, get to strong contribution margins and low gross margin companies will struggle to get there. But the sales and marketing needed to drive growth is just as important. There are several underlying factors in how much needs to be spent on sales and marketing to drive growth:

  1. The profits on a new customer relative to the cost of acquiring her (or him). That is, the CAC (customer acquisition cost) for customers derived from paid advertising compared to the profits on those customers’ first purchase
  2. The portion of new traffic that is “free” from SEO (search engine optimization), PR, existing customers recommending your products, etc.
  3. The portion of revenue that comes from repeat customers

The Relationship Between CAC and First Purchase Profits Has a Dramatic Impact on CM

Suppose Company A spends $60 to acquire a customer and has GM of $90 on the initial purchase by that customer. The contribution margin will already be positive $30 without accounting for customers that are organic or those that are repeat customers; in other words, this tends to be extremely positive! Of course, the startups I see in eCommerce are rarely in this situation but those that are can get to profitability fairly quickly if this relationship holds as they scale.

It would be more typical for companies to find that the initial purchase GM only covers a portion of CAC but that subsequent purchases lead to a positive relationship between the LTV (life time value) of the customer and CAC. If I assume the spend to acquire a customer is $60 and the GM is $30 then the CM on the first purchase would be negative (-$30), and it would take a second purchase with the same GM dollars to cover that initial cost. Most startups require several purchases before recovering CAC which in turn means requiring investment dollars to cover the outlay.

Free Traffic and Contribution Margin

If a company can generate a high proportion of free/organic traffic, there is a benefit to contribution margin. CAC is defined as the marketing spend divided by the number of new customers derived from this spend. Blended CAC is defined as the marketing spend divided by all customers who purchased in the period. The more organically generated and return customers, the lower the “blended CAC”. Using the above example, suppose 50% of the new customers for Company A come from organic (free) traffic. Then the “blended CAC“ would be 50% of the paid CAC. In the above example that would be $30 instead of $60 and if the GM was only $30 the initial purchase would cover blended CAC.

Of course, in addition to obtaining customers for free from organic traffic, companies, as they build their customer base, have an increasing opportunity to obtain free traffic by getting existing customers to buy again. So, a company should never forget that maintaining a persistent relationship with customers leads to improved Contribution Margin.

Spending to Drive Higher Growth Can Mean Lower Contribution Margin

Unless the GM on the first purchase a new customer makes exceeds their CAC, there is an inverse relationship between expanding growth and achieving high contribution margin. Think of it this way: suppose that going into a month the likely organic traffic and repeat buyers are somewhat set. Boosting that month’s growth means increasing the number of new paid customers, which in turn makes paid customers a higher proportion of blended CAC and therefore increases CAC. For an example consider the following assumptions for Company B:

  • The GM is $60 on an average order of $100
  • Paid CAC is $150
  • The company will have 1,000 new customers through organic means and 2,000 repeat buyers or $300,000 in revenue with 60% GM ($180,000) from these customers before spending on paid customers
  • G&A besides marketing for the month will be $150,000
  • Last year Company B had $400,000 in revenue in the same month
  • The company is considering the ramifications of targeting 25%, 50% or 100% year-over-year growth

Table 1: The Relationship Between Contribution Margin & Growth

Since the paid CAC is $150 while Gross Margin is only $60 per new customer, each acquired customer generates negative $90 in contribution margin in the period. As can be seen in Table 1, the company would shrink 25% if there is no acquisition spend but would have $180,000 in contribution margin and positive operating profit. On the other end of the spectrum, driving 100% growth requires spending $750,000 to acquire 5,000 new customers and results in a negative $270,000 in contribution margin and an Operating Loss of $420,000 in the period. Of course, if new customers are expected to make multiple future purchases than the number of repeat customers would rise in future periods.

Subscription Models Create More Consistency but are not a Panacea

When a company’s customers are monthly subscribers, each month starts with the prior month’s base less churn. To put it another way, if churn from the prior month is modest (for example 5%) then that month already has 95% of the prior months revenue from repeat customers. Additionally, if the company increases the average invoice value from these customers, it might even have a starting point where return customers account for as much revenue as the prior month. For B-to-B companies, high revenue retention is the norm, where an average customer will pay them for 10 years or more.

Consumer ecommerce subscriptions typically have much more substantial churn, with an average life of two years being closer to the norm. Additionally, the highest level of churn (which can be as much as 30% or more) occurs in the second month, and the next highest, the third month before tapering off. What this means is that companies trying to drive high sequential growth will have a higher % churn rate than those that target more modest growth. Part of a company’s acquisition spend is needed just to stay even. For example, if we assume all new customers come from paid acquisition, the CAC is $200, and that 15% of 10,000 customers churn then the first $300,000 in marketing spend would just serve to replace the churned customers and additional spend would be needed to drive sequential growth.

Investing in Companies with High Contribution Margin

As a VC, I tend to appreciate strong business models and like to invest after some baseline proof points are in place.  In my last post I outlined a number of metrics that were important ways to track a company’s health with the ratio of LTV (life time value) to CAC being one of the most important. When a company has a high contribution margin they have the time to build that ratio by adding more products or establishing subscriptions without burning through a lot of capital. Further, companies that have a high LTV/CAC ratio should have a high contribution margin as they mature since this usually means customers buy many times – leading to an expansion in repeat business as part of each month’s total revenue.

This thought process also applies to public companies. One of the most extreme is Facebook, which I’ve owned and recommended for five years. Even after the recent pullback its stock price is about 7x what it was five years ago (or has appreciated at a compound rate of nearly 50% per year since I’ve been recommending it). Not a surprise as Facebook’s contribution margin runs over 70% and revenue was up year/year 42% in Q2. These are extraordinary numbers for a company its size.

To give the reader some idea of how this method can be used as one screen for public companies, Table 2 shows gross margin, contribution margin, revenue growth and this year’s stock market performance for seven public companies.

Table 2: Public Company Contribution Margin Analysis

Two of the seven companies shown stand out as having both high Contribution Margin and strong revenue growth: Etsy and Stitch Fix. Each had year/year revenue growth of around 30% in Q2 coupled with 44% and 29% contribution margins, respectively. This likely has been a factor in Stitch Fix stock appreciating 53% and Etsy 135% since the beginning of the year.

Three of the seven have weak models and are struggling to balance revenue growth and contribution margin: Blue Apron, Overstock, and Groupon. Both Blue Apron and Groupon have been attempting to reduce their losses by dropping their marketing spend. While this increased their CM by 10% and 20% respectively, it also meant that they both have negative growth while still losing money. The losses for Blue Apron were over 16% of revenue. This coupled with shrinking revenue feels like a lethal combination. Blue Apron stock is only down a marginal amount year-to-date but is 59% lower than one year ago. Groupon, because of much higher gross margins than Blue Apron (52% vs 35%), still seems to have a chance to turn things around, but does have a lot of work to do. Overstock went in the other direction, increasing marketing spend to drive modest revenue growth of 12%. But this led to a negative CM and substantially increased losses. That strategy did not seem to benefit shareholders as the stock has declined 53% since the beginning of the year.

eBay is a healthy company from a contribution margin point of view but has sub 10% revenue growth. I can’t tell if increasing their market spend by a substantial amount (at the cost of lower CM) would be a better balance for them.

For me, Spotify is the one anomaly in the table as its stock has appreciated 46% since the IPO despite weak contribution margins which was one reason for my negative view expressed in a prior post. I think that is driven by three reasons: its product is an iconic brand; there is not a lot of float in the stock creating some scarcity; and contribution margin has been improving giving bulls on the stock a belief that it can get to profitability eventually. I say it is an anomaly, as comparing it to Facebook, it is hard to justify the relative valuations. Facebook grew 42% in Q2, Spotify 26%; Facebook is trading at a P/E of 24 whereas even if we assume Spotify can eventually get to generating 6% net profit (it currently is at a 7% loss before finance charges and 31% loss after finance charges, so this feels optimistic) Spotify would be trading at 112 times this theoretic future earnings.


SoundBytes

I found the recent controversy over Elon Musk’s sharing his thoughts on taking Tesla private interesting. On the one hand, people want transparency from companies and Elon certainly provides that! On the other hand, it clearly impacted the stock price for a few days and the SEC abhors anything that can be construed as stock manipulation. Of course, Elon may not have been as careful as he should have been when he sent out his tweet regarding whether financing was lined up…but like most entrepreneurs he was optimistic.

Interesting KPIs (Key Performance Indicators) for a Subscription Company

what-are-key-performance-indicators-kpis

In working with early stage businesses, I often get the question as to what metrics should management and the board use to help understand a company’s progress. It is important for every company to establish a set of consistent KPIs that are used to objectively track progress. While these need to be a part of each board package, it is even more important for the executive team to utilize this for managing their company. While this post focuses on SaaS/Subscription companies, the majority of it applies to most other types of businesses.

Areas KPIs Should Cover

  1. P&L Trends
  2. MRR (Monthly Recurring Revenue) and LTR (Lifetime Revenue)
  3. CAC (Cost of Customer Acquisition)
    1. Marketing to create leads
    2. Customers acquired electronically
    3. Customers acquired using sales professionals
  4. Gross Margin and LTV (Life Time Value of a customer)
  5. Marketing Efficiency

Many companies will also need KPIs regarding inventory in addition to the ones above.

While there may be very complex analysis behind some of these numbers, it’s important to try to keep KPIs to 2-5 pages of a board package. Use of the right KPIs will give a solid, objective, consistent top-down view of the company’s progress. The P&L portion of the package is obviously critical, but I have a possibly unique view on how this should be included in the body of a board package.

P&L Trends: Less is More

One mistake many companies make is confusing detail with better analysis. I often see models that have 50-100 line items for expenses and show this by month for 3 or more years out… but show one or no years of history. What this does is waste a great deal of time on predicting things that are inconsequential and controllable (by month), while eliminating all perspective. Things like seasonality are lost if one is unable to view 3 years of revenue at a time without scrolling from page to page. Of course, for the current year’s budget it is appropriate for management to establish monthly expectations in detail, but for any long-term planning, success revolves around revenue, gross margins, marketing/sales spend and the number of employees. For some companies that are deep technology players there may be significant costs in R&D other than payroll, but this is the exception. By using a simple formula for G&A based on the number of employees, the board can apply a sanity check on whether cost estimates in the long-term model will be on target assuming revenue is on target. So why spend excessive time on nits? Aggregating cost frees up time for better understanding how and why revenue will ramp, the relationship between revenue types and gross margin, the cost of acquiring a customer, the lifetime value of a customer and the average spend per employee.

In a similar way, the board is well served by viewing a simple P&L by quarter for 2 prior years plus the current one (with a forecast of remaining quarters). The lines could be:

Table1: P&L by Quarter

A second version of the P&L should be produced for budget comparison purposes. It should have the same rows but have the columns be current period actual, current period budget, year to date (YTD) actual, year to date budget, current full year forecast, budget for the full year.

Table 2: P&L Actual / Budget Comparison

Tracking MRR and LTR

For any SaaS/Subscription company (I’ll simply refer to this as SaaS going forward) MRR growth is the lifeblood of the company with two caveats: excessive churn makes MRR less valuable and excessive cost in growing MRR also leads to deceptive prosperity. More about that further on. MRR should be viewed on a rolling basis. It can be done by quarter for the board but by month for the management team. Doing it by quarter for the board enables seeing a 3-year trend on one page and gives the board sufficient perspective for oversight. Management needs to track this monthly to better manage the business. A relatively simple set of KPIs for each of 12 quarterly periods would be:

Table 3: MRR and Retention

Calculating Life Time Revenue through Cohort Analysis

The detailed method of calculating LTR does not need to be shown in every board package but should be included at least once per year, but calculated monthly for management.

The LTR calculation uses a grid where the columns would be the various Quarterly cohorts, that is all customers that first purchased that quarter (management might also do this using monthly instead of quarterly). This analysis can be applied to non-SaaS companies as well as SaaS entities. The first row would be the number of customers in the cohort. The next row would be the first month’s revenue for the cohort, the next the second months revenue, and so on until reaching 36 months (or whatever number the board prefers for B2B…I prefer 60 months). The next row would be the total for the full period and the final row would be the average Lifetime Revenue, LTR, per member of the cohort.

Table 4: Customer Lifetime Revenue

A second table would replicate the grid but show average per member of the cohort for each month (row). That table allows comparisons of cohorts to see if the average revenue of a newer cohort is getting better or worse than older ones for month 2 or month 6 or month 36, etc.

Table 5: Average Revenue per Cohort

Cohorts that have a full 36 months of data need to be at least 36 months old. What this means is that more recent cohorts will not have a full set of information but still can be used to see what trends have occurred. For example, is the second months average revenue for a current cohort much less than it was for a cohort one year ago? While newer cohorts do not have full sets of monthly revenue data, they still are very relevant in calculating more recent LTR. This can be done by using average monthly declines in sequential months and applying them to cohorts with fewer months of data.

Customer Acquisition Cost (CAC)

Calculating CAC is done in a variety of ways and is quite different for customers acquired electronically versus those obtained by a sales force.  Many companies I’ve seen have a combination of the two.

Marketing used to generate leads should always be considered part of CAC. The marketing cost in a month first is divided by the number of leads to generate a cost/lead. The next step is to estimate the conversion rate of leads to customers. A simple table would be as follows:

Table 6: Customer Acquisition Costs

table 6.1

For an eCommerce company, the additional cost to convert might be one free month of product or a heavily subsidized price for the first month. If the customer is getting the item before becoming a regular paying customer than the CAC would be:

CAC = MCTC / the percent that converts from the promotional trial to a paying customer.

CAC when a Sales Force is Involved

For many eCommerce companies and B2B companies that sell electronically, marketing is the primary cost involved in acquiring a paying customer. For those utilizing a sales force, the marketing expense plus the sales expense must be accumulated to determine CAC.

Typically, what this means is steps 1 through 3 above would still be used to determine CPL, but step 1 above might include marketing personnel used to generate leads plus external marketing spend:

  1. CPL (cost per lead) as above
  2. Sales Cost = current month’s cost of the sales force including T&E
  3. New Customers in the month = NC
  4. Conversion Rate to Customer = NC/number of leads= Y%
  5. CAC = CPL/Y% + (Sales Cost)/NC

There are many nuances ignored in the simple method shown. For example, some leads may take many months to close. Some may go through a pilot before closing. Therefore, there are more sophisticated methods of calculating CAC but using this method would begin the process of understanding an important indicator of efficiency of customer acquisition.

Gross Margin (GM) is a Critical Part of the Equation

While revenue is obviously an important measure of success, not all revenue is the same. Revenue that generates 90% gross margin is a lot more valuable per dollar than revenue that generates 15% gross margin. When measuring a company’s potential for future success it’s important to understand what level of revenue is required to reach profitability. A first step is understanding how gross margin may evolve. When a business scales there are many opportunities to improve margins:

  • Larger volumes may lead to larger discounts from suppliers
  • Larger volumes for products that are software/content may lower the hosting cost as a percent of revenue
  • Shipping to a larger number of customers may allow opening additional distribution centers (DCs) to facilitate serving customers from a DC closer to their location lowering shipping cost
  • Larger volumes may mean improved efficiency in the warehouse. For example, it may make more automation cost effective

When forecasting gross margin, it is important to be cautious in predicting some of these savings. The board should question radical changes in GM in the forecast. Certain efficiencies should be seen in a quarterly trend, and a marked improvement from the trend needs to be justified. The more significant jump in GM from a second DC can be calculated by looking at the change in shipping rates for customers that will be serviced from the new DC vs what rates are for these customers from the existing one.

Calculating LTV (Lifetime Value)

Gross Margin, by itself may be off as a measure of variable profits of a customer. If payment is by credit card, then the credit card cost per customer is part of variable costs. Some companies do not include shipping charges as part of cost of goods, but they should always be part of variable cost. Customer service cost is typically another cost that rises in proportion to the number of customers. So:

Variable cost = Cost of Goods sold plus any cost that varies directly with sales

Variable Profit = Revenue – Variable Cost

Variable Profit% (VP%) = (Variable Profit)/Revenue

LTV = LTR x VP%

The calculation of VP% should be based on current numbers as they will apply going forward. Determining a company’s marketing efficiency requires comparing LTV to the cost of customer acquisition. As mentioned earlier in the post, if the CAC is too large a proportion of LTV, a company may be showing deceptive (profitless) growth. So, the next set of KPIs address marketing efficiency.

Marketing Efficiency

It does not make sense to invest in an inefficient company as they will burn through capital at a rapid rate and will find it difficult to become profitable. A key measure of efficiency is the relationship between LTV and CAC or LTV/CAC. Essentially this is how many dollars of variable profit the company will make for every dollar it spends on marketing and sales. A ratio of 5 or more usually means the company is efficient. The period used for calculating LTR will influence this number. Since churn tends to be much lower for B2B companies, 5 years is often used to calculate LTR and LTV. But, using 5 years means waiting longer to receive resulting profits and can obscure cash flow implications of slower recovery of CAC. So, a second metric important to understand burn is how long it takes to recover CAC:

CAC Recovery Time = number of months until variable profit equals the CAC

The longer the CAC recovery time, the more capital required to finance growth. Of course, existing customers are also contributing to the month’s revenue alongside new customers. So, another interesting KPI is contribution margin which measures the current state of balance between marketing/sales and Variable Profits:

Contribution Margin = Variable Profits – Sales and Marketing Cost

Early on this number will be negative as there aren’t enough older customers to cover the investment in new ones. But eventually the contribution margin in a month needs to turn positive. To reach profitability it needs to exceed all other costs of the business (G&A, R&D, etc.). By reducing a month’s marketing cost, a company can improve contribution margin that month at the expense of sequential growth… which is why this is a balancing act.

I realize this post is long but wanted to include a substantial portion of KPIs in one post. However, I’ll leave more detailed measurement of sales force productivity and deeper analysis of several of the KPIs discussed here for one or more future posts.

Soundbytes

I’ll begin by apologizing for a midyear brag, but I always tell others to enjoy success and therefore am about to do that myself. In my top ten predictions for 2018 I included a market prediction and 4 stock predictions. I was feeling pretty good that they were all working well when I started to create this post. However, the stock prices for high growth stocks can experience serious shifts in very short periods. Facebook and Tesla both had (what I consider) minor shortfalls against expectations in the 10 days since and have subsequently declined quite a bit in that period. But given the strength of my other two recommendations, Amazon and Stitchfix, the four still have an average gain of 15% as of July 27. Since I’ve only felt comfortable predicting the market when it was easy (after 9/11 and after the 2008 mortgage blowup), I was nervous about predicting the S&P would be up this year as it was a closer call and was somewhat controversial given the length of the bull market prior to this year. But it seemed obvious that the new tax law would be very positive for corporate earnings. So, I thought the S&P would be up despite the likelihood of rising interest rates. So far, it is ahead 4.4% year to date driven by stronger earnings. Since I always fear that my record of annual wins can’t continue I wanted to take a midyear victory lap just in case everything collapses in the second half of the year (which I don’t expect but always fear). So I continue to hold all 4 stocks and in fact bought a bit more Facebook today.