Why Contribution Margin is a Strong Predictor of Success for Companies

In the last post I concluded with a brief discussion of Contribution Margin as a key KPI. Recall:

Contribution Margin = Variable Profits – Sales and Marketing Cost

The higher the contribution margin, the more dollars available towards covering G&A. Once contribution margin exceeds G&A, a company reaches operating profits. For simplicity in this post, I’ll use gross margin (GM) as the definition of variable profits even though there may be other costs that vary directly with revenue.

The Drivers of Contribution Margin (CM)

There is an absolute correlation between GM percent and CM. Very high gross margin companies will, in general, get to strong contribution margins and low gross margin companies will struggle to get there. But the sales and marketing needed to drive growth is just as important. There are several underlying factors in how much needs to be spent on sales and marketing to drive growth:

  1. The profits on a new customer relative to the cost of acquiring her (or him). That is, the CAC (customer acquisition cost) for customers derived from paid advertising compared to the profits on those customers’ first purchase
  2. The portion of new traffic that is “free” from SEO (search engine optimization), PR, existing customers recommending your products, etc.
  3. The portion of revenue that comes from repeat customers

The Relationship Between CAC and First Purchase Profits Has a Dramatic Impact on CM

Suppose Company A spends $60 to acquire a customer and has GM of $90 on the initial purchase by that customer. The contribution margin will already be positive $30 without accounting for customers that are organic or those that are repeat customers; in other words, this tends to be extremely positive! Of course, the startups I see in eCommerce are rarely in this situation but those that are can get to profitability fairly quickly if this relationship holds as they scale.

It would be more typical for companies to find that the initial purchase GM only covers a portion of CAC but that subsequent purchases lead to a positive relationship between the LTV (life time value) of the customer and CAC. If I assume the spend to acquire a customer is $60 and the GM is $30 then the CM on the first purchase would be negative (-$30), and it would take a second purchase with the same GM dollars to cover that initial cost. Most startups require several purchases before recovering CAC which in turn means requiring investment dollars to cover the outlay.

Free Traffic and Contribution Margin

If a company can generate a high proportion of free/organic traffic, there is a benefit to contribution margin. CAC is defined as the marketing spend divided by the number of new customers derived from this spend. Blended CAC is defined as the marketing spend divided by all customers who purchased in the period. The more organically generated and return customers, the lower the “blended CAC”. Using the above example, suppose 50% of the new customers for Company A come from organic (free) traffic. Then the “blended CAC“ would be 50% of the paid CAC. In the above example that would be $30 instead of $60 and if the GM was only $30 the initial purchase would cover blended CAC.

Of course, in addition to obtaining customers for free from organic traffic, companies, as they build their customer base, have an increasing opportunity to obtain free traffic by getting existing customers to buy again. So, a company should never forget that maintaining a persistent relationship with customers leads to improved Contribution Margin.

Spending to Drive Higher Growth Can Mean Lower Contribution Margin

Unless the GM on the first purchase a new customer makes exceeds their CAC, there is an inverse relationship between expanding growth and achieving high contribution margin. Think of it this way: suppose that going into a month the likely organic traffic and repeat buyers are somewhat set. Boosting that month’s growth means increasing the number of new paid customers, which in turn makes paid customers a higher proportion of blended CAC and therefore increases CAC. For an example consider the following assumptions for Company B:

  • The GM is $60 on an average order of $100
  • Paid CAC is $150
  • The company will have 1,000 new customers through organic means and 2,000 repeat buyers or $300,000 in revenue with 60% GM ($180,000) from these customers before spending on paid customers
  • G&A besides marketing for the month will be $150,000
  • Last year Company B had $400,000 in revenue in the same month
  • The company is considering the ramifications of targeting 25%, 50% or 100% year-over-year growth

Table 1: The Relationship Between Contribution Margin & Growth

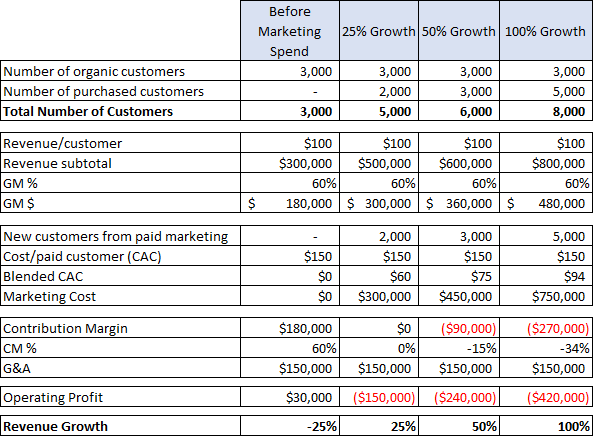
Since the paid CAC is $150 while Gross Margin is only $60 per new customer, each acquired customer generates negative $90 in contribution margin in the period. As can be seen in Table 1, the company would shrink 25% if there is no acquisition spend but would have $180,000 in contribution margin and positive operating profit. On the other end of the spectrum, driving 100% growth requires spending $750,000 to acquire 5,000 new customers and results in a negative $270,000 in contribution margin and an Operating Loss of $420,000 in the period. Of course, if new customers are expected to make multiple future purchases than the number of repeat customers would rise in future periods.

Subscription Models Create More Consistency but are not a Panacea

When a company’s customers are monthly subscribers, each month starts with the prior month’s base less churn. To put it another way, if churn from the prior month is modest (for example 5%) then that month already has 95% of the prior months revenue from repeat customers. Additionally, if the company increases the average invoice value from these customers, it might even have a starting point where return customers account for as much revenue as the prior month. For B-to-B companies, high revenue retention is the norm, where an average customer will pay them for 10 years or more.

Consumer ecommerce subscriptions typically have much more substantial churn, with an average life of two years being closer to the norm. Additionally, the highest level of churn (which can be as much as 30% or more) occurs in the second month, and the next highest, the third month before tapering off. What this means is that companies trying to drive high sequential growth will have a higher % churn rate than those that target more modest growth. Part of a company’s acquisition spend is needed just to stay even. For example, if we assume all new customers come from paid acquisition, the CAC is $200, and that 15% of 10,000 customers churn then the first $300,000 in marketing spend would just serve to replace the churned customers and additional spend would be needed to drive sequential growth.

Investing in Companies with High Contribution Margin

As a VC, I tend to appreciate strong business models and like to invest after some baseline proof points are in place.  In my last post I outlined a number of metrics that were important ways to track a company’s health with the ratio of LTV (life time value) to CAC being one of the most important. When a company has a high contribution margin they have the time to build that ratio by adding more products or establishing subscriptions without burning through a lot of capital. Further, companies that have a high LTV/CAC ratio should have a high contribution margin as they mature since this usually means customers buy many times – leading to an expansion in repeat business as part of each month’s total revenue.

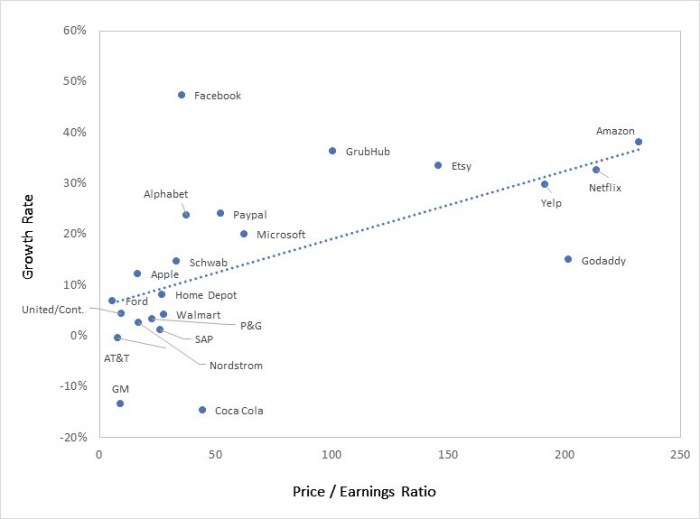
This thought process also applies to public companies. One of the most extreme is Facebook, which I’ve owned and recommended for five years. Even after the recent pullback its stock price is about 7x what it was five years ago (or has appreciated at a compound rate of nearly 50% per year since I’ve been recommending it). Not a surprise as Facebook’s contribution margin runs over 70% and revenue was up year/year 42% in Q2. These are extraordinary numbers for a company its size.

To give the reader some idea of how this method can be used as one screen for public companies, Table 2 shows gross margin, contribution margin, revenue growth and this year’s stock market performance for seven public companies.

Table 2: Public Company Contribution Margin Analysis

Two of the seven companies shown stand out as having both high Contribution Margin and strong revenue growth: Etsy and Stitch Fix. Each had year/year revenue growth of around 30% in Q2 coupled with 44% and 29% contribution margins, respectively. This likely has been a factor in Stitch Fix stock appreciating 53% and Etsy 135% since the beginning of the year.

Three of the seven have weak models and are struggling to balance revenue growth and contribution margin: Blue Apron, Overstock, and Groupon. Both Blue Apron and Groupon have been attempting to reduce their losses by dropping their marketing spend. While this increased their CM by 10% and 20% respectively, it also meant that they both have negative growth while still losing money. The losses for Blue Apron were over 16% of revenue. This coupled with shrinking revenue feels like a lethal combination. Blue Apron stock is only down a marginal amount year-to-date but is 59% lower than one year ago. Groupon, because of much higher gross margins than Blue Apron (52% vs 35%), still seems to have a chance to turn things around, but does have a lot of work to do. Overstock went in the other direction, increasing marketing spend to drive modest revenue growth of 12%. But this led to a negative CM and substantially increased losses. That strategy did not seem to benefit shareholders as the stock has declined 53% since the beginning of the year.

eBay is a healthy company from a contribution margin point of view but has sub 10% revenue growth. I can’t tell if increasing their market spend by a substantial amount (at the cost of lower CM) would be a better balance for them.

For me, Spotify is the one anomaly in the table as its stock has appreciated 46% since the IPO despite weak contribution margins which was one reason for my negative view expressed in a prior post. I think that is driven by three reasons: its product is an iconic brand; there is not a lot of float in the stock creating some scarcity; and contribution margin has been improving giving bulls on the stock a belief that it can get to profitability eventually. I say it is an anomaly, as comparing it to Facebook, it is hard to justify the relative valuations. Facebook grew 42% in Q2, Spotify 26%; Facebook is trading at a P/E of 24 whereas even if we assume Spotify can eventually get to generating 6% net profit (it currently is at a 7% loss before finance charges and 31% loss after finance charges, so this feels optimistic) Spotify would be trading at 112 times this theoretic future earnings.


SoundBytes

I found the recent controversy over Elon Musk’s sharing his thoughts on taking Tesla private interesting. On the one hand, people want transparency from companies and Elon certainly provides that! On the other hand, it clearly impacted the stock price for a few days and the SEC abhors anything that can be construed as stock manipulation. Of course, Elon may not have been as careful as he should have been when he sent out his tweet regarding whether financing was lined up…but like most entrepreneurs he was optimistic.

Company Valuations Implied by my Valuations Bible: Are Snap, Netflix, Square and Twitter Grossly Overvalued?

Applying the Gross Margin Multiple Method to Public Company Valuation

In my last two posts I’ve laid out a method to value companies not yet at their mature business models. The method provides a way to value unprofitable growth companies and those that are profitable but not yet at what could be their mature business model. This often occurs when a company is heavily investing in growth at the expense of near-term profits. In the last post, I showed how I would estimate what I believed the long-term model would be for Tesla, calling the result “Potential Earnings” or “PE”. Since this method requires multiple assumptions, some of which might not find agreement among investors, I provided a second, simplified method that only involved gross margin and revenue growth.

The first step was taking about 20 public companies and calculating how they were valued as a multiple of gross margin (GM) dollars. The second step was to determine a “least square line” and formula based on revenue growth and the gross margin multiple for these companies. The coefficient of 0.62 shows that there is a good correlation between Gross Margin and Revenue Growth, and one significantly better than the one between Revenue Growth and a company’s Revenue Multiple (that had a coefficient of 0.36 which is considered very modest).

Where’s the Beef?

The least square formula derived in my post for relating revenue growth to an implied multiple of Gross Margin dollars is:

GM Multiple = (24.773 x Revenue growth percent) + 4.1083

Implied Company Market Value = GM Multiple x GM Dollars

Now comes the controversial part. I am going to apply this formula to 10 companies using their data (with small adjustments) and compare the Implied Market Value (Implied MKT Cap) to their existing market Cap as of several days ago. I’ll than calculate the Implied Over (under) Valuation based on the comparison. If the two values are within 20% I view it as normal statistical variation.

Table 1: Valuation Analysis of 10 Tech Companies

  • * Includes net cash included in expected market cap
  • ** Uses adjusted GM%
  • *** Uses 1/31/18 year end
  • **** Growth rate used in the model is q4 2017 vs q4 2016.  See text

This method suggests that 5 companies are over-valued by 100% or more and a fifth, Workday, by 25%. Since Workday is close to a normal variation, I won’t discuss it further. I have added net cash for Facebook, Snap, Workday and Twitter to the implied market cap as it was material in each case but did not do so for the six others as the impact was not as material.

I decided to include the four companies I recommended, in this year’s top ten list, Amazon, Facebook, Tesla and Stitchfix, in the analysis. To my relief, they all show as under-valued with Stitchfix, (the only one below the Jan 2 price) having an implied valuation more than 100% above where it currently trades. The other three are up year to date, and while trading below what is suggested by this method, are within a normal range. For additional discussion of these four see our 2018 top Ten List.


Digging into the “Overvalued” Five

Why is there such a large discrepancy between actual market cap and that implied by this method for 5 companies? There are three possibilities:

  1. The method is inaccurate
  2. The method is a valid screen but I’m missing some adjustment for these companies
  3. The companies are over-valued and at some point, will adjust, making them risky investments

While the method is a good screen on valuation, it can be off for any given company for three reasons:  the revenue growth rate I’m using will radically change; a particular company has an ability to dramatically increase gross margins, and/or a particular company can generate much higher profit margins than their gross margin suggests. Each of these may be reflected in the company’s actual valuation but isn’t captured by this method.

To help understand what might make the stock attractive to an advocate, I’ll go into a lot of detail in analyzing Snap. Since similar arguments apply to the other 4, I’ll go into less detail for each but still point out what is implicit in their valuations.

Snap

Snap’s gross margin (GM) is well below its peers and hurts its potential profitability and implied valuation. Last year, GM was about 15%, excluding depreciation and amortization, but it was much higher in the seasonally strong Q4. It’s most direct competitor, Facebook, has a gross margin of 87%.  The difference is that Facebook monetizes its users at a much higher level and has invested billions of dollars and executed quite well in creating its own low-cost infrastructure, while Snap has outsourced its backend to cloud providers Google and Amazon. Snap has recently signed 5-year contracts with each of them to extend the relationships. Committing to lengthy contracts will likely lower the cost of goods sold.  Additionally, increasing revenue per user should also improve GM.  But, continuing to outsource puts a cap on how high margins can reach. Using our model, Snap would need 79% gross margin to justify its current valuation. If I assume that scale and the longer-term contracts will enable Snap to double its gross margins to 30%, the model still shows it as being over-valued by 128% (as opposed to the 276% shown in our table). The other reason bulls on Snap may justify its high valuation is that they expect it to continue to grow revenue at 100% or more in 2018 and beyond. What is built into most forecasts is an assumed decline in revenue growth rates over time… as that is what typically occurs. The model shows that growing revenue 100% a year for two more years without burning cash would leave it only 32% over-valued in 2 years. But as a company scales, keeping revenue growth at that high a level is a daunting task. In fact, Snap already saw revenue growth decline to 75% in Q4 of 2017.

Twitter

Twitter is not profitable.  Revenue declined in 2017 after growing a modest 15% in 2016, and yet it trades at a valuation that implies that it is a growth company of about 50%. While it has achieved such levels in the past, it may be difficult to even get back to 15% growth in the future given increased competition for advertising.

Netflix

I recommended Netflix in January 2015 as one of my stock picks for the year, and it proved a strong recommendation as the stock went up about 140% that year. However, between January 2015 and January 2018, the stock was up over 550% while trailing revenue only increased 112%.  I continue to like the fundamentals of Netflix, but my GM model indicates that the stock may have gotten ahead of itself by a fair amount, and it is unlikely to dramatically increase revenue growth rates from last year’s 32%.

Square

Square has followed what I believe to be the average pattern of revenue growth rate decline as it went from 49% growth in 2015, down to 35% growth in 2016, to under 30% growth in 2017. There is no reason to think this will radically change, but the stock is trading as if its revenue is expected to grow at a nearly 90% rate. On the GM side, Square has been improving GM each year and advocates will point out that it could go higher than the 38% it was in 2017. But, even if I use 45% for GM, assuming it can reach that, the model still implies it is 90% over-valued.

Blue Apron

I don’t want to beat up on a struggling Blue Apron and thought it might have reached its nadir, but the model still implies it is considerably over-valued. One problem that the company is facing is that investors are negative when a company has slow growth and keeps losing money. Such companies find it difficult to raise additional capital. So, before running out of cash, Blue Apron began cutting expenses to try to reach profitability. Unfortunately, given their customer churn, cutting marketing spend resulted in shrinking revenue in each sequential quarter of 2017. In Q4 the burn was down to $30 million but the company was now at a 13% decline in revenue versus Q4 of 2016 (which is what we used in our model). I assume the solution probably needs to be a sale of the company. There could be buyers who would like to acquire the customer base, supplier relationships and Blue Apron’s understanding of process. But given that it has very thin technology, considerable churn and strong competition, I’m not sure if a buyer would be willing to pay a substantial premium to its market cap.


An Alternative Theory on the Over Valued Five

I have to emphasize that I am no longer a Wall Street analyst and don’t have detailed knowledge of the companies discussed in this post, so I easily could be missing some important factors that drive their valuation.  However, if the GM multiple model is an accurate way of determining valuation, then why are they trading at such lofty premiums to implied value? One very noticeable common characteristic of all 5 companies in question is that they are well known brands used by millions (or even tens of millions) of people. Years ago, one of the most successful fund managers ever wrote a book where he told readers to rely on their judgement of what products they thought were great in deciding what stocks to own. I believe there is some large subset of personal and professional investors who do exactly that. So, the stories go:

  • “The younger generation is using Snap instead of Facebook and my son or daughter loves it”
  • “I use Twitter every day and really depend on it”
  • “Netflix is my go-to provider for video content and I’m even thinking of getting rid of my cable subscription”

Once investors substitute such inclinations for hard analysis, valuations can vary widely from those suggested by analytics. I’m not saying that such thoughts can’t prove correct, but I believe that investors need to be very wary of relying on such intuition in the face of evidence that contradicts it.

The Valuation Bible

Facebook valuation image

After many years of successfully picking public and private companies to invest in, I thought I’d share some of the core fundamentals I use to think about how a company should be valued. Let me start by saying numerous companies defy the logic that I will lay out in this post, often for good reasons, sometimes for poor ones. However, eventually most companies will likely approach this method, so it should at least be used as a sanity check against valuations.

When a company is young, it may not have any earnings at all, or it may be at an earnings level (relative to revenue) that is expected to rise. In this post, I’ll start by considering more mature companies that are approaching their long-term model for earnings to establish a framework, before addressing how this framework applies to less mature companies. The post will be followed by another one where I apply the rules to Tesla and discuss how it carries over into private companies.

Growth and Earnings are the Starting Points for Valuing Mature Companies

When a company is public, the most frequently cited metric for valuation is its price to earnings ratio (PE). This may be done based on either a trailing 12 months or a forward 12 months. In classic finance theory a company should be valued based on the present value of future cash flows. What this leads to is our first rule:

Rule 1: Higher Growth Rates should result in a higher PE ratio.

When I was on Wall Street, I studied hundreds of growth companies (this analysis does not apply to cyclical companies) over the prior 10-year period and found that there was a very strong correlation between a given year’s revenue growth rate and the next year’s revenue growth rate. While the growth rate usually declined year over year if it was over 10%, on average this decline was less than 20% of the prior year’s growth rate. What this means is that if we took a group of companies with a revenue growth rate of 40% this year, the average organic growth for the group would likely be about 33%-38% the next year. Of course, things like recessions, major new product releases, tax changes, and more could impact this, but over a lengthy period of time this tended to be a good sanity test. As of January 2, 2018, the average S&P company had a PE ratio of 25 on trailing earnings and was growing revenue at 5% per year. Rule 1 implies that companies growing faster should have higher PEs and those growing slower, lower PEs than the average.

Graph 1: Growth Rates vs. Price Earnings Ratios

graph

The graph shows the correlation between growth and PE based on the valuations of 21 public companies. Based on Rule 1, those above the line may be relatively under-priced and those below relatively over-priced. I say ‘may be’ as there are many other factors to consider, and the above is only one of several ways to value companies. Notice that most of the theoretically over-priced companies with growth rates of under 5% are traditional companies that have long histories of success and pay a dividend. What may be the case is that it takes several years for the market to adjust to their changed circumstances or they may be valued based on the return from the dividend. For example, is Coca Cola trading on: past glory, its 3.5% dividend, or is there something about current earnings that is deceptive (revenue growth has been a problem for several years as people switch from soda to healthier drinks)? I am not up to speed enough to know the answer. Those above the line may be buys despite appearing to be highly valued by other measures.

Relatively early in my career (in 1993-1995) I applied this theory to make one of my best calls on Wall Street: “Buy Dell sell Kellogg”. At the time Dell was growing revenue over 50% per year and Kellogg was struggling to grow it over 4% annually (its compounded growth from 1992 to 1995, this was partly based on price increases). Yet Dell’s PE was about half that of Kellogg and well below the S&P average. So, the call, while radical at the time, was an obvious consequence of Rule 1. Fortunately for me, Dell’s stock appreciated over 65X from January 1993 to January 2000 (and well over 100X while I had it as a top pick) while Kellogg, despite large appreciation in the overall stock market, saw its stock decline slightly over the same 7-year period (but holders did receive annual dividends).

Rule 2: Predictability of Revenue and Earnings Growth should drive a higher trailing PE

Investors place a great deal of value on predictability of growth and earnings, which is why companies with subscription/SaaS models tend to get higher multiples than those with regular sales models. It is also why companies with large sales backlogs usually get additional value. In both cases, investors can more readily value the companies on forward earnings since they are more predictable.

Rule 3: Market Opportunity should impact the Valuation of Emerging Leaders

When one considers why high growth rates might persist, the size of the market opportunity should be viewed as a major factor. The trick here is to make sure the market being considered is really the appropriate one for that company. In the early 1990s, Dell had a relatively small share of a rapidly growing PC market. Given its competitive advantages, I expected Dell to gain share in this mushrooming market. At the same time, Kellogg had a stable share of a relatively flat cereal market, hardly a formula for growth. In recent times, I have consistently recommended Facebook in this blog for the very same reasons I had recommended Dell: in 2013, Facebook had a modest share of the online advertising, a market expected to grow rapidly. Given the advantages Facebook had (and they were apparent as I saw every Azure ecommerce portfolio company moving a large portion of marketing spend to Facebook), it was relatively easy for me to realize that Facebook would rapidly gain share. During the time I’ve owned it and recommended it, this has worked out well as the share price is up over 8X.

How the rules can be applied to companies that are pre-profit

As a VC, it is important to evaluate what companies should be valued at well before they are profitable. While this is nearly impossible to do when we first invest (and won’t be covered in this post), it is feasible to get a realistic range when an offer comes in to acquire a portfolio company that has started to mature. Since they are not profitable, how can I apply a PE ratio?

What needs to be done is to try to forecast eventual profitability when the company matures. A first step is to see where current gross margins are and to understand whether they can realistically increase. The word realistic is the key one here. For example, if a young ecommerce company currently has one distribution center on the west coast, like our portfolio company Le Tote, the impact on shipping costs of adding a second eastern distribution center can be modeled based on current customer locations and known shipping rates from each distribution center. Such modeling, in the case of Le Tote, shows that gross margins will increase 5%-7% once the second distribution center is fully functional. On the other hand, a company that builds revenue city by city, like food service providers, may have little opportunity to save on shipping.

  • Calculating variable Profit Margin

Once the forecast range for “mature” gross margin is estimated, the next step is to identify other costs that will increase in some proportion to revenue. For example, if a company is an ecommerce company that acquires most of its new customers through Facebook, Google and other advertising and has high churn, the spend on customer acquisition may continue to increase in direct proportion to revenue. Similarly, if customer service needs to be labor intensive, this can also be a variable cost. So, the next step in the process is to access where one expects the “variable profit margin” to wind up. While I don’t know the company well, this appears to be a significant issue for Blue Apron: marketing and cost of goods add up to about 90% of revenue. I suspect that customer support probably eats up (no pun intended) 5-10% of what is left, putting variable margins very close to zero. If I assume that the company can eventually generate 10% variable profit margin (which is giving it credit for strong execution), it would need to reach about $4 billion in annual revenue to reach break-even if other costs (product, technology and G&A) do not increase. That means increasing revenue nearly 5-fold. At their current YTD growth rate this would take 9 years and explains why the stock has a low valuation.

  • Estimating Long Term Net Margin

Once the variable profit margin is determined, the next step would be to estimate what the long-term ratio of all other operating cost might be as a percent of revenue. Using this estimate I can determine a Theoretic Net Earnings Percent. Applying this percent to current (or next years) revenue yields a Theoretic Earnings and a Theoretic PE (TPE):

TPE= Market Cap/Theoretic Earnings     

To give you a sense of how I successfully use this, review my recap of the Top Ten Predictions from 2017 where I correctly predicted that Spotify would not go public last year despite strong top line growth as it was hard to see how its business model could support more than 2% or so positive operating margin, and that required renegotiating royalty deals with record labels.  Now that Spotify has successfully negotiated a 3% lower royalty rate from several of the labels, it appears that the 16% gross margins in 2016 could rise to 19% or more by the end of 2018. This means that variable margins (after marketing cost) might be 6%. This would narrow its losses, but still means it might be several years before the company achieves the 2% operating margins discussed in that post. As a result, Spotify appears headed for a non-traditional IPO, clearly fearing that portfolio managers would not be likely to value it at its private valuation price since that would lead to a TPE of over 200. Since Spotify is loved by many consumers, individuals might be willing to overpay relative to my valuation analysis.

Our next post will pick up this theme by walking through why this leads me to believe Tesla continues to have upside, and then discussing how entrepreneurs should view exit opportunities.


SoundBytes

I’ve often written about effective shooting percentage relative to Stephen Curry, and once again he leads the league among players who average 15 points or more per game. What also accounts for the Warriors success is the effective shooting of Klay Thompson, who is 3rd in the league, and Kevin Durant who is 6th. Not surprisingly, Lebron is also in the top 10 (4th). The table below shows the top ten among players averaging 15 points or more per game.  Of the top ten scorers in the league, 6 are among the top 10 effective shooters with James Harden only slightly behind at 54.8%. The remaining 3 are Cousins (53.0%), Lillard (52.2%), and Westbrook, the only one below the league average of 52.1% at 47.4%.

Table: Top Ten Effective Shooters in the League

table

*Note: Bolded players denote those in the top 10 in Points per Game

Will Grocery Shopping Ever be the Same?

Will grocery shopping ever be the same?

Dining and shopping today is very different than in days gone by – the Amazon acquisition of Whole Foods is a result

“I used to drink it,” said Andy Warhol once of Campbell’s soup. “I used to have the same lunch every day, for 20 years, I guess, the same thing over and over again.” In Warhol’s signature medium, silkscreen, the artist reproduced his daily Campbell’s soup can over and over again, changing only the label graphic on each one.

When I was growing up I didn’t have exactly the same thing over and over like Andy Warhol, but virtually every dinner was at home, at our kitchen table (we had no dining room in the 4-room apartment). Eating out was a rare treat and my father would have been abhorred if my mom brought in prepared food. My mom, like most women of that era, didn’t officially work, but did do the bookkeeping for my dad’s plumbing business. She would shop for food almost every day at a local grocery and wheel it home in her shopping cart.

When my wife and I were raising our kids, the kitchen remained the most important room in the house. While we tended to eat out many weekend nights, our Sunday through Thursday dinners were consumed at home, but were sprinkled with occasional meals brought in from the outside like pizza, fried chicken, ribs, and Chinese food. Now, given a high proportion of households where both parents work, eating out, fast foods and prepared foods have become a large proportion of how Americans consume dinner. This trend has reached the point where some say having a traditional kitchen may disappear as people may cease cooking at all.

In this post, I discuss the evolution of our eating habits, and how they will continue to change. Clearly, the changes that have already occurred in shopping for food and eating habits were motivations for Amazon’s acquisition of Whole Foods.

The Range of How We Dine

Dining can be broken into multiple categories and families usually participate in all of them. First, almost 60% of dinners eaten at home are still prepared there. While the percentage has diminished, it is still the largest of the 4 categories for dinners. Second, many meals are now purchased from a third party but still consumed at home. Given the rise of delivery services and greater availability of pre-cooked meals at groceries, the category spans virtually every type of food. Thirdly, many meals are purchased from a fast food chain (about 25% of Americans eat some type of fast food every day1) and about 20% of meals2 are eaten in a car. Finally, a smaller percentage of meals are consumed at a restaurant. (Sources: 1Schlosser, Eric. “Americans Are Obsessed with Fast Food: The Dark Side of the All-American Meal.” CBSNews. Accessed April 14, 2014 / 2Stanford University. “What’s for Dinner?” Multidisciplinary Teaching and Research at Stanford. Accessed April 14, 2014).

The shift to consuming food away from home has been a trend for the last 50 years as families began going from one worker to both spouses working. The proportion of spending on food consumed away from home has consistently increased from 1965-2014 – from 30% to 50%.

Source: Calculated by the Economic Research Service, USDA, from various data sets from the U.S. Census Bureau and the Bureau of Labor Statistics.

With both spouses working, the time available to prepare food was dramatically reduced. Yet, shopping in a supermarket remained largely the same except for more availability of prepared meals. Now, changes that have already begun could make eating dinner at home more convenient than eating out with a cost comparable to a fast food chain.

Why Shopping for Food Will Change Dramatically over the Next 30 Years

Eating at home can be divided between:

  1. Cooking from scratch using ingredients from general shopping
  2. Buying prepared foods from a grocery
  3. Cooking from scratch from recipes supplied with the associated ingredients (meal kits)
  4. Ordering meals that have previously been prepared and only need to be heated up
  5. Ordering meals from a restaurant that are picked up or delivered to your home
  6. Ordering “fast food” type meals like pizza, ribs, chicken, etc. for pickup or delivery.

I am starting with the assumption that many people will still want to cook some proportion of their dinners (I may be romanticizing given how I grew up and how my wife and I raised our family). But, as cooking for yourself becomes an even smaller percentage of dinners, shopping for food in the traditional way will prove inefficient. Why buy a package of saffron or thyme or a bag of onions, only to see very little of it consumed before it is no longer usable? And why start cooking a meal, after shopping at a grocery, only to find you are missing an ingredient of the recipe? Instead, why not shop by the meal instead of shopping for many items that may or may not end up being used.

Shopping by the meal is the essential value proposition offered by Blue Apron, Plated, Hello Fresh, Chef’d and others. Each sends you recipes and all the ingredients to prepare a meal. There is little food waste involved (although packaging is another story). If the meal preparation requires one onion, that is what is included, if it requires a pinch of saffron, then only a pinch is sent. When preparing one of these meals you never find yourself missing an ingredient. It takes a lot of the stress and the food waste out of the meal preparation process. But most such plans, in trying to keep the cost per meal to under $10, have very limited choices each week (all in a similar lower cost price range) and require committing to multiple meals per week. Chef’d, one of the exceptions to this, allows the user to choose individual meals or to purchase a weekly subscription. They also offer over 600 options to choose from while a service like Blue Apron asks the subscriber to select 3 out of 6 choices each week.

Blue Apron meals portioned perfectly for the amount required for the recipes

My second assumption is that the number of meals that are created from scratch in an average household will diminish each year (as it already has for the past 50 years). However, many people will want to have access to “preferred high quality” meals that can be warmed up and eaten, especially in two-worker households. This will be easier and faster (but perhaps less gratifying) than preparing a recipe provided by a food supplier (along with all the ingredients). I am talking about going beyond the pre-cooked items in your average grocery. There are currently sources of such meals arising as delivery services partner with restaurants to provide meals delivered to your doorstep. But this type of service tends to be relatively expensive on a per meal basis.

I expect new services to arise (we’ve already seen a few) that offer meals that are less expensive prepared by “home chefs” or caterers and ordered through a marketplace (this is category 4 in my list). The marketplace will recruit the chefs, supply them with packaging, take orders, deliver to the end customers, and collect the money. Since the food won’t be from a restaurant, with all the associated overhead, prices can be lower. Providing such a service will be a source of income for people who prefer to work at home. Like drivers for Uber and Lyft, there should be a large pool of available suppliers who want to work in this manner. It will be very important for the marketplaces offering such service to curate to ensure that the quality and food safety standards of the product are guaranteed. The availability of good quality, moderately priced prepared meals of one’s choice delivered to the home may begin shifting more consumption back to the home, or at a minimum, slow the shift towards eating dinners away from home.

Where will Amazon be in the Equation?

In the past, I predicted that Amazon would create physical stores, but their recent acquisition of Whole Foods goes far beyond anything I forecast by providing them with an immediate, vast network of physical grocery stores. It does make a lot of sense, as I expect omnichannel marketing to be the future of retail.  My reasoning is simple: on the one hand, online commerce will always be some minority of retail (it currently is hovering around 10% of total retail sales); on the other hand, physical retail will continue to lose share of the total market to online for years to come, and we’ll see little difference between e-commerce and physical commerce players.  To be competitive, major players will have to be both, and deliver a seamless experience to the consumer.

Acquiring Whole Foods can make Amazon the runaway leader in categories 1 and 2, buying ingredients and/or prepared foods to be delivered to your home.  Amazon Fresh already supplies many people with products that are sourced from grocery stores, whether they be general food ingredients or traditional prepared foods supplied by a grocery. They also have numerous meal kits that they offer, and we expect (and are already seeing indications) that Amazon will follow the Whole Foods acquisition by increasing its focus on “meal kits” as it attempts to dominate this rising category (3 in our table).

One could argue that Whole Foods is already a significant player in category 4 (ordering meals that are prepared, and only need to be heated up), believing that category 4 is the same as category 2 (buying prepared meals from a grocery). But it is not. What we envision in the future is the ability to have individuals (who will all be referred to as “Home Chefs” or something like that) create brands and cook foods of every genre, price, etc. Customers will be able to order a set of meals completely to their taste from a local home chef. The logical combatants to control this market will be players like Uber and Lyft, guys like Amazon and Google, existing recipe sites like Blue Apron…and new startups we’ve never heard of.