Top Ten List for 2024

Last year was a very strong one for our top ten picks where all 10 proved correct, and our six recommended stocks were up an average of 96% with 3 of the 6 appreciating over 100%. While there is some risk in continuing to recommend them after such a strong surge last year, we believe they will perform well this year and already said (in the previous post) that each would be on the new list. The price per share we’ll use is as of December 31, 2023, for each (including Tesla which is down about 25% YTD). We are going to add one new stock to the group, Nvidia, which is a strong play on the push to AI as its chips are well ahead of others for that space.

The first 6 declined substantially in 2022 despite solid performance as they were victims of interest rates surging. The Fed has indicated that rates will likely decline in each of the next few years which should, in turn, help our “long-duration” stocks appreciate. The risk to this assumption is if inflation reverses its downward trend and surges once again. That could mean the Fed not only reverses its projection of declining rates but might increase rates once again. This would be quite negative for our stocks as there is a built-in assumption in the market that this will not occur.

Even with the 96% average gain in 2023, in the past 2 years the average of the 6 (we’ll talk about Nvidia separately) is still down 18.6% despite average revenue expanding by 86% in the same period. What this means is the price/share to revenue has declined by 56% in the past 2 years. If we looked at this over 3 years the decline would be even steeper. So, even if one believes that these stocks were at an inflated price at the end of 2021, they do not appear to be inflated now. Given that they are all growth companies (with analyst estimates showing 5 of these 6 growing 20% or more in 2024 and the 6th, Amazon, growing over 11%) it appears to us there is still strong upside barring extraneous events that cause difficult market conditions.

Of course, there is another issue for bears to jump on – the potential for a recession. This could undermine company performance. It appears we are headed for a “soft landing” but that still is not a given, especially if rates don’t start coming down at some point in 2024.

I’ve often pointed out that I am not a great forecaster of economics or of the market as a whole so the above discussion may not mean inflation moderates further, or that Fed Rates decline, etc. Given the compression in revenue multiples across the board in tech stocks over the past three years (the three year decline was even greater than shown in our above two year table), the opportunity for investing still appears timely to me despite last year’s appreciation in the stocks.

2023 Stock Recommendations (Note: base prices are as of December 31, 2023)

1. Tesla will continue to outperform the market (it closed at $248.48/share)

While Tesla did appreciate over 100% in 2023, its stock still was nearly 30% lower than on December 31, 2021. This occurred even though revenue was up almost 70% in the same two-year period. And the stock is down over 25% YTD in 2024. While the company reached its target  of over 1.8 million vehicles sold in 2023, it came at a cost of much lower gross margins leading to a very low growth rate for revenue in Q4 and disappointing earnings.

This plus several other issues have weighed on the stock:

  1. The Cybertruck, which has a massive backlog, is expensive to manufacture and could have very low gross margins until it ramps up to volume which is not expected until late this year. In 2025 it should add a more substantial number of units to Tesla sales.
  2. Elon keeps causing concern amongst investors with his behavior.
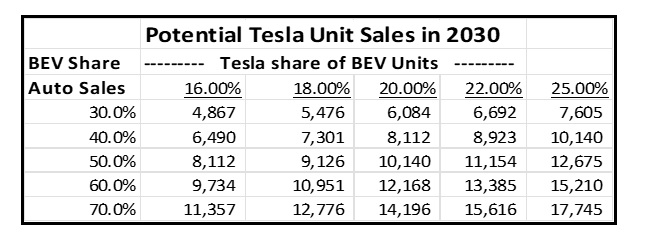
  3. The growth in sales of BEVs (Battery Electric Vehicles which does not include Hybrids) seems to be slowing. We always expect high growth rates to decline over time but still believe sales of BEVs will grow over 20% per year for some time. See our blog post for a full analysis of why we expect BEV sales to grow at a high rate for the next 5 years.
  4. The strategy of lowering prices to drive share gain is working in terms of market share gains but has had a negative impact on revenue growth and profitability.
  5. Competition is getting stronger.

While we agree that the Cybertruck will likely take much of 2024 to ramp up production it’s important to realize that sales of this vehicle are incremental for growth so selling 90,000 units would add 5% to Tesla’s 2024 unit growth rate (and more to its revenue growth rate), 180,000 would add 10%. We’re guessing shipments will likely be between the two with more than half in Q4. The vehicle is so unique that it should also act as a draw for people to visit Tesla showrooms which will help sales of other models.

If Elon is a bit distracted that should not impact Tesla as its product road map is pretty well set for the next 3-5 years. If his comments cause a subset of people to decide not to buy a Tesla this may be offset by others liking them and considering the vehicle.

High growth rates almost always decline over time as a product scales. The growth in sales of BEVs cannot stay at the level it’s been at so it shouldn’t be a surprise that it is slowing. In 2022 BEV unit growth was about 60%, down from over 100% the year before. In 2023 it appears to be about 37%, still a very attractive rate. Because of high interest rates 2024 auto sales growth will moderate across all vehicle categories but we expect it to reaccelerate as rates decline.

The competition from Chinese manufacturers is getting stronger. But competition appears to be weakening from everyone else. In November General Motors announced a lowering of its sales and production goals. This month Ford announced a large reduction in investment in Electronic vehicles. In September Volkswagen cancelled its plans for a new factory for building BEVs. To us this means Tesla and one or two Chinese manufacturers are out executing traditional auto companies and gaining share. As more customers convert to BEVs we believe Tesla will continue to gain share of the overall market.

Analysts are predicting that Tesla will grow revenue by 15% -20% in 2024. We believe it could be higher given the introduction of the Cybertruck, expansion of sales of the Semi, and unit growth that we expect to be 25% or more. Revenue growth will be slowed by lower pricing vs the prior year in the first 2 quarters but helped by the ramp of the Cybertruck in the second half of the year. By Q3 Cybertruck sales will be more meaningful and the ASPs of other Tesla models vs Q3 2023 will be better. All in all, we expect Tesla to return to over 25% revenue growth by Q4 and potentially grow over 20% for the year as a whole. We believe this not only means that its stock will make up the ground it has lost YTD but could show solid appreciation over the close on December 31, 2023.

2. Shopify will outperform the market (it closed at $77.88 per share)

In our post of Top Ten predictions last year, we pointed out that the pandemic had created a major warping of Shop revenue growth.  Instead of the normal decline for high growth companies from its 47% level in 2019 it jumped to 86% growth in 2020 and still was above “normal” at 57% in 2021. Once physical retail normalized in 2022, Shopify growth plunged against the elevated comps declining to a nadir of 16% in Q2, 2022. When we included Shop in our Top Ten for 2023, we pointed out that we expected its revenue growth to return to 20% or more throughout 2023. This indeed did occur, and Shopify revenue growth was about 25% for the year. We expect the 20% – 30% growth rate to continue in 2024 as:

  1. Net revenue retention for the company continues to be over 100% due to Shopify successfully expanding the services it provides to its eCommerce business customers. Additionally, because successful eCommerce companies are growing, Shopify also grows its portion of the customer revenue it shares. 
  2. Shopify has emerged as the number one alternative to Amazon and larger companies are now being added to its customer base.

We believe Shopify remains an undervalued stock as its price to revenue is still 63% lower than at the end of 2021.  Additionally, the company is now at the point of leverage where earnings should grow faster than revenue.

3. CrowdStrike will outperform the market (it closed at $255.17 per share)

CrowdStrike (CRWD) has now rebranded itself as the “AI Native Security Platform”  given its leadership in using AI to prevent breaches. The company continues to gain a substantial share of the data security market. Given its leadership position in the newest technology coupled with what is still just over 3% of its TAM, CRWD remains poised for continued high growth. This coupled with over 120% net revenue retention for 20 straight quarters makes CrowdStrike a likely long-term grower at over 30% per year. High revenue retention is primarily driven by expanded module purchases where 63% of subscription customers now pay for 5 or more modules.

The recent threats by Russia to create a Cyber attack on the U.S. could be an additional boost to the entire security industry. CrowdStrike stands to be a disproportionate beneficiary as it has the most advanced technology for defending companies against such attacks.

4. Amazon will outperform the market (it closed at $151.75 per share)

As we forecast, Amazon improved revenue growth in each quarter of 2023 from its low point of 8.6% in Q4 2022. In Q3 2023 growth was back to 12.6%.  Additionally, the company increased its focus on profitability with Q3 profits up well over 200% versus the prior year’s weak numbers. This coupled with the improved environment for tech stocks helped drive Amazon’s share price to $151.75 at year end, up 81% from the close on December 31, 2022. We expect revenue growth to exceed 12% in 2024.

While continuing double digit revenue growth will help, a second potential driver is that new CEO Jassy seems to have decided to increase the focus on earnings growth. This is available to Amazon if it chooses to do so. If he continues that trend, it could be a catalyst to share appreciation. For example, Prime remains a distinct bargain as it not only includes free shipping but also a number of other benefits such as video streaming of movies and TV shows, some free eBooks, discounts at Whole Foods and more. Given that Prime has over 220 million members, a $20/year increase for the subscription or additional monetization of content in that amount per user (which equates to less than one extra movie or TV series purchased every 4 months) would add over $4.4 billion to revenue once it fully rolls out. Such an increase is worth about $8 per share of earnings. Additionally, the company has meaningful AI technology that could drive additional revenue. Amazon has also been trimming costs (as a percentage of revenue). Given this combination, we expect earnings to grow faster than revenue in 2024.

5. Data Dog will outperform the market (it closed at $121.65 per share)

Like many other high growth subscription-based software companies, Datadog experienced another solid year in 2023 with Q3 revenue growth at 26.7%. Also, like CrowdStrike, Datadog has a very high gross margin (GM) and is now at the point where it has started to leverage its GM driving up earnings (+96%) at a much faster rate than revenue. While the stock was up 66% in 2023, it is still down 32% over 2 years despite Q3 2023 revenue being 195% higher than Q3 2021.

6. The Trade desk (TTD) will outperform the market (it closed at $71.80 per share)

Every 4 years we point out that political spending in a Presidential election year adds an additional layer of revenue to the advertising space helping it have an above normal year of growth. In 2024 there are 3 additional factors that should help drive accelerated growth (discussed in prediction 9). CTV (Connected TV) has been gaining share of the space and The Trade Desk remains a leader in CTV. Analysts are forecasting 20% revenue growth for the company in 2024. We believe an increased market size coupled with share gains should help TTD grow revenue at an even greater rate. We believe such a result will lead to another year of solid stock performance.

7. Nvidia will outperform the market (it closed at 495.22 per share on December 31, 2023)

Nvidia is one of the strongest ways to invest in the coming AI evolution. Its generative AI-optimized GPUs have a technology lead on its competition and are needed by companies moving to AI. The demand for such a product currently exceeds supply, giving the company several quarters of backlog. Because of the shortage supply coupled with a superior product Nvidia has significant pricing power. 

In Q3 the company’s revenue grew over 200%. Because its gross margin was up to 75% the combination drove earnings of $4.02 for the quarter up nearly 7X from the prior year’s $0.58. Based on current earnings forecasts the stock is not expensive, trading at about 30X analyst earnings forecast for fiscal 2025 (year ending in January 2025).

Make no mistake, this will be a volatile stock given its startling growth. The question of whether current pricing can be maintained as stronger competition emerges could be an overhang. AMD launched a competitive product in December. It expects to ship as much as 400,000 GPUs in 2024. But, to put it in perspective relative to demand, Nvidia is forecasting shipping 1.5-2.0 million GPUs this year up from about 550,000 in 2023. This would mean AMD is projecting unit sales of about 25% of Nvidia units in 2024. It seems unlikely that AMD will try to force down pricing in 2024. Also, in general, the cost of manufacturing chips declines as a product matures so even if pricing declines 20%, gross margins could remain close to where they currently are. Intel is also working on becoming a leader in AI. It has several products and numerous customers but appears to be trailing Nvidia (and AMD) in technology.

A second potential issue for Nvidia is sales to China which comprised over 20% of its sales in Q3. The US government has restrictions on selling the most advanced technology to Chinese companies and Nvidia believes it has complied. The company also stated that it expects the percent of sales to China to decline in Q4.

For now, we believe Nvidia will continue its momentum throughout 2024 and beyond. Given that demand is growing rapidly (there are forecasts that 80% of all PC sales will be AI enabled in 4-5 years) pricing pressure that causes significant GM decline appears unlikely to emerge in the next 2-3 years. As we saw in the PC space (where Intel controlled things), as pricing on older chips declined, users tended to buy newer technology meaning that instead of paying less for the older product they paid what they had before for a more powerful product. It appears that the AI space is still young enough to replicate this trend.

8. Other “AI” Companies will emerge as strong performers.

Like the PC revolution in the 90s and the web from 2000 onward, AI appears to be a new generation for products that will lead to existing companies re-inventing themselves and new ones emerging. Each of the prior decades-long trends spawned numerous successes. It appears  that AI will be the next generational change in technology. It will dominate thoughts on Wall Street for the next decade or more with numerous winners emerging. While it’s hard for us to tell who else besides Nvidia, CrowdStrike and Tesla will distinguish itself as an AI leader and generate high revenue growth rates there are a number of candidates that are at the table.

In the chip world, AMD seems a strong candidate. Intel is trying to transform itself to another candidate but it has a large share of existing sales, so it needs to become a leader to generate enough new revenue to offset its loss of more traditional sales. IBM is inserting AI chips into its products which could mean a resurgence of demand for servers at higher pricing and margins. The same could be said for PC manufacturers.

While chips and hardware are the first stage of revenue generation from AI, hosting services from Microsoft, Amazon and others could be the next step in rolling out AI. They can potentially increase pricing and also grow their services. Social networks will also benefit but I’m not sure how someone like Meta can drive enough growth in monetization.

Security is already an important use of AI and CrowdStrike has utilized it to great effect. Others like SentenilOne are following in their footsteps. Gaming is another arena where AI will be important. And autos need to utilize it if autonomous self-driving cars are to become dominant. Tesla is at the forefront in creating such success with Waymo another very important player.

One of the most exciting arenas for AI is in robotics. Tesla is working on a robot that will heavily utilize AI to manage its movements, but a commercial product seems years away.

9. Furniture and Home accessories will stage a comeback in 2024, returning to growth.

Not surprisingly, home sales diminish when higher interest rates on mortgages increase the cost of ownership. And when this happens very quickly sellers are slow to reduce prices to reflect the inability of buyers to pay the same price as when rates were lower. The result last year was that US home sales hit a 30-year low. Additionally, homeowners taking out loans to remodel also stalled due to the higher rates. Sales of furniture and related accessories are highly correlated to home purchases and home remodels and were down 5-10% in 2023 vs 2022. Now that some time has passed where owners had difficulty selling their homes many are lowering prices making the cost of ownership more affordable. Also, The Fed is expected to stabilize and then reduce rates this year. This combination should lead to more home purchases and home remodels. Given the “easy comps” and built-up demand we expect furniture and related accessory sales to return to double digit growth during 2024 after a year of declining revenue.

10. Advertising revenue will have a comeback in 2024.

Advertising revenue was hurt last year by the economy as well as several short-term issues like the decline in furniture sales discussed in prediction 9. Many advertisers cut back spending due to issues with the economy. Stable interest rates should lead to increased spending by advertisers of goods and services.

Advertising also took a major hit from strikes in the auto industry and Hollywood. In each case this led to a loss of ad revenue. Without many new movies and shows media advertising was cut dramatically (no pun meant). And of course, GM, Stellantis (formally Fiat/Chrysler) and Ford cut their spending during the union strike.

Political spending on advertising mostly occurs in even years when the bulk of elections take place. Every fourth year this is boosted by the presidential primaries and election. Group M estimates that advertising spending (excluding about $1B spent on direct mail) will be about $16 billion dollars this year, up over 31% from the 2020 election year. While the bulk of the dollars will be spent on TV, online platforms like Facebook and Google will benefit as well. This also is likely to be the first presidential election where AI tools are used to improve targeting of potential campaign contributors.

Recap of 2023 Top Ten Predictions

Our predictions for 2023 were all fulfilled with the stock portion providing extremely strong performance. This was on the heels of poor performance in 2022 as it was one of the worst years in the past 50 for the stock market in general, and for my stocks in particular. In delineating the stock recommendations in our Top Ten predictions for 2023 we pointed out that the 6 stocks, on average had fallen nearly 49% in 2022 despite average revenue growth of about 38%. Since we expected all 6 to continue to grow in 2023 (and both Amazon and Shopify to increase their growth rates), we felt they were all poised for a recovery. This clearly proved accurate.

What went right for my stock picks in 2023 was great company results coupled with the benefit of an apparent end to the rate hike cycle. I have always pointed out that I am not amongst the best at forecasting the market as a whole but have been very strong at selecting great companies which over the long term (5 years or more) typically have solid stock appreciation if their operating performance is consistently good. But even great company’s stock performance can be heavily impacted in any given year by market conditions. Two key drivers of negative market conditions in 2022 were the huge spike in inflation coupled by the Fed raising rates to battle it.

At the beginning of 2023 we felt that inflation would be on the decline from its peak of 9.1% in June 2022 (see prediction 9). Given the expected decline in inflation we believed the Fed would slow and then stop increasing interest rates. Since the rise in interest rates was a major reason for the decline in our long-duration stocks, we believed that slowing and then stopping this rise would be a factor in driving elevated stock performance.

So, the big question for the market at the beginning of 2023 was whether the expected additional rate increases projected at just under 1% for the year (which theoretically was built into share prices at the end of 2022) would be enough for The Fed. It pretty much was as the Fed raised rates 1.0% during the year but stopped making increases after July and subsequently indicated that rates could start declining in 2024.

Stocks reacted well to what appears to be end of the upward climb in rates and tech stocks reacted particularly well as long duration investments tend to be influenced greatly by rate changes. Coupling this with what appears to be a soft landing created a positive environment for our recommended stocks.

Our six recommended stocks were up an average of 96% with 3 of the 6 appreciating over 100%. While we will have a longer discussion of the reasoning behind it in our next post, we wanted to disclose that all 6 will be recommendations in our 2024 Top Ten.

2023 Stock Recommendations

  1. Tesla will outperform the market (it closed 2022 at $123.18/share)

As usual, Tesla was a wild ride in 2023. Partly, this was based on continued controversy surrounding Elon especially his actions post his October 2022 purchase of Twitter (now called X). But in addition, concerns over price drops, potential slowing momentum of Battery Electric Vehicles, challenges to Tesla market share and more weighed on the stock at times. These concerns buried the stock in 2022. In 2023 they continued to be sighted by shorts but proved overblown as the company reached its unit sales target of 1.8 million vehicles (up 40%), launched the CyberTruck in Q4 and substantially increased its market share of overall vehicles sold. As a result, Tesla stock was very strong in 2023 and closed the year at $248.48/share, a rise of 102%.

2. CrowdStrike (Crwd) will outperform the market (it closed 2022 at $105.29/share)

The most recently reported quarter for CrowdStrike, Q3 FY24 was another strong one as the pandemic had little impact on its results. Revenue was up over 35% and earnings 105%. Existing customers continued to expand use of the company’s products driving Net Revenue Retention to exceed 120% for the 20th consecutive quarter. The company’s stock, which had declined nearly 50% in 2022 (despite a revenue increase of 54%), had a dramatic recovery. It closed 2023 at $255.17/share, up 142%.

3. Amazon will outperform the market (it closed 2022 at $84.00/share)

As we expected, Amazon improved revenue growth in each quarter of 2023 from its low point of 8.6% in Q4 2022. In Q3 2023 growth was back to 12.6%. Additionally, the company increased its focus on profitability with Q3 profits up well over 200% versus the prior year’s weak numbers. This coupled with the improved environment for tech stocks helped drive Amazon’s share price to $151.75 at year end, up 81% from the close on December 31, 2022.

4. The Trade Desk (TTD) will outperform the market (it closed 2022 at $44.83/share)

Fears of a potential recession caused great concern for advertising revenue. After dropping sequentially in Q4 2022 (to 24.1%) and again in Q1 2023 (to 21.5%) TTD’s revenue growth began recovering in Q2 (to 23.1%) and again in Q3 (to 27.7%). The stock reacted well to the improvement and closed 2023 at $71.80 up 60% from year end 2022.

5. Datadog will outperform the market (it closed 2022 at $73.50/share)

Like many other high growth subscription-based software companies, Datadog experienced another solid year in 2023 with Q3 revenue growth at 26.7%. Also, like CrowdStrike, Datadog has a very high gross margin (GM) and is now at the point where it has started to leverage its GM driving up earnings (+96%) at a much faster rate than revenue. This level of success helped Datadog stock close the year at $121.65/share, up 66%. 

6. Shopify (Shop) will outperform the market (it closed at $34.71/share)

In our post of Top Ten predictions, we pointed out that the pandemic had created a major warping of Shop revenue growth.  Instead of the normal decline for high growth companies from its 47% level in 2019 it jumped to 86% growth in 2020 and still was above “normal” at 57% in 2021. Once physical retail normalized in 2022, Shopify growth plunged against the elevated comps declining to a nadir of 16% in Q2, 2022. When we included Shop in our Top Ten for 2023, we pointed out that we expected its revenue growth to return to 20% or more throughout 2023. This indeed did occur and the stock reacted well, closing the year at $77.88 up 124% year/year.

Non-Stock Specific Predictions

While I usually have a wide spectrum of other predictions, last year I wanted to focus on some pressing issues for my 3 predictions that are in addition to the fun one. These issues are Covid, inflation and California’s ongoing drought. They have been dominating many people’s thoughts for the past 3 years or more.

7. The Warriors will improve in the second half of the current season and make the Playoffs

This forecast proved correct as I expected the Warriors to make the playoffs but be unsuccessful at winning a title. They did rally in the latter part of the season to finish 6th (avoiding the play-in) and won the series against the Kings but failed to progress to the Western Finals.

8. Desalination, the key to ending long term drought, will make progress in California

Some of the pressure to create desalination plants throughout California was reduced by substantial rainfall last year that ended the drought and filled reservoirs. Despite this there was progress as the California Coastal Commission approved a $140 million desalination plant in Orange County (at Dana point) in late 2022. Resistance to its construction has been mounted by environmental groups but in 2023 the planning continued to move forward.

In April 2023, the Department of Water Resources (DWR) announced 3 more projects that will receive support from DWR and an additional 6 projects that will receive funds through a partnership with the National Alliance for Water Innovation. While the total water generated through all projects currently approved is still far short of fulfilling California needs, the tide seems to have begun to turn (no pun meant) towards favoring use of desalination.

9. Inflation will continue to moderate in 2023

This forecast proved pretty accurate as inflation moderated to just over 3% in 2023 (very slightly higher than my projected range). It was at 6.3% when I made the forecast.

10. Covid’s Impact on society in the US will be close to zero by the end of 2023

I consider this prediction mostly right. On the positive side I believe Covid no longer has much influence on people venturing out to shop, dine, go to the theater, travel, etc. Even cruise lines are experiencing a substantial return towards normal. The number of new Covid cases has waned significantly and deaths from it are close to zero. However, I would not say we’re quite at zero impact as there are still some spikes (of modest magnitude versus before) that cause concern to a portion of the population.

EVs will dominate new car sales within 5-6 years

What does that mean for Tesla and others?

EVs include both BEVs (Battery Electric Vehicles) and PHEVs (Plug-In Hybrid Electric Vehicles). We’ll start with a top-down view and then go into substantial detail regarding Tesla followed by some overall discussion of Rivian and Lucid.

California is taking the lead in banning sales of new gas-powered cars by 2035.

In August 2021, President Biden issued an Executive Order setting a target that by 2030, 50% of all new vehicles sold in the US will be net zero emitters of greenhouse gasses. He has recently added a goal of 60% by 2032. California has drawn a line in the sand regarding legislating the end of gas-powered vehicles. A measure approved by the California Air Resources Board requires all new light vehicles (passenger cars, SUVs and pick-up trucks) sold in the state in 2035 or later to generate zero emissions. It is a little unclear whether this will allow PHEVs to be sold, as they do generate emissions, but my reading suggests that PHEV models that can be charged at a charging station are probably not currently part of the ban. I expect this to change and believe PHEVs will be banned as well or fall to minimum sales once the conditions for BEVs described below are met. Six other states have already followed California’s lead: Maryland, Massachusetts, New Jersey, New York, Oregon, and Washington. Numerous other states are in the process of considering moving in the same or an even more aggressive direction.

I believe that most of the country and the rest of the world will follow in this direction (unless lobbying efforts slow progress) as the following issues are already or likely to be met by 2030:

  1. BEVs must offer enough driving range to make buyers comfortable;
  2. BEVs with the right characteristics need to become more affordable;
  3. There must be close to the same access to charging stations as gas cars have to gas stations.

Driving Range on dozens of BEVs will likely exceed 500 miles by 2030.

For perspective consider that (according to Electrek) in 2012 there were only 9 EVs available, 8 of which were Hybrids that, on average, could only drive about 70 miles on the battery. The 9th was the Tesla Model S which had a range of 265 miles but cost about $90,000. As late as 2016, there was still only one pure BEV with a driving range of over 300 miles, the Tesla Model S. By 2021, this number had expanded to 5, 3 of which were Tesla models. As of August 2023, there are 14 models with that range including 4 from Tesla, 2 from Rivian and one from Lucid. Lucid has the longest range, 520 miles, but the two Rivians and the Tesla Model S Long Range all are over 400 miles. The list includes 2 models from Ford, two from BMW, plus one each from Mercedes, Kia and Hyundai. What this suggests is that further increases in driving range are not only possible but extremely likely (in fact preliminary reports indicate the next version of the Tesla Model 3 due in 2024 will move to over 400 miles of driving range). I believe that in 7 years, or even sooner, there will be numerous models that have a range of over 500 miles, including all Tesla models, all Rivians and all Lucids. This is a technology issue and as we’ve seen with computers and phones, technology delivers better performance every year.

Affordability is already here…sort of!

The standard Model 3 is listed on Tesla’s website as having a manufacturers suggested retail price of $32,740 after the federal EV tax credit. But California also provides a state tax credit of $7500. After that credit the price drops to $25,240, $1,000 less than a gas-powered Toyota Camry. That doesn’t even consider the lower cost of service and fuel, or the higher resale value of the Tesla. This has led to the Model 3 replacing the Camry as the best-selling car in California, This depends on tax credits so we’re not quite at parity yet on affordability but given the trend we should be in several years.

Charging availability is increasing rapidly.

According to the Department of Energy, the number of charging stations in the US increased from 5,070 in 2011 to 143,711 at the end of 2022. This represents a compound annual growth rate of about 35.5%. The stations have also improved in their speed to charge. It is also easy to install a power line at home to be able to charge the vehicle every night, eliminating the need to use a charging station other than for long trips. Gas powered cars do not offer this convenience. For example, my wife and I recently went from our home in Atherton to Napa for a weekend, a distance of about 90 miles each way. In total, including visiting wineries and restaurants, we drove 340 miles. We never charged the car during the trip as her Tesla’s range is over 400 miles. There are currently over 145,000 gas stations in the US. The number of locations with charging stations now exceeds 54,000. At the historic  growth rate of over 35% this would mean that the number of charging locations could exceed the number of gas stations by the end of 2026. It is also likely that the number of gas stations could decline as the install base of gas-powered vehicles declines.

Sales of BEVs have reached an inflection point.

In 2022 worldwide sales of light vehicles (passenger cars, SUVs and pickup trucks) EVs reached over 10.5 million units, up 55% year/year. This occurred despite the sales of all light vehicles declining slightly versus 2021.

To understand where this is going, we initially need to produce a forecast for total light vehicle unit sales (which, for simplicity we’ll refer to as “cars”) in 2030. I have assumed that by 2026 global unit sales would return to 2018 levels which was 93.7 million according to IHS Markit. I then assumed the volume would grow by 2% per year through 2030. Some would argue that given population growth, matching 2018 volumes 3 years from now is too conservative. Others will say we will not get back to that level. I believe this to be a middle of the road assumption.

The second question is what share will BEVs be of total auto sales? In the table below I show a range that varies from 30% to 70% (BEVs are over 10% in 2023). If we apply the Biden 50% minimum goal for the US to worldwide sales, then the 2030 number would be 50% of 101.4 million units or 50.7 million units. This would mean an 8-year compound growth rate of 26.6% for unit sales of BEVs (it grew about 60% in 2022). Obviously, this is not an exact science!

I expect Tesla unit sales to be about 8X 2022 levels in 2030.

In 2022 Tesla sold over 1.3 million BEV autos which was 17.1% of the BEV market. That is far from the full story as they did not participate in several large categories of vehicles: pickup trucks, low-cost autos, and sports cars. Their share was over 30% in the categories they did participate in. I believe that by 2030 Tesla will have added all three of these categories to its lineup. If we take the middle row and column of the above chart: BEVs have 50% market share and Tesla sells 20% of BEVs (which is 1/3 share lower than they currently have in categories in which they participate). That would mean Tesla will sell 10.14 million vehicles in 2030. If they did, the company would have an 8-year CAGR of 29%. This is well below the 50% growth they are tracking towards this year but of course the law of large numbers predicts a decline in high growth rates.  

Tesla Stock did not reflect strong expectations in 2022.

Despite revenue growth of over 50%, Tesla was one of the worst stocks in 2022. Partly this was due to fears that Elon’s acquisition of Twitter would be a distraction, partly it was due to the backlog shrinking and partly it was due to Elon liquidating a number of shares to finance the Twitter acquisition. In H1 2023 Tesla was one of the best stocks in the market (appreciating over 110%) as the backlog began to (slightly) expand again, Elon stopped selling shares (and promised to hold his position for the rest of 2023) and the Twitter acquisition became less of an issue to investors. It should be noted that as of September 10, Tesla shares have slipped by about 5% from the June 30 value over new fears that Tesla price cuts were hurting earnings. It was obvious to us that the price cuts were to leverage superior manufacturing cost and drive increased volume and this has in fact occurred, but Tesla will remain a volatile stock which is why premiums on Tesla calls are quite high.

Unlike some, we believe Tesla was smart to raise prices substantially in 2021 and 2022 while they could not meet demand. Then we believe they were smart to lower prices once their manufacturing capacity expanded, and backlog shrunk to a more normal level. Lowering prices places tremendous stress on the competition as Tesla has significant margin advantages over its competitors. Its net margins are still strong at lower prices, but many competitors don’t have the room to maintain margins at lower prices. Additionally, lowering prices on Tesla mass market vehicles meant that many Model Ys and Model 3s qualified for the US $7500 tax credit for electric vehicles that started on January 1, 2023. Nonetheless, the level of price decreases is worth monitoring as it does lower Tesla gross margins.

We expect Tesla unit sales to increase 45% to 55% in 2023.

Despite rising slightly in H1, the decrease in the Tesla backlog remains a concern to investors. At year end it was at about 44 days of production (or roughly ½ of units sold in Q4). While there are many elements to consider, some investors have a concern that it will be difficult for Tesla to achieve or exceed its target of 40% vehicle sales unit growth in 2023. Given already announced sales in Q2, Tesla unit sales were up 60% in H1. However, this includes a very weak comp in Q2 2022 due to China being closed for part of Q2 last year. Still if the company merely replicates Q2 sales in Q3 and Q4 for existing vehicles and adds sales of the Cybertruck to this total, 2023 growth would exceed 45%. There are several factors that indicate they are likely to continue to increase sales sequentially:

  1. In Q2 Tesla actually shipped more cars than it produced despite increasing production, while backlog remained relatively stable. 
  2. Historically Tesla has seen demand increase sequentially in virtually every quarter. If we assume a 7% increase going forward, then units will be up over 50% year over year in 2023 without any Cybertruck sales.
  3. The Tesla CyberTruck has a waitlist that exceeds 1.5 million vehicles. On August 16 Electrek reported that “truckloads” of Cybertrucks were spotted being delivered. These would not be for consumers but rather for final testing. Tesla has indicated that it will be hosting a launch date for the vehicle and speculation is that it will be quite soon. They then will begin building towards volume production starting in Q4. If existing product sales fall short of the 7% sequential increase in Q3 and Q4, sales of the CyberTruck could make up for the difference as these sales will be incremental to the current run rate for existing vehicles.
  4. The company now has the manufacturing capacity to increase volumes – the question will be parts supply and whether demand will be strong if the economy goes into a recession.

Despite a reduction in its backlog in 2022, demand for its vehicles continues to increase. As you hear of new competition in the electric vehicle market keep in mind that Tesla share of the US market for ALL cars is still only about 3% and in China and Europe it remains under 2%. As a comparison Toyota worldwide market share is over 13% and VW is not far behind. We estimate that Tesla’s share of BEVs in the categories it plays in is over 30%. Once it launches the Cybertruck it will increase its available market (TAM) substantially. But it will still need to launch a low-priced vehicle (in the $25,000 – $30,000 range) and a sports car (which it is working on) over the next 3-5 years to address the total market. As the world transitions to electric vehicles, we expect Tesla’s share of all auto sales to rise substantially even as it declines in dominance of the electric vehicle market. When the CyberTruck begins shipping, Tesla total backlog is likely to increase to over 1.6 million vehicles. And the CyberTruck current backlog isn’t expected to be fulfilled until late 2027! 

Tesla Margins

Tesla gross margins declined in Q1, as price decreases had an impact. In Q2 Tesla made further price decreases but this was partially offset by improved efficiency in newly launched factories in Berlin and Texas. While lower vehicle prices in 2023 and increasing cost of parts will place some pressure on gross margins, we still believe they will continue to remain by far the highest of any auto manufacturer:

  • Tesla, like Apple did for phones, is increasing the high margin software and subscription components of sales;
  • Add-on sales are likely to offset a portion of price decreases;
  • As its new factories ramp they will increase their efficiency; and
  • Tesla will have lower shipping cost to European buyers as the new Berlin factory reaches volume production.
  • A decline in gross margins can be at least partly offset by SG&A declining as a percentage of sales as revenue growth is likely to be higher than any increase in SG&A.

Revenue in the Semi category could surpass $10 billion in a few years.

To date the Tesla Semi has been produced in very small volumes and limited production capacity will mean deliveries will remain low during the next few quarters. We believe the ramping of Semi production will begin in late 2024 as the company only has a small number in customers’ hands today (essentially for test purposes). However, given its superior cost per mile the Semi is likely to become a major factor in the industry. Despite its price starting at $150,000, its cost per mile appears lower than any competitive products. Given potential of up to $40,000 in US government incentives the competitive advantage over diesels will be even greater. The company is expecting to increase production to about 50,000 per year by some time in 2025 (which would represent potential incremental high margin annual sales in the $8-$10 billion range). While this is ambitious, the demand could exceed that as it represents a single digit percent of the worldwide market for a product that should have the lowest cost/mile of any in the semi category.

Tesla Expects to launch a new Roadster in 2024

The new version of the roadster is being developed but it’s unclear when it will be ready for production as the target date has slipped multiple times. Right now, Tesla expects the launch to be in 2024. Once it launches, it will become another source of incremental demand at high margins. The early claims are that it will have a driving range of over 600 miles (at reasonable speeds), a top speed of 250 miles/hour, go zero to 60 in 1.9 seconds and cost about $200,000 for the standard model. This would make it faster than a McLaren.

The Bottom Line: Tesla should continue to have accelerated revenue growth in Autos.

This all points to solid revenue growth continuing (but at a lower level than unit sales growth in 2023), strong GMs in 2023 and beyond, and earnings escalation likely faster than gross margin dollar growth. While the company has reduced pricing, the ability to sell greater dollars in software should help maintain strong AOV and gross margins.

Tesla is not a one trick pony – it has several other potentially large revenue streams.

There are numerous other revenue sources for Tesla, especially on the energy side given its strong solar offerings and best-in-class power walls. Tesla also is a leader in automated driving and should that reach commercialization for “driverless taxis/driver services” the company is well positioned to add a substantial revenue stream. The discussion above regarding charging stations did not include the fact that Tesla is the runaway leader in this category (it just reached 50,000 units deployed) and its technology is probably going to become the standard. So, while I believe the vast majority of charging will take place in the home, Tesla will add another revenue stream from their infrastructure. Recently GM, Ford and Rivian have all decided to move to the Tesla charging technology.

Finally, there is some possibility that Tesla’s Optima Robot project will, at some point in the future, lead to launching smart robots that can perform numerous tasks. The company has taken its AI developed for autos as well as the variety of sensors integrated into a vehicle and transformed them to apply to robotics. At their AI day 11 months ago, they were able to demonstrate a humanoid alpha version that could walk with knowledge of what was in front of it and around it. The robot could also pick up objects and perform other simple tasks. We expect a significant leap forward at this year’s AI day scheduled for September 30. Elon, who tends towards optimistic thinking, has stated that he believes revenue from the Optima could exceed Auto revenue at some point in time!

A few comments on Rivian.

Rivian has gotten quite a bit of press regarding its opportunity to be one of the leaders in BEV pickup trucks and SUVs. The Rivian R1T electric pickup truck has recently earned the J.D. Power award for the most satisfying experience among BEVs (Tesla was second). The study, released in February, benchmarked EV owner satisfaction with critical attributes that affect the EV ownership experience. Reviewing 2022 and 2023 model year battery electric and plug-in hybrid vehicles, EV owners found R1T to be best among premium battery electric vehicles for driving enjoyment, vehicle quality and reliability, service experience, interior/exterior styling, cost of ownership, ease of charging at home and accuracy of stated battery range.

Cars.com reviews gave Rivian a 5.0 out of 5.0 rating with 100% of customers saying they would recommend it. A second review site, Edmunds, with a minimal number of reviews, was less favorable as most reviewers rated it highly, but several reviewers liked the vehicle but were dissatisfied with the quality of service. We believe the JD Power survey to be the most reliable. The strong customer experience positions the company for accelerated top line growth. In Q2 revenue was up over 200% year/year and unit sales increased 59% sequentially. Rivian also increased their guidance of how many vehicles they will ship this year to 52,000. Despite the Ford F150 pickup being touted as the clear leader in the category, CNBC reported that Rivian actually sold more electric pickup trucks in the US in H1 than anyone else. In a recent survey by Car Guru, 43% of potential truck buyers said they favored buying an electric vehicle.

Rivian also has an order to build 100,000 electric vans for Amazon. Amazon says it has taken delivery of 5,000 already and I have recently seen a few on the road in the SF Bay Area. I asked the driver of one what she thought of the product. Her reply was that it was quite an improvement versus her prior van. In searching for other products that compete there appear to be numerous others manufacturing this type of product. It’s hard to tell if the Rivian van has an overall advantage but it does seem to have the longest range of any that I found. This appears to be a very large opportunity for Rivian as the price of its vans start at $60,000 so the existing Amazon order is worth at least $6 billion (5.4X Q2 Rivian revenue) and Amazon could decide to expand the order. The fact that its competitors does not include Tesla puts Rivian in a strong position.

Given the quality of its vehicles, Rivian is well positioned to scale if they can fix their economics. In Q2 gross margins on its vehicles improved by $35,000/vehicle over a year earlier but still came in at a loss of $412 million. If the company can move to profitability (a target it expects to reach in late 2024) without compromising vehicle quality, it could be a very strong performing stock. The risk that they don’t get there before running out of cash has kept the stock value low.

Lucid appears to be struggling.

Lucid produces a very high-end electric sedan that directly competes with the Tesla Model S. The Lucid Air is more luxurious and has a longer driving range than the Tesla but also costs more. The product gets great reviews from magazines like Car & Driver who said: “ As luxury electric sedans go, the Air is a home run, delivering a posh overall experience with an unbeatable driving range.” Given such accolades many thought the Air would be a worthy competitor to Tesla. However, consumers have not embraced the product as their reviews are just OK. Cars.com reviewers gave it an average rating of 3.3 out of 5 and only 46% of those reviewed said they would recommend it. As a comparison the Tesla Model S received a 4.0 average rating and 80% of reviewers said they would recommend the car. Admittedly, the number of reviews was small, but this is still an issue for Lucid.

Lucid appears to have lost momentum in the marketplace as Q2 sales of 1,404 units were flat compared to Q1 and fell well short of Wall Street expectations of 2,000 units. This also put into question whether Lucid was successfully converting the 28,000 reservations it had previously disclosed.

On the positive side, Lucid is extremely well funded and struck two interesting deals in the quarter:

  1. To supply Aston Martin with power trains, battery systems and related technology in a deal worth $232 million.
  2. To begin sending cars to Saudi Arabia which may help relieve the company’s inventory build up as it produced over 1,700 more vehicles than it sold in H1.

Both deals must be taken with a grain of salt as the Saudi Arabia Public Investment Fund is a major backer of both Lucid and Aston Martin.

Lucid will be launching new lower priced vehicles going forward so it still remains a company with potential given its ample capital, quality technology and well-designed vehicle. But, unlike Rivian which has carved out a niche where Tesla is not a direct competitor (now or in the near future), Lucid will have to find a way to be more successful versus this dynamo.

Top Ten List for 2022

The past year has been extremely busy for me and the decline in blogs produced has been one of the consequences. On the one hand, I’m mortified that my annual Top Ten list has been delayed by 2 months. On the other hand, it turns out that the steep decline in tech valuations affords an opportunity for acquiring recommended stocks at much lower cost than they were on January 2. Because I don’t want to delay recommendations further, I am going to publish the recap of 2021 picks after the new Top Ten blog is out. Suffice it to say the recap will be of a down year after posting my best year ever in 2020, but that means (at least to me) that there is now an opportunity to build a portfolio around great companies at opportune pricing.

Starting in November of 2021 the Tech sector has taken a beating as inflation, potential interest rate spikes, the Russian threat to the Ukraine (followed by an invasion), a Covid jump due to Omicron and supply chain issues all have contributed to fear, especially regarding high multiple stocks. What is interesting is that the company performance of those I like continues to be stellar, but their stocks are not reflecting that. For 2022, the 6 stocks I’m recommending are Tesla, DocuSign, Amazon, Zoom, CrowdStrike and Shopify (the only new one on my list).

In the introduction to my picks last year, I pointed out that over time share appreciation tends to correlate to revenue growth. This clearly did not occur over the last 14 months as illustrated in Table 1.

The average revenue gain in the last quarter reported by these companies was 43%, while the average stock in the group was down 17%. It should also be noted that Amazon reported that its major profit driver, AWS, had grown 40% while eCommerce had been relatively flat year over year and the stock reacted positively due to the AWS increase. Over time I expect share performance to be highly correlated to revenue growth, but clearly that has not been the case for the past 14 months. Shopify, Zoom, DocuSign and Amazon had revenue growth largely distorted by Covid, with 2020 growth being well above their norm and 2021 growth coming down dramatically. This caused their stocks to plummet as the interpretation of 2021 results was that long term growth had slowed. Yet in all cases the 2-year compound growth rate was well above the previous norm.

Table 2 highlights this abnormality.

In Q3 2019, Zoom’s revenue growth was 85%. Such a high rate of growth usually declines each year barring some abnormal situation. Instead, the growth rate soared in 2020 and the jump was followed by additional growth in 2021. The 2-year CAGR was 151% and Zoom had over 6 times the revenue in Q3 2021 than it did 2 years earlier. Yet, its share price is now roughly only 10% above where it was 2 years ago and down 63% from January 1, 2021. While Zoom is the most extreme situation of the four companies in Table 2, each of the other three have had a similar whipsaw of its revenue growth rate and in each case its stock soared in 2020 only to heavily trail revenue growth in 2021 despite its 2-year CAGR being above pre-pandemic levels in every case. While revenue growth at Tesla and CrowdStrike were not impacted in a similar way by the pandemic as both had more normal revenue growth patterns in 2020 and 2021, they still saw share performance significantly trail revenue growth for the past year.

Given the compression in revenue multiples across the board in tech stocks, the opportunity for investing appears timely to me. Of course, I cannot predict that the roughly 59% average decline in revenue multiple among these stocks represents the bottom…as I never know where the bottom is.

2022 Stock Recommendations (Note: base prices are as of February 25, 2022)

  1. Tesla will continue to outperform the market (it closed at $810/share)

a. Tesla demand has far outstripped supply, as backlog increased steadily during 2021. And this is before the Cyber Truck with it’s over a million pre-orders, has come to market. This has been partly based on a substantial surge in demand and partly due to a shortage of some parts. While Tesla has made and will continue to drive up capacity by launching multiple new factories, supply of parts has prevented the factories from operating at capacity. Rather than overspending to secure more supply (a major error by Peloton), Tesla has chosen to raise prices and to prioritize production of more expensive (and more profitable) versions of its products. As of December 31, wait times for the standard Model 3, Model Y and Model S were approximately 10-11 months while the more expensive high-performance version of each had delivery times of 2-3 months. For the Model X, delivery dates were even longer. As we forecast in prior letters, Tesla gross margins have been rising and in its most recently announced fourth quarter were the highest in the industry. Yet, we believe they will still go up from here as:

  • Tesla, like Apple did for phones, is increasing the high margin software and subscription components of sales;
  • the full impact of recent price increases is not yet in the numbers;
  • its factories are not yet operating at full efficiency; and
  • Tesla will have lower shipping cost to European buyers once the Berlin factory begins to ramp.

b. Cyber Truck preorders are now estimated at over 1.25 million units (approximately $79 billion in sales value) according to a fan tracker site, or 50% more potential revenue than 2021 total revenue. Obviously, some of the orders will be cancelled given the long wait times before delivery, but still, this virtually assures large revenue increases for 2022 and 2023, only gated by obtaining enough supply of parts. The Cyber Truck is not expected to ship until mid-2022 and is not material to meeting revenue forecasts for this year. The Tesla Semi appears close to being ready to go into production, but battery constraints will probably mean any deliveries will be truly minimal for Q1 (Pepsi expects to take delivery of at least 15 in the near term). The Berlin factory, a key to increasing its share in Europe, will likely begin manufacturing in the first half of 2022. What this all points to is high revenue growth continuing, stronger  GMs in 2022, and earnings escalation likely faster than revenue growth. While revenue growth is gated by supply constraints it should still be quite strong. And the high backlog not only assures that 2023 will be another high growth year but also means there is little pressure on Tesla pricing.

  1. Shopify will outperform the market (it closed at $677 per share)

Shopify, like Amazon, Zoom and DocuSign experienced elevated growth in 2020. This was due to Covid keeping people out of stores (many of which weren’t even open). If we look at pre-Covid growth the company’s revenue increased by 45% year/year in Q3 2019. A year later revenue growth had escalated to 96% due to Covid.  In Q3 2021 growth was 46%, returning to pre-Covid levels. The compound 2-year rate of growth was 70%. If Shopify can continue at a 35-40% revenue growth rate it will mean it has absorbed its higher level of revenue and is growing quite nicely from there.

Shopify has established a clear leadership position as the enabler of eCommerce sites. Its U.S. eCommerce market share, at 10.3% in 2021, is second to Amazon and well ahead of its closest competitors Walmart, eBay, and Apple. Net revenue retention for the company continues to be well over 100% as Shopify has successfully expanded services it provides to its eCommerce business customers. Additionally, because successful eCommerce companies are growing, Shopify also grows its portion of the customer revenue it shares.  I expect continued growth to be well over 30% for several more years given three things:

a. Ecommerce should continue to take share from offline.

b. We expect Shopify to continue to gain share of Ecommerce.

c. Shopify will leverage expanded services leading to higher revenue per client.

In 2022 revenue growth is expected to be lower in the first half of the year than the second due to the benefit Covid had on the first half of 2021 and some changes Shopify made in its method of charging customers that took effect in the second half of 2021.

  1. CrowdStrike will outperform the market (it closed at $182 per share)

CrowdStrike continues to gain substantial share of the data security market. Given its leadership position in the newest technology coupled with what is still a modest share of its TAM, the company remains poised for continued high growth. This coupled with over 120% net revenue retention for 12 straight quarters (primarily driven by expanded module purchases) makes CrowdStrike a likely long-term grower at over 50% per year.

The recent threats by Russia to create a Cyber attack on the U.S. could be an additional boost to the entire security industry. CrowdStrike stands to be a disproportionate beneficiary as it has the most advanced technology for defending companies against such attacks.

  1. Amazon will outperform the market (it closed at $3076 per share)

Amazon, like Shopify, benefitted from the substantial number of people who shopped from home in 2020. This caused an expansion of its growth rate from 24% in Q3 2019 to 37% in in Q3 2020. In Q3 2021 growth was down to 15% against the tough compare. Looking at the 2-year compound rate the company appears to have had a modest benefit to growth. We expect the company to return to a 15-20% growth rate in the second half of 2022. This would mean that it has absorbed extra revenue and returned to the normal curve of growth declining. One thing that helped the stock was that higher margin Amazon Web Services (AWS) grew at 40%, much higher than modestly profitable commerce. AWS continues to be quite attractive relative to its peers and its quality and sophistication continues to improve.

A second potential driver for the stock is that new CEO Jassy may decide to increase the focus on earnings growth which is available to Amazon if it chooses to do so. If he does that could be a catalyst to share appreciation. To that end, on the Q4 earnings call the company announced that it would be increasing the cost of Prime by about 17%. This increase will go into effect in Mid-February for new members and in Mid-March for existing members. The impact will roll out over 12 months as existing members renew their annual membership. Despite this increase, Prime remains a distinct bargain as it not only includes free shipping but also a number of other benefits such as video streaming of movies and TV shows, some free eBooks, discounts at Whole Foods and more. Given that Prime has over 200 million members, the increase adds over $4 billion to revenue once it fully rolls out or about 1% of revenue. While this may not appear to be that much, it is worth about $8 per share in pre-tax earnings.

  1. DocuSign will outperform the market (it closed at $115 per share)

DocuSign experienced some of the up and down in growth that Zoom did but to a more moderate extent. Its “normal” pre-Covid growth rate of 40% in Q3 of fiscal 2020 escalated to 53% a year later and then fell back down to 42% in its last reported quarter. As with other high growth stocks DocuSign’s rate would normally have fallen, so the 2-year compound rate of 48% was quite strong. Yet, as I write this letter, the stock is down by over 50% in the past year despite revenue increasing by 42%. This means the multiple of revenue has fallen by about 64% in a year.

As is normal for high growth companies, I expect DocuSign to continue to have a modest decline in revenue escalation from last quarter but believe growth will continue to be above 30% for several years as net retention among enterprise customers (which is 88% of revenue) is over 120% and the company continues to add new customers to this group at a solid pace.  DocuSign is the dominant player in the use of eSignature and other management tools for documents. The use of these tools will be just as important in a post-Covid world.

DocuSign continues to add initiatives to keep Net Retention at or near the 120% level. These include growing its partnership with Salesforce, launching a new release of its software, Agreement Cloud which in addition to eSignature also includes the full cycle of contract creation and management. The company is also working on creating an eNotary product.

  1. Zoom will outperform the market (it closed at $125 per share)

Zoom is a company that has had its revenue trajectory impacted the most by Covid. Before the pandemic, the company was growing revenue at 80%+ in 2019. Such a high growth rate would normally decline the following year but when Covid struck Corporate demand increased by a higher rate than normal and individuals flocked to Zoom in order to maintain some visual contact with friends and family. As a result, Zoom growth peaked at an unheard of 365% in Q2 of fiscal 2021 (reported in calendar Q3 of 2020). As people subsequently began leaving their homes Zoom’s growth was impacted. The corporate side of its business continued to have robust growth with Net Revenue Retention of over 130% as business customers from a year earlier increasing their spend by over 30% including churns. In addition, Zoom had a net add of new customers of 18% of the prior year’s total. Putting those together means that revenue from business customers grew about 45% and continued to grow about 10% sequentially while growth of the consumer side was flattish to slightly down sequentially. Combining the two trends meant that overall growth fell to 35% year over year in Q3 of fiscal 2022 and is expected to decline further in Q4. Looking at the 2-year compound growth rate for revenue in Table 2, one can see that Zoom experienced an elevation to over 150%, nearly double their pre-covid level. We believe that over the longer run Zoom can grow over 30% once the corporate side of its business becomes a bit more dominant and the consumer side begins to show moderate sequential growth. And we expect that sequential growth will begin to rise at some point during calendar 2022 (its fiscal 2023).

GMs were over 81% in FY 2020 (ending January 31, 2020), pre-Covid. The impact of free use to schools with students being on Zoom 8 hours a day, a major expansion of consumer free users, plus paying users expanding use without generating extra revenue (there is no charge for increasing usage) caused GMs to decline to under 70% in FY 2021. By Q3 FY 2022 GM had returned to 76%. We believe further improvement in GMs is inevitable as Covid declines and usage rates diminish without impacting revenue. This should mean that earnings increase at a faster rate than revenue assuming the company keeps G&A growth at or lower than revenue growth.

2022 Non-Stock Invitations

  1. Republicans will recapture at least one of the Senate and House in the Interim elections

Since the Biden administration has taken power, inflation has surged to its highest rate since the Carter administration, the Ukraine crisis has emerged, Covid cases have jumped and Biden leadership and mental sharpness have come into question. While several of these issues may have come to the front no matter who was president, an ABC News/Washington Post poll shows the electorate clearly is dissatisfied. Biden’s approval rating has fallen to 37% and people believe by over a 2 to 1 margin that the Republicans would do a better job handling the economy.  The poll results show that if the House elections were held today, 49% would vote Republican and 42% Democrat. Given how tenuous the Democrats majority is, this would likely lead to a change of control. It is only late February so there is still time for this to change, but many of these issues, especially the economy, may be hard to turn before the November election.

  1. The travel industry will experience robust growth starting in the summer of 2022

The travel industry has had a pretty rocky 2020 and 2021 as Covid elicited substantial fear of boarding a plane, traveling out of the country and/or taking a cruise. In 2021, we did see a return to travel within the U.S. and it was accompanied by increasing prices of hotel rooms and restaurants. It seems clear (to me at least) that people are worn down by Covid and appear ready to resume some of their prior vacation habits. While new Covid cases are still at very high levels (but falling rapidly), the current version is much less deadly than prior ones. In my group of friends, several of us have planned a trip to France in May which will be the first time back in Europe for any of the 4 couples since 2019. While I’m less certain of when cruise lines will be back to normal, I expect them to see some renaissance this year. The only fly in the ointment is how serious the Russian crisis becomes. As of now I believe it will be restricted (from a military point of view) to the Ukraine.

  1. PG&E and other utility companies will battle to dramatically increase what they charge those who convert to solar

There is a massive conflict between the drive to replace energy received from the grid with solar panels. On the one hand the U.S. government provides a 26% tax rebate for installing solar panels. And states like California are pushing to drive more solar through a net metering law (and in the past tax rebates). Also, California is now mandating roof solar panels for all new homes. On the other hand, utility companies like the three in California are battling to increase charges to those that install solar as an offset to the revenue they would lose. The Solar Rights Alliance estimates that “going big on Solar” could save American households over $473 billion over 30 years, whereas “doubling down” on new powerline installation would add $385 billion in cost to American households. When a household converts to solar, energy companies lose revenue and these companies are intent on increasing the cost to solar users to offset this.

Net Metering means a household can sell back excess energy produced to their utility company, which in turn offsets any cost they incur on days when their solar falls short of needs and they need to buy from the utility. The dollars they were entitled to by selling back is then deducted from the bill for energy used. Before 2016 the price the utility company paid for the excess they bought was equal to the price they sold energy back to the consumer. As more homes installed solar the energy companies pushed for a change and in 2016 NEM 2.0 was passed. This allowed the utilities to charge $ 0.03 per kWh for power they sold back to consumers. It also added an interconnect fee of $145 or more to PG&E and different amounts for the other California utility companies. Further, it established a policy of varying rates based on the time of day (which meant higher charges on energy purchased during the middle of very hot days).

Still, as more and more households install solar (including all new homes), the utility companies view it their right to be able to increase charges so they can grow revenue. There has been a push before the California Public Utilities Commission to pass NEM 3.0. It would allow the 3 major utility companies to charge between $56 and $91/month to any home with a new installation of solar. Additionally, it would slash the credit for selling back energy. If it had passed this would have added significant cost to homes with solar and likely reduced the number of existing homes that install it by 70% or more. For now, the public furor over NEM 3.0 caused the PUC to postpone action on this indefinitely. Instead, a large rate increase was granted to PG&E to help pay for remediating their negligence that contributed to California fires.  But this battle is far from over!  I’m expecting some sort of political compromise on new charges to solar homes to occur when the furor dies down. It likely will lower the added charges from the prior proposal but still increase the cost. While I am predicting this increase in 2022, it may not happen until 2023.

  1. If Green comes back at full capacity the Warriors will win the NBA Championship

As usual I had to have my one fun pick. Clearly this is not a “gimme” and maybe shows my fan bias. In fact, the Warriors have serious issues even getting to the championship game as the Suns have been playing great and Memphis is on the rise and easily could beat out the Warriors for second in the West. This means the Warriors could need to overcome home court advantages for each of those teams assuming each of the three wins in earlier rounds. But, before Green was injured, the Warriors were the top defensive team in the league and also playing quite well on offense and Klay Thompson had yet to play.  Since his injury Kuminga has emerged as another strong cog in the Warrior wheel and Klay appears to be working towards his former production by the playoffs.

In last year’s top ten I pointed out that Wiggins was likely to shine for the Warriors and he has certainly done that on offense and defense this year. Despite a so-called slump, Curry is still the best shooter on the planet and will likely return to full form when Green returns as its no coincidence that his tail-off started under the pressure of breaking the 3-point scoring record but has mostly been with Green out. Poole has developed into a strong 6th man who is capable of providing a scoring boost when needed. Looney could benefit from a little easing of his minutes coming into the playoffs as he was playing his best basketball ever for most of the season. Iguodala should be very additive in the playoffs, assuming he is healthy. Finally, Gary Payton is a game changer on defense and Kerr has been using him very effectively.

Some thoughts on risk arbitrage

I promised a new post within 3 weeks of the last one. It’s here…but is different than originally planned! Several recent M&A events have motivated me to try to explain some basics on what happens to associated stocks in such a situation, the most recent being the Zoom acquisition of Five9. If the acquisition is a stock for stock transaction (as the Zoom one is), the acquirors stock will usually decline in price right after the announcement of the deal.  The reason for the inevitable next day decline of the acquirer’s stock can be misunderstood. In this post I will explain why the decline has little to do with investors reaction to the quality of the acquisition.

What happens when a stock for stock acquisition of a public company is announced?

When a public company offers to acquire another, it is quite usual for the offer to be at a premium to the current stock price of the target company. Without a premium there is little motivation for the target company to accept the offer, and it can create a legal issue – as class action attorneys are vigilant to find opportunities to sue and can claim that the target sold out too “cheaply”.

Assuming the number of shares involved is a material amount, then once the deal is made public, the stock of the acquirer will almost always decline the next day while the target’s price rises. The press often interprets this as “The Street” being negative on the acquisition, when in fact it has little to do with a critique of the deal. Instead, it stems from “Risk Arbitrage” where arbitragers will short the acquirer’s stock and buy the target’s stock to create a certain profit if the acquisition is consummated. To illustrate this, I will use an easy-to-understand example:

Suppose Company A is trading at $100/share and then offers to acquire Company B (trading at $60/share). Suppose the offer is one share of Company A stock for each share of Company B stock. At these prices an arbitrager can:

  1. Buy Company B stock at $60/share – this equates to buying Company A stock at a discount if and when the deal closes since each share of B will then convert to one share of A
  2. Short Company A stock and receive $100/share

The net result is a gain of $40/share assuming the deal consummates. This occurs because when the share of B is converted to a share of A it can be used to cover the short position without the arbitrager spending any money. The Arbitrager will continue to do this as long as there is a gap between the prices of the shares. Given the number of shares being sold, A’s stock price will usually fall (the next day) and B’s will rise until it is virtually equal to A’s price on an as converted basis. The difference once this reaches equilibrium is the “risk premium”.

The reason it’s called “Risk Arbitrage” is that if the deal falls apart money could be lost. Therefore, a smart arbitrager will assign a risk premium based on his or her assessment of the probability that the deal will break. Once the 2 stocks are in sync, they will continue to trade in sync with the difference in prices being the risk premium. This will probably mean that the acquirer’s stock will return to around its prior price a few days later plus or minus its normal fluctuation, and the premium or discount assigned by investors to the deal.

Using Zoom Acquisition of Five9 as a Real Example

For an actual example, lets review the Zoom acquisition of Five9 announced on Sunday July 18, 2021. The agreement was to exchange each share of Five9 for 0.5533 shares of Zoom. At the close of the market on Friday, July 16 (just before the announcement):

  1. Zoom shares were at $361.97 and Five9 shares were at $177.60
  2. The theoretic value of a Five9 share based on 0.5533 of a Zoom share was $200.28 a 13% premium to the July 16 Five9 share price.

By the close on Monday July 19, Zoom shares had declined to $354.20 and Five9 shares had increased in price to $188.12. I saw many articles interpreting the Zoom drop in price as investors being negative on the deal. However, I believe it was the result of the volume of Zoom stock shorted by arbitragers.

Since 0.5533 times the Zoom price of $354.20 is $195.98 there was still a discrepancy in the ratio between the two stocks versus the ultimate conversion multiple of 0.5533 since Five9 was trading at 4.01% lower than the exchange ratio implied it was worth. This meant that Arbitragers were initially assigning a 4.01% risk factor based on the odds the deal would close. Once the two stocks settled into the appropriate ratio they have traded in sync since (less the Risk Premium). The risk premium has declined slightly in the two weeks since the deal was announced as arbitragers began to assess a lower risk factor to the odds the deal would break.

This same pattern usually occurs each time a stock for stock transaction is announced. There is too much money to be made from the arbitrage if the two stocks don’t adjust based on the conversion ratio. Any time they get out of sync arbitragers will step in again. When they initiate a pair of transactions the combination of buying stock in the target and shorting stock in the acquirer generates an immediate profit in cash. In our example of Zoom if the stocks were still at the July 16 price a transaction could be:

  1. Buy 10,000 shares of Five9 at $177.60 at a cost of $1,776,000
  2. These shares would convert to 5,533 shares of Zoom when the acquisition closes
  3. Sell short 5,533 shares of Zoom at $361.97/share to receive $2,002,780
  4. Immediate cash to arbitrager = $2,002,780 – $1,776,000 = $226,780
  5. If and when the acquisition closes the arbitrager would net a profit of $226,780
  6. If the deal breaks there could be a loss as the Zoom share short would need to be covered and the Five9 shares sold. This is why there is a risk premium involved.

Of course, the July 16 prices disappeared quickly when the stocks opened on July 19 as the arbitragers begin to execute their transactions. But as long as the difference exceeded the risk premium, they continued to transact to realize an immediate cash return. Once equilibrium was reached arbitragers ceased transacting (unless the stocks were to get out of sync again).

Conclusion

If you own a stock making a major acquisition and its stock price drops the day after the transaction is announced, the drop is likely to be temporary. Of course, there are situations where investors actually are so negative towards the transaction that the acquirer stock does not recover, but the first day drop usually has little to do with that.   

The Top 10 List for 2021

Professional Sports in a Covid World

I wanted to start this post by repeating something I discussed in my top ten lists in 2017, 2018 and 2020 which I learned while at Sanford Bernstein in my Wall Street days: “Owning companies that have strong competitive advantages and a great business model in a potentially mega-sized market can create the largest performance gains over time (assuming one is correct).” It does make my stock predictions somewhat boring (as they were on Wall Street where my top picks, Dell and Microsoft each appreciated over 100X over the ten years I was recommending them).

In the seven years we have been offering stock picks on this blog this strategy has worked quite well as the cumulative gains for my picks now exceeds 21X and the 7-year IRR is 55%. The two stocks that have been on the list every year, Tesla and Facebook, were at the end of 2020 at 77X and 11X, respectively, of the price I bought them in mid-2013. They both have been on our recommended list every year since but this is about to change.

In last year’s Top 10 list I pointed out that my target is to produce long-term returns at or above 26%. At that rate one would double their money every 3 years. Since the S&P has had compound growth of 10.88%/year for the past 7 years, and Soundbytes has been at 55%, I thought you might find it interesting to see how long a double takes at various levels of IRR and what multiple you would have after 10 years for each one.

Table: Compound Returns at Various Rates

The wonder of compounding is quite apparent in the table, but it also shows that patience is a virtue as holding the stocks of great companies longer can multiply your money significantly over time, while too many investors become inpatient and sell prematurely. In our last post of 2020 we outlined the thinking process to select great companies, but even great companies can have some periods where their returns are below par. Given that our picks were up an average of 259% last year, I’m back to a fearful mode that 2021 might be that period. Of course, I’m always fearful but sticking with great companies has worked out so far and trying to time when to sell and buy back those companies often leads to sub-optimization.

To some extent, over a 5-year period or longer, stock appreciation is correlated with a company’s growth. So, as I go through each of my 6 stock picks, I will discuss what that might mean for each company. With that in mind, as is my tendency (and was stated in my last post), I am continuing to recommend 5 of the 6 stocks from last year: Tesla, Zoom, Amazon, Stitch Fix and DocuSign. I am removing Facebook from the list and adding CrowdStrike. To be clear, I still believe Facebook will outperform the S&P (see Pick 7 below) but I also believe that over the next few years CrowdStrike and the 5 continuing stocks will experience greater appreciation.

2021 Stock Recommendations:

1. Tesla stock appreciation will continue to outperform the market (it closed last year at $706/share)

Tesla is the one stock in the group that is not trading in synch with revenue growth for a variety of reasons. This means it is likely to continue to be an extremely volatile stock, but it has so many positives in front of it that I believe it wise to continue to own it. The upward trend in units and revenue should be strong in 2021 because, in addition to continued high demand for the model 3:

  1. China Expansion: Tesla continues to ramp up production in China, the world’s largest market. In 2020 the company sold about 120,000 cars (which placed it a dominant number 1 in battery powered cars) there as its Giga Factory in Shanghai ramped up production. Trade Group China Passenger Car Association predicts that Tesla will sell as many as 280,000 vehicles there in 2021…an increase of about 133%. While that is significant growth it only would represent 20% of the number of battery powered vehicles forecast to be sold. The limitation appears to be production as the Shanghai factory is just nearing a volume of 5,000 vehicles per week. Tesla believes it can double that during this year. The Model Y has just been introduced in China and early press is calling it a major hit. Together with the Model 3, I believe this positions Tesla to be supply constrained. Should the company increase production earlier in the year, it has the opportunity to sell more than the forecast 280,000 vehicles. What is also important to note, is Tesla seems to be making greater profits on sales of its cars in China than in the U.S so as China becomes a larger portion of the mix Gross Margin could increase.
  • European Factory: Tesla has a cost disadvantage in Europe as its cars are not currently built there. So, while it established an early lead in market share, as others have launched battery powered vehicles at lower prices Tesla lost market share. That should all change when its Berlin Giga Factory begins production in July, 2021. This coupled with the Model Y introduction (it will be built in the Berlin factory) should mean a notable increase in sales as Europe returns to more normal times.
  • Model Y introduction: The Model Y, launched in early 2020 in the U.S., is already selling about 12,000 units a month here. This exceeds sales of crossover vehicles from every major brand (per GCBC which uses VIN reporting to calculate its numbers). It is expected to start being delivered in China in February.
  • Cybertruck: The Cybertruck (see our graphic here) was introduced to extremely mixed reactions. Traditionalists tended to hate it due to its radical departure from what they have come to expect for a pickup truck from companies like Ford, Toyota, etc. But it rang a cord with many and pre-orders are now up to 650,000 units according to Finbold. To give perspective on what this means, it is 30% higher than the total number of vehicles Tesla sold in 2020.  While a portion of these orders could be cancelled as they only required a $100 deposit, the magnitude does imply significant incremental demand when Tesla launches in this category. The launch is expected late this year.
  • Roadster: Tesla has plans to re-introduce a Roadster in 2021. You may recall that the first Tesla’s were sports cars and are now collectors’ cars mostly valued between $50,000 and $70,000 but now the last one built, having about 200 miles on it is up for sale at $1.5 million. This time around it will make it an ultra-premium vehicle in specifications and in price. The base price Tesla has indicated starts at $200,000. A “Founders Series” will be $50,000 higher (with only 1,000 of those available). At those prices, gross margins should be quite high.  The range Tesla initially indicated for this car was 620 miles and the speed from 0 to 60 of 1.9 seconds which would be much quicker than the McLaren 570S gas powered auto.
  • Tesla Semi: of all the vehicle categories that would benefit from being battery powered I believe the Semi is on top. That is because cost of ownership is one of the highest priorities for vehicles used in commerce. And Tesla claims that their semi will offer the lowest cost of ownership due to economic cost of fuel, less maintenance required as it has fewer parts, and easier repairs. According to Green Car Reports Musk has said it will begin being produced in 2021. Even assuming that Elon’s optimism is off, it appears that it could hit the market in early 2022. Once a definite date and specs are public, sales forecasts for Tesla could rise in 2022.

I’ve taken more time than usual to review my thoughts on Tesla as its astounding stock appreciation in 2020 make it vulnerable to stock pullbacks of some magnitude from time to time. But, its potential to achieve meaningful share of overall auto sales as various geographies shift to battery powered vehicles gives it the potential to achieve high growth in revenue for many years to come.  

2. DocuSign stock appreciation will continue to outperform the market (it closed last year at $222/share)

DocuSign is the runaway leader in e-signatures facilitating multiple parties signing documents in a secure, reliable way for board resolutions, mortgages, investment documents, etc. Being the early leader creates a network effect, as hundreds of millions of people are in the DocuSign e-signature database. The company has worked hard to expand its scope of usage for both enterprise and smaller companies by adding software for full life-cycle management of agreements. This includes the process of generating, redlining, and negotiating agreements in a multi-user environment, all under secure conditions. On the small business side, the DocuSign product is called DocuSign Negotiate and is integrated with Salesforce.

DocuSign was another beneficiary of the pandemic as it helped speed the use of eSignature technology. The acceleration boosted revenue growth to 53% YoY in Q3, 2021 (the quarter ended on October 31, 2020) from 39% in Fiscal 2020.  Total customers expanded by 46% to 822,000. At the same time Net Retention (dollars spent by year-ago customers in Q3 FY21 vs dollars spent by the same customers a year earlier) was 122% in the quarter. Non-GAAP gross margin remained at 79% as increased usage per customer (due to the pandemic) had minimal impact on cost. Given DocuSign’s strong Contribution Margin, operating profits increase faster than revenue and were up to $49 million from $17 million in the year ago quarter. What has happened represents an acceleration of the migration to eSignature technology which will be the base for DocuSign going forward. Once a company becomes a customer, they are likely to increase their spend, as evidenced by 122% Net Revenue growth. Finally, competition appeared to weaken as its biggest competitor, Adobe, lost considerable ground. This all led to a sizable stock gain of 200% to $222/share at year end.  In my view, the primary risk is around valuation but at 50% growth this gets mitigated as earnings should grow much faster than revenue. I continue to believe the stock will appreciate faster than the S&P.

3. Stitch Fix Stock appreciation will continue to outperform the market (it closed last year at $58.72/share)

Stitch Fix offers customers, who are primarily women (although its sales in Men’s clothing is rising), the ability to shop from home by sending them a box with several items selected based on sophisticated analysis of their profile and prior purchases. The customer pays a $20 “styling fee” for the box which can be applied towards purchasing anything in the box. The company is the strong leader in the space with revenue at nearly a $2 billion run rate. The stock had a strong finish to 2020 after declining substantially earlier in the year due to Covid negatively impacting performance. This occurred despite gaining market share as people simply weren’t buying a normal amount of clothes at the onset of the pandemic. When revenue growth rebounded in the October quarter to 10% YoY and 7% sequentially the stock gained significant ground and closed the year up 129%.

Stitch Fix continues to add higher-end brands and to increase its reach into men, plus sizes and kids. Its algorithms to personalize each box of clothes it ships keeps improving. It appears to be beyond the worst days of the pandemic and expects revenue growth to return to a more normal 20-25% for fiscal 2021 (ending in July). This is partially due to easy comps in Q3 and Q4 and partly due to clothing purchase behavior improving. The company will also be a beneficiary of a number of closures of retail stores.

Assuming it is a 20-25% growth company that is slightly profitable, it still appears under-valued at roughly 3X expected Q2 annualized revenue. As a result, I continue to recommend it.

4. Amazon stock will outpace the market (it closed last year at $3257/share).

Amazon shares increased by 76% last year while revenue in Q3 was up 37% year over year (versus 21% in 2019). This meant the stock performance exceeded revenue growth as its multiple of revenue expanded in concert with the increased revenue growth rate. Net Income grew 197% YoY in the quarter as the leverage in Amazon’s model became apparent despite the company continuing to have “above normal” expenditures related to Covid. We expect the company to continue at elevated revenue and earnings growth rates in Q4 and Q1 before reaching comps with last year’s Covid quarters. Once that happens growth will begin to decline towards the 20-25% level in the latter half of 2021.

What will remain in place post-Covid is Amazon’s dominance in retail, leading share in Web Services and control of the book industry. Additionally, Amazon now has a much larger number of customers for its Food Services than prior to the pandemic. All in all, it will likely mean that the company will have another strong year in 2021 with overall growth in the 25-30% range for the year and earnings growing much faster. But remember, the degree earnings grow is completely under Amazon’s control as they often increase spend at faster rates than expected, especially in R&D.

5. Zoom Video Communications will continue to outperform the market (it closed last year at $337/share)

When I began highlighting Zoom in my post on June 24, 2019, it was a relatively unknown company. Now, it is a household name. I’d like to be able to say I predicted that, but it came as a surprise. It was the pandemic that accelerated the move to video conferencing as people wanted more “personal contact” than a normal phone call and businesses found it enhanced communications in a “work at home world”. Let me remind you what I saw in Zoom when I added it to the list last year, while adding some updated comments in bold:

  1. At the time, Revenue retention of business customers with at least 10 employees was about 140%. In Q3, FY 2021 revenue retention of business customers was still 130% despite pandemic caused layoffs.
  2. It acquires customers very efficiently with a payback period of 7 months as the host of a Zoom call invites various people to participate in the call and those who are not already Zoom users can be readily targeted by the company at little cost. Now that Zoom is a household name, acquiring customers should be even less costly.
  3. At the time, Gross Margins were over 80% and I believed they could increase. In Q3, GM had declined to 68% as usage increased dramatically and Zoom made its products available to K-12 schools for free. Given that students were all mostly attending school virtually, this is a major increase in COGs without associated revenue. When the pandemic ends gross margins should return close to historic levels – adding to Zoom profits. 
  4. The product has been rated best in class numerous times
  5. Its compression technology (the key ingredient in making video high quality) appears to have a multi-year lead over the competition
  6. Adding to those reasons I noted at the time that ZM was improving earnings and was slightly profitable in its then most recent reported quarter. With the enormous growth Zoom experienced it has moved to significant profitability and multiplied its positive cash flow.

While ZM stock appreciated 369% in 2020, it actually was about equal to its revenue growth rate in Q3 2020, meaning that the price to revenue was the same as a year earlier before despite:

  • Moving to significant profitability
    • Becoming a Household name  
    • Having a huge built-in multiplier of earnings as schools re-open

6. CrowdStrike will outperform the market (it closed 2020 at $211/share and is now at 217.93)

When I evaluate companies, one of the first criteria is whether their sector has the wind behind its back. I expect the online security industry to not only grow at an accelerated pace but also face an upheaval as more modern technology will be used to detect increased attacks from those deploying viruses, spam, intrusions and identity theft. I suspect all of you have become increasingly aware of this as virus after virus makes the news and company after company reports “breaches” into their data on customers/users.

The U.S. cyber security market was about $67 billion in 2019 and is forecast to grow to about $111 billion by 2025 (per the Business Research Company’s report). Yet Cloud Security spend remains at only about 1.1% of total Cloud IT spend (per IDC who expects that percent to more than double). CrowdStrike is the player poised to take the most advantage of the shift to the cloud and the accompanying need for best-in-class cloud security. It is the first Cloud-Native Endpoint Security platform. As such it is able to monitor over 4 trillion signals across its base of over 8500 subscription customers. The companies leading technology for modern corporate systems has led to substantial growth (86% YoY in its October quarter). It now counts among its customers 49 of the Fortune 100 and 40 of the top global 100 companies.

Tactically, the company continues to add modules to its suite of products and 61% of its customers pay for 4 or more, driving solid revenue retention. The company targets exceeding 120% of the prior year’s revenue from last year’s cohort of customers. They have succeeded in this for 8 quarters in a row through upselling customers combined with retaining 97% – 98% of them. Because of its cloud approach, growing also has helped gross margins grow from 55% in FY 18 to 66% in FY 19 to 72% in FY 20 and further up to 76% in its most recent quarter. This, combined with substantial improvement in the cost of sales and marketing (as a % of revenue) has in turn led to the company going from a -100% operating margin in Fiscal 2018 to +8% in Q3, FY21. It seems clear to me that the profit percentage will increase dramatically in FY22 given the leverage in its model.  

Non-Stock Picks for 2021

7. Online Advertising Companies will Experience a Spike in Growth in the Second Half of 2021

The pandemic hit was devastating for the travel industry, in-person events and associated ticket sellers, brick and mortar retailers and clothing brands.  Rational behavior necessitated a dramatic reduction of advertising spend for all those impacted. U.S. advertising revenue declined by 4.3% to $213 billion, or around 17% according to MagnaGlobal, if one excludes the jump in political advertising (discussed in our last post), with Global spend down 7.2%. That firm believes digital formats grew revenue about 1% in 2020 (with TV, radio and print declining more than average). Digital formats would normally be up substantially as they continue to gain share, so the way to think about this is that they experienced 10-20% less revenue than would have occurred without Covid.

Assuming things return to normal in H2 2021, digital advertising will continue to gain share, total industry revenue will be higher than it would have been without Covid (even without the increased political spending in 2020) and comps will be easy ones in H2 of 2021.  While there will not be major political spending there could be Olympic games which typically boost ad spend. So, while we removed Facebook from our 6 stock picks, it and other online players should be beneficiaries.

8. Real Estate will Show Surprising Resiliency in 2021

The story lines for Real Estate during the pandemic have been:

  1. The flight to larger outside space has caved urban pricing while driving up suburban values
  2. Commercial real estate pricing (and profits) is collapsing, creating permanent impairment in their value for property owners with post-pandemic demand expected to continue to fall

My son Matthew is a real estate guru who has consulted to cities like New York and Austin, to entities like Burning Man and is also a Professor of Real Estate Economics at NYU. I asked him to share his thoughts on the real estate market.

Both Matthew (quoted below) and I disagree with the story lines. I believe a portion of the thinking regarding commercial real estate pricing relates to the collapse of WeWork. That company, once the darling of the temporary rental space, had a broken IPO followed by a decline in value of nearly 95%. But the truth is that WeWork had a model of committing to long term leases (or purchasing property without regard to obtaining lowest cost possible) and renting monthly. Such a company has extreme risk as it is exposed to downturns in the business cycle where much of their business can disappear. Traditional commercial property owners lease for terms of 5 to 25 years, with 10-15 years being most common, thus reducing or even eliminating that risk as leases tend to be across business cycles. The one area where both Matthew and I do believe real estate could be impacted, at least temporarily, is in Suburban Malls and retail outlets where Covid has already led to acceleration of bankruptcies of retailers a trend I expect to continue (see prediction 10).

The rest of this prediction is a direct quote from Matthew (which I agree with).

“Real estate in 2021 will go down as the year that those who do not study history will be doomed to repeat it. The vastly overblown sentiments of the “death of the city” and the flight to the suburbs of households and firms will be overshadowed by the facts. 

In the residential world, while the market for rentals may have somewhat softened, no urban owners have been quick to give up their places, in fact, they turned to rent them even as they buy or rent roomier locations within the city or additional places outside the cities, driving up suburban prices more quickly. In fact, even in markets such as NYC, per square foot housing sale prices are stable or rising. US homebuilding sentiment is the highest in 35 years, with several Y/Y growth statistics breaking decades long records leading up to a recent temporary fizzle due to political turmoil. 

The commercial office world, which many decry as imminently bust due to the work at home boom, has seen a slowdown of new leases signed in some areas. But because most commercial office leases are of a 10–15-year term, a single bad year has little effect. While some landlords will give concessions today for an extended term tomorrow, their overall NPV may remain stable or even rise. In the meantime, tech giants like Amazon are gobbling up available space in the Seattle and Bellevue markets, and Facebook announced a 730,000 square foot lease in midtown Manhattan late in the year. In the end, the persistence of cities as clusters of activity that provide productivity advantages to firms and exceptional quality of life, entertainment options, restaurants and mating markets to individuals will not diminish. The story of cities is the story of pandemic after pandemic, each predicting the death of the city and each resulting in a larger, denser, more successful one. 

The big story of real estate in 2021 will be the meteoric rise of industrial, which began pre-COVID and was super charged as former in-person sales moved to online and an entire holiday season was run from “dark stores” and warehouses. The continual build out of the last mile supply chain will continue to lower the cost of entry for retailers to accelerate cheaper delivery options. This rising demand for industrial will continue the trend of the creation of “dark stores” which exist solely as shopping locations for couriers, Instacart, Whole Foods and Amazon. Industrial is on the rise and the vaccine distribution problems will only accelerate that in 2021.”

9. Large Brick and Mortar Retailers will continue their downward trend with numerous bankruptcies and acquisitions by PE Firms as consumer behavior has permanently shifted

While bankruptcies are commonplace in the retail world, 2020 saw an acceleration and there was a notable demise of several iconic B&M (Brick & Mortar) brands, including:

It is important to understand that a bankruptcy does not necessarily mean the elimination of the entity, but instead often is a reorganization that allows it to try to survive. Remember many airlines and auto manufacturers went through a bankruptcy process and then returned stronger than before. Often, as part of the process, a PE firm will buy the company out of bankruptcy or buy the brand during the bankruptcy process. For example, JC Penny filed for bankruptcy protection in May, 2020 and was later acquired by the Simon Property Group and Brookfield Property Partners in September, 2020. Nieman Marcus was able to emerge from bankruptcy protection without being acquired. However, in both cases, reorganizing meant closing numerous stores.

There are many who believe things will: “go back to normal” once the pandemic ends. I believe this could not be further from the truth as consumer behavior has been permanently impacted. During the pandemic, 150 million consumers shopped online for the first time and learned that it should now be part of how they buy. But, even more importantly, those who had shopped online previously became much more frequent purchasers as they came to rely on its advantages:

  1. Immediate accessibility to what you want (unlike out of stock issues in Brick and Mortar retail)
  2. Fast and Free shipping in most cases
  3. A more personalized experience than in store purchasing

As older Brick & Mortar brands add online shopping to their distribution strategy, most are unable to offer the same experience as online brands. For example, when you receive a package from Peloton the unboxing experience is an absolute delight, when you receive one from Amazon it is perfectly wrapped. On the other hand, I have bought products online from Nieman Marcus, an extremely high-end retailer, and the clothes seemed to be tossed into the box, were creased and somewhat unappealing when I opened the box. Additionally, a company like Amazon completely understands the importance of customer retention and its support is extraordinary, while those like Best Buy that offer online purchasing fall far of the bar set by Amazon.

What that all means is that many Brick and Mortar retailers will not solve their issues:

  • Adding more of an online push will not be enough
    • Customers that have experienced the benefits of online purchasing will continue to use it in much greater amounts than before the pandemic
    • Ecommerce will continue to take share from Brick and Mortar stores
    •  

As a result, we believe that in 2021 the strain on physical retail will continue, resulting in many more well-known (and lesser known) store chains and manufacturing brands filing for bankruptcy as the dual issues of eCommerce and of the pandemic keeping stores closed and/or operating at greatly diminished customer traction throughout most of the year. Coming on the heels of a disastrous 2020 it will be harder for many of them to even emerge from bankruptcy after reorganizing (including closing many stores). 

10. The Warriors will make the playoffs this Year

I couldn’t resist including one fun pick. We did speak about this in our last post but wanted to include it as an actual 2021 pick. Many pundits had the Warriors as dead before this season began once Klay Thompson was injured. And, of course, more piled on when the team lost its first 2 games by large margins. But they were mis-analyzing several significant factors:

  • Steph Curry is still Steph Curry at his peak no matter who the supporting cast
  • Andrew Wiggins is a superior talent who has the ability to shine on both offense and defense now that he is no longer in a sub-optimal Minnesota environment
  • Kelly Oubre Jr is also talented enough to be a great defender. His offense, while poor so far, is well above average and over the course of the season that should show well
  • Draymond Green is in his prime and remains one of the top defenders in the league. He is also a great facilitator on the offensive end of the floor.
  • James Wiseman is a phenomenon with the talent to be a star. As the season progresses, I expect him to continue to get better and become a major factor in Warrior success
  • Eric Pascal was on the all-rookie team last year and has gotten better

It is clear that the team needs more games to get Curry and Green back into peak playing condition, Wiseman to gain experience and the Warriors to become acclimated to playing together. They have started to show improved defense but still need time to develop offensive rhythm. I expect them to be a major surprise this year and make the playoffs.

SoundBytes

  • Please Wear A Mask: I recently read a terrific book describing the 1918 flu pandemic called The Great Influenza by John Barry. That pandemic was much deadlier than the current one, with estimates of the number of people it killed ranging from 35 million to 100 million when the world population was less than 25% of what it is today. What is so interesting is how much the current situation has replicated the progress of that one. One of the most important conclusions Barry draws from his extensive study of the past is that wearing a mask is a key weapon for reducing the spread.

Recap of 2020 Top Ten Predictions

Tesla’s new pickup truck due out late 2021

Bull Markets have Tended to Favor My Stock Picks

This may seem like a repeat of what you have heard from me in the past, but I enter each year with some trepidation as my favored stocks are high beta and usually had increased in value the prior year (in 2019 they were up about 46% or nearly double the S&P which also had a strong year). The fact is: I’m typically nervous that somehow my “luck” will run out. But, in 2020 I was actually pretty confident that my stock picks would perform well and would beat the market. I felt this confidence because the companies I liked were poised for another very strong growth year, had appreciated well under their growth over the prior 2-year period and were dominant players in each of their sub-sectors. Of course, no one could foresee the crazy year we would all face in 2020 as the worldwide pandemic radically changed society’s activities, purchasing behavior, and means of communication. As it turns out, of the 6 stocks I included in my top ten list 3 were beneficiaries of the pandemic, 2 were hurt by it and one was close to neutral. The pandemic beneficiaries experienced above normal revenue growth and each of the others faired reasonably well despite Covid’s impact. The market, after a major decline in March closed the year with double digit gains. Having said all that, I may never replicate my outperformance in 2020 as the 6 stocks had an average gain of an astounding 259% and every one of them outperformed the S&P gain of 14.6% quite handily.

Before reviewing each of my top ten from last year, I would like to once again reveal long term performance of the stock pick portion of the top ten list. I assume equal weighting for each stock in each year to come up with performance and then compound the yearly gains (or losses) to provide the 7-year performance. I’m comparing the S&P index at December 31 of each year to determine annual performance.  Soundbyte’s compound gain for the 7-year period is 2049% which equates to an IRR of 55.0%. The S&P was up 106.1% during the same 7-year period, an IRR of 10.9%.

2020 Non-Stock Top Ten Predictions also Impacted by Covid

The pandemic not only affected stock performance, it had serious impact on my non-stock predictions. In the extreme, my prediction regarding the Warriors 2020-2021 season essentially became moot as the season was postponed to start in late December…so had barely over a week of games in the current year! My other 3 predictions were all affected as well. I’ll discuss each after reviewing the stock picks.

The 2020 Stocks Picked to Outperform the Market (S&P 500)

  1. Tesla Stock which closed 2019 at $418/share and split 5 for 1 subsequently
  2. Facebook which closed 2019 at $205/share
  3. DocuSign which closed 2019 at $74/share
  4. Stitch Fix which closed 2019 at $25.66/share
  5. Amazon which closed 2019 at $1848/share
  6. Zoom Video Communications which closed 2019 at $72.20/share

In last year’s recap I noted 3 of my picks had “amazing performance” as they were up between 51% and 72%. That is indeed amazing in any year. However, 2020 was not “any year”. The 6 picks made 2019 gains look like chopped liver as 4 of my 6 picks were up well over 100%, a 5th was up over 70% and the last had gains of double the S&P. In the discussion below, I’ve listed in bold each of my ten predictions and give an evaluation of how I fared on each.

1. Tesla stock appreciation will continue to outperform the market (it closed last year at $418/share). Note that after the 5 for 1 split this adjusts to $84.50/share.

In 2020, Tesla provided one of the wildest rides I’ve ever seen. By all appearances, it was negatively impacted by the pandemic for three reasons: people reduced the amount they drove thereby lessening demand for buying a new vehicle, supply chains were disrupted, and Tesla’s Fremont plant was forced to be closed for seven weeks thereby limiting supply. Yet the company continued to establish itself as the dominant player in electronic, self-driving vehicles. It may have increased its lead in user software in its cars and it continued to maintain substantial advantages in battery technology. The environment was also quite favorable for a market share increase of eco-friendly vehicles.

Additionally, several other factors helped create demand for the stock. The 5 for 1 stock split, announced in August was clearly a factor in a 75% gain over a 3-week period. Inclusion in the S&P 500 helped cause an additional spike in the latter part of the year. Tesla expanded its product line into 2 new categories by launching the Model Y, a compact SUV, to rave reviews and demonstrating its planned pickup truck (due in late 2021) as well. While the truck demo had some snags, orders for it (with a small deposit) are currently over 650,000 units.

All in all, these factors led to Tesla closing the year at $706/share, post-split, an astounding gain of 744% making this the largest one year gain I’ve had in the 7 years of Soundbytes.

2. Facebook Stock will outpace the market (it closed 2019 at $205 per share)

Facebook was one of the companies that was hurt by the pandemic as major categories of advertising essentially disappeared for months. Among these were live events of any kind and associated ticketing company advertising, airlines and cruise lines, off-line retail, hotels, and much more. Combine this with the company’s continued issues with regulatory bodies, its stock faced an uphill battle in 2020. What enabled it to close the year at $273 per share, up 33% (over 2x the S&P), is that its valuation remains low by straight financial metrics.

3. DocuSign stock appreciation will continue to outperform the market (it closed 2019 at $74/share)

DocuSign was another beneficiary of the pandemic as it helped speed the use of eSignature technology. The acceleration boosted revenue growth to 53% YoY in Q3, 2021 (the quarter ended on October 31, 2020) from 39% in Fiscal 2020.  Since growth typically declines for high-growth companies this was significant. Investors also seemed to agree with me that the company would not lose the gains when the pandemic ends. Further, DocuSign expanded its product range into contract life-cycle management and several other categories thereby growing its TAM (total available market). Despite increased usage, DocuSign COGs did not rise (Gross Margin was 79% in Q3). Finally, competition appeared to weaken as its biggest competitor, Adobe, lost considerable ground. This all led to a sizable stock gain of 200% to $222/share at year end.

4. Stitch Fix stock appreciation will continue to outperform the market (it closed 2019 at $25.66/share)

Stitch Fix had a roller coaster year mostly due to the pandemic driving people to work from home, which led to a decline in purchasing of clothes. I’m guessing many of you, like me, wear jeans and a fleece or sweatshirt most days so our need for new clothes is reduced. This caused Stitch Fix to have negative growth earlier in the year and for its stock to drop in price over 50% by early April. But, the other side of the equation is that brick and mortar stores lost meaningful share to eMerchants like Stitch Fix. So, in the October quarter, Stitch Fix returned to growth after 2 weak quarters caused by the pandemic. The growth of revenue at 10% YoY was below their pre-pandemic level but represented a dramatic turn in its fortunes. Additionally, the CEO guided to 20-25% growth going forward. The stock reacted very positively and closed the year at $58.72/share up 129% for the year.

5. Amazon stock strategy will outpace the market (it closed last year at $1848/share)

Amazon had a banner year in 2020 with a jump in growth driven by the pandemic. Net sales grew 37% YoY in Q3 as compared to an approximate 20% level, pre-pandemic. Their gains were in every category and every geography but certainly eCommerce led the way as consumers shifted more of their buying to the web. Of course, such a shift also meant increased growth for AWS as well. Net Income in Q3 was up 197% YoY to over $6.3 billion. Given the increase in its growth rate and strong earnings the stock performed quite well in 2020 and was up 76% to $3257/share.

In our post we also recommended selling puts with a strike price of $1750 as an augmented strategy to boost returns. Had someone done that the return would have increased to 89%. For the purposes of blog performance, I will continue to use the stock price increase for performance. Regardless, this pick was another winner.

6. I added Zoom Media to the list of recommended stocks. It closed 2019 at $72.20

When I put Zoom on my list of recommended stocks, I had no idea we’d be going through a pandemic that would turn it into a household name. Instead, I was confident that the migration from audio calls to video conference calls would continue to accelerate and Zoom has the best product and pricing in the category. For its fiscal 2020-year (ending in January, 2020) Zoom grew revenue 78% with the final sequential quarter of the year growth at 13.0%. Once the pandemic hit, Zoom sales accelerated greatly with the April quarter up 74% sequentially and 169% YoY. The April quarter only had 5 weeks of pandemic benefit. The July quarter had a full 3 months of benefit and increased an astounding 102% sequentially and 355% YoY.  Q3, the October quarter continued the upward trend but now had a full quarter of the pandemic as a sequential compare. So, while the YoY growth was 367%, the sequential quarterly growth began to normalize. At over 17% it still exceeded what it was averaging for the quarters preceding the pandemic but was a disappointment to investors and the stock has been trading off since reporting Q3 numbers. Regardless of the pullback, the stock is ahead 369% in 2020, closing the year at $337/share .

In the post we also outlined a strategy that combined selling both put and call options with purchasing the stock. Later in the year we pointed out that buying back the calls and selling the stock made sense mid-year if one wanted to maximize IRR. If one had followed the strategy (including the buyback we suggested) the return would still have been well over a 100% IRR but clearly lower than the return without the options. As with Amazon, for blog performance, we are only focused on the straight stock strategy. And this recommendation turned out to be stellar.

Unusual Year for the Non-Stock Predictions

7. The major election year will cause a substantial increase in advertising dollars spent

This forecast proved quite valid. Michael Bloomberg alone spent over $1 billion during his primary run. The Center for Responsive Politics reported that they projected just under $11 billion in spending would take place between candidates for president, the Senate and the House in the general election. This was about 50% higher than in 2016. Additionally, there will be incremental dollars devoted to the runoff Senate races in Georgia. This increase helped advertising companies offset some of the lost revenue discussed above.

8. Automation of Retail will continue to gain momentum

Given the pandemic, most projects were suspended so this did not take place. And it may be a while before we have enough normalization for this trend to resume, but I am confident it will. However, the pandemic also caused an acceleration in eCommerce for brick and mortar supermarkets and restaurants. I’m guessing almost everyone reading this post has increased their use of one or more of: Instacart, Amazon Fresh, Walmart delivery, Safeway delivery, Uber Eats, GrubHub, Doordash, etc. My wife and I even started ordering specialty foods (like lox) from New York through either Goldbelly or Zabars. Restaurants that would not have dreamed of focusing on takeout through eCommerce are now immersed in it. While this was not the automation that I had contemplated it still represents a radical change.

9. The Warriors will come back strong in the 2020/2021 season

This was my fun prediction. Unfortunately, the combination of injuries and Covid eliminated fun for sports fans. I expected that there would be enough games in 2020 to evaluate whether my forecast was correct or not. Since the season started in late December its premature to evaluate it. Also, I pointed out that the team had to stay relatively healthy for the prediction to work. Guess what? The Warriors have already had 2 devastating injuries (Thompson the critical one, and Chriss, who I expected would help the second team as well).

Yet, several things I predicted in the post have occurred:

  1. The younger players did develop last season, especially Pascal
  2.  The Warriors did get a very high draft choice and at first blush he seems like a winner
  3. The Warriors did use the Iguodala cap space to sign a strong veteran, Oubre.

Given the absence of Thompson, the team will be successful if they make the playoffs. So, let’s suspend evaluating the forecast to see if that occurs in a packed Western Conference despite losing Thompson. Last year they started 4 and 16. For the 2020-2021 season  (as of January 3) they are 3 and 3 and appear to be a much better team that needs time to jell. But the jury is out as to how good (or bad) they will be. 

10. At least one of the major Unicorns will be acquired by a larger player

There were 9 Unicorns listed in the post. Eight are still going at it by themselves but the 9th, Slack, has recently been acquired by SalesForce making this an accurate prediction.

2021 Predictions coming soon

Stay tuned for my top ten predictions for 2021… but please note most of the 6 stocks from 2020 will continue on the list and as usual, for these stocks, we will use their 2020 closing prices as the start price for 2021. For any new stock we add, we will use the price of the stock as we are writing the post.

Soundbytes

I thought I would share something I saw elsewhere regarding New Year’s wishes. In the past most people wished for things like success for themselves and/or family members in one form or another. The pandemic has even transformed this. Today, I believe most people are more focused on wishing for health for them, their family, friends, and an end to this terrible pandemic. Please take care of yourselves, stay safe. We are getting closer to the end as vaccines are here and will get rolled out to all of us over the next 4-6 months.

My approach on public market investing

I have always taken a research driven, multi-pronged approach to identifying attractive publicly traded equity investments, and after reflecting on this approach with a new fund that I am starting, I figured that it would make for an interesting blog post to share this with a broader audience. The companies that I have covered through previous blog posts have been identified through this process. As you likely know if you made some investments based off of my suggestions in the past, they have performed very well!

My Screening Process

I begin with a screening process as follows:

  1. Discover trends that are disruptive to entrenched market participants, expected to continue for over five years, and relate to very large markets
  2. Identify companies that are strong beneficiaries of these trends; and
  3. Evaluate these companies’ competitive advantages that stem from one or more of:
    • superior technology often protected by patents,
    • strong emerging brand,
    • network effect of having built a massive connected audience,
    • high quality leadership,
    • products that are very difficult to replicate, and/or
    • advantageous business model

Companies are identified that pass the above screening. Then I apply a filter to reduce these matches to ones that also are already generating or have an ability to generate strong profits. I believe that the most important metric to evaluate companies that have yet to develop mature business models is contribution margin, i.e.: gross margin minus customer acquisition cost. We have covered contribution margin in past blog posts. Check our post in January 2020 which contains our discussion of sophisticated valuation methodology for more background on how I see this as a key metric for evaluating business models.

Companies passing the above screen are rare and, thus, are both difficult and time-consuming to identify. Each company selected from those that passed the screening will also need to have well above average revenue growth for their respective stages.

My experience indicates that great returns will be realized over a long period of time from companies that have the key attributes described above and, therefore, I expect, generally, to hold the core of each of my positions for an average period of five years or more. This doesn’t mean never selling any shares, but rather holding the majority of shares for that period. I augment my equity investments in portfolio companies by writing both call and put options or other derivatives (we covered an example of this recently with Zoom in my 2020 predictions). Doing this hedges risk of short-term market fluctuation and generates income from option premiums going to zero over the life of the option. Given my concentration on relatively few securities of high growth companies, it is expected that volatility in my portfolio could often exceed that of the overall market. Therefore, I believe it’s important to avoid margin borrowing as this would increase risk and volatility beyond what I think is an acceptable level.

Applying the Strategy to Investing

The first step in my strategy is to identify longer term trends that are disruptive to entrenched leaders of large markets. I believe the following qualify:

  1. Growth of eCommerce: Online purchasing will gain share for another 10 years or more
  2. Shift of services from physical, in-person to virtual: This reduces cost and adds convenience and should persist for many years
  3. Use of video conferencing in place of older audio conferencing: Will continue to further penetrate businesses and also emerge as a “must have” for individual households
  4. Online advertising: It will continue to gain share from other forms as it allows for more precise measurement of effectiveness and promotes immediate ability to purchase
  5. Shift from old generation autos to eco-friendlier (i.e. electric) with software capabilities tightly integrated: It is in its early stages and will gain increasing traction for several decades to come
  6. The entire online security industry will not only grow at an accelerated pace but also face an upheaval as more modern technology will be used to detect increased attacks from those deploying viruses, spam, intrusions and identity theft
  7. Web Services will continue to experience double digit growth: Since its directly tied to Internet traffic driven by increased eCommerce, escalation of video, social and virtual services

Several companies that I have selected (and outlined in the past) benefit from more than one of the 7 identified trends and all are one of the dominant players in their particular arena. It should be noted that the arena may be more specific than the trend.

For example, Online advertising has distinct leaders in overall social (Facebook), search advertising (Google), Visual advertising (Pinterest), eCommerce ads (Amazon) and programmatic (The Trade Desk). So, while these 5 companies compete for advertising budget, they each are the dominant brands in their sub-sector with massive networks of users that are difficult to replicate.

Picking the winners

In the first section of this blog, I highlighted six different types of competitive advantages I look for. The companies that I have recently invested in have three or more of these advantages, and on average qualifies for roughly 4.5. On the leadership side not only do all have very strong leadership but virtually all are led by their founder who is an early innovator in their sector.

One other major consideration recently has been the impact of the pandemic. There are three companies that I have previously covered in the blog that I feel benefit strongly: Amazon, DocuSign, and Zoom. Both Peloton and Shopify would be major additional beneficiaries. When the pandemic ends there is widespread views on how such companies will be impacted. On the one hand, many analysts believe some or all of these will experience a reduction in revenue against strong comps. Others, including myself, think that behavior has changed, so while massive growth experienced during the pandemic won’t be replicated, most, if not all of them will continue to grow at a more “normal” rate. The four advertising companies I mentioned previously: Facebook, Google, Pinterest and The Trade Desk have all been impacted by the loss of advertising from major business segments like travel, live events (and associated ticket sellers) and brick and mortar retail. Since Amazon advertising revenue is limited to online sellers it is not affected by loss of ads from these sectors. My expectation is that when the Shelter-in-Place requirements are substantially eased, all four of these companies will experience a jump in advertising revenue. As we reach April of 2021 this jump will be compared to depressed comps and all four should experience above normal growth.

Of companies that are in my 2020 stock pics, surprisingly, Tesla has appreciated well over 600% despite its revenue being lower than pre-pandemic expectations. I believe this is mostly because of the certain shift taking place towards software enabled electronic cars but the stock has also been helped by inclusion in the S&P index. The other company negatively impacted by the pandemic is Stitch Fix. On the one hand, it has undoubtedly gained share as it offers a modern online method of shopping to its very large base of customers, but it is also obvious that people are just not buying that many items of clothes during the pandemic. I expected Stitch Fix to be a substantial beneficiary when Shelter-in-Place is eased, but the market is already anticipating this as we’ve seen it’s begin year value of $25.66, which fell dramatically earlier in the pandemic, rebound nicely to a price of $69 in December 2020…a 170% appreciation year-to-date.

I have also been examining several companies that had recently IPO’d as younger public companies tend to have higher growth rates which in turn creates greater potential future appreciation. So, I considered the various companies that had come public in 2019 to see which ones met my screens. Investing in Lyft and Uber, post IPO, had little interest for me. On the positive side, Lyft revenue growth was 95% in Q1, 2019, but it had a negative contribution margin in 2018 and Q1 2019. Uber’s growth was a much lower 20% in Q1, but it appeared to have slightly better contribution margin than Lyft, possibly even as high as 5%. I expected Uber and Lyft to improve their contribution margin, but it is difficult to see either of them delivering a reasonable level of profitability in the near term as scaling revenue does not help profitability until contribution margin improves. So, I passed on both which proved the right decision as Lyft is still well below the first day’s closing price of $78.29 post-IPO. Uber is now up 27% vs its first day closing price (roughly the same as the S&P index) as food delivery has proven a great business for them during the pandemic. The first of the 2019 IPO class that I bought was Zoom Video, which had a contribution margin of roughly 25% coupled with over 100% revenue growth. It also seemed on the verge of moving to profitability. Four others piqued my interest: Pinterest, Peloton, Slack and CrowdStrike. All of these were growing revenue at a 40% or higher rate, had solid business models and met my other criteria. I’ll discuss these in more detail in my following posts but, on average, they are up well over 300% this year …stay tuned for my 2021 predictions!

Random Thoughts as I Shelter in Place

This post will be more of a stream of consciousness rather than one of focus on a topic.

Sheltering in Place

My wife, Michelle, and I have obeyed the order to “shelter in place” by staying at home except for walks outside (avoiding going within 6 feet of anyone). The order started in San Mateo County at 12:01 AM on March 17.  Our last time being in close proximity with anyone was Friday March 13, so we’re getting close to knowing we are virus free. We stocked up on food a day before the order began and have already had one “Instacart” delivery as well. Not sure what you are all doing but we have called a number of family members and friends to make sure they are ok – times like this make you want to verify the health of others! We also had to cancel vacation plans – which happened in steps as fear of the virus increased. We had scheduled a trip that included visiting Cabo followed by some time with good friends/cousins in Arizona.

I was scheduled to have my annual checkup before the trip, but 2 days before my doctor called to tell me not to come. It seems that the building he is located in is a center for virus testing and he thought it made no sense to have unneeded exposure. During the course of the conversation I mentioned we would be leaving for Cabo on Thursday, March 19 and he immediately warned me not to go. While I don’t want to be compared to the premier of Italy who initially told people to ignore the risk, at the time I felt the risk was overblown (as long as I was careful in Cabo). My doctor made an impossible to refute point saying: “What if you couldn’t get back because of a lockdown. Wouldn’t you rather be in the vicinity of Stanford Hospital if anything happened instead of in Mexico?” Hard to argue with that, so we decided to fly directly to Arizona instead. As flying became a risky option, we next thought we might drive to Arizona. Finally, we decided it was best to postpone the vacation. I’m guessing some of you went through a similar gradual awakening to the degree of risk.

Still Partying

Michelle and I truly enjoy the company of others. Staying at home precludes that, at least in the normal way…but then Zoom came to the rescue! We have had two “Zoom cocktail parties.” The first was more formal so everyone dressed up (I wore a wild Shinesty tuxedo and Michelle a matching outfit). Each couple at this virtual party had their drink of choice in front of them as well as appetizers. A few days later, Michelle and I hosted a similar party after becoming paying subscribers for Zoom. At our party we asked people to dress business casual. The benefit of requiring some higher level of dress than jeans is that it makes one feel (almost) like they are out partying.  Each party lasted a little over one hour and the conversation was pretty lively. Of course, the first 10-15 minutes were all about the impact of the virus, but then the conversation rotated through a number of less depressing subjects.

We now have been invited to a virtual dinner party by the first group host and we are planning a winery hosted party for the second group. Not sure, but in all likelihood, we’ll also work on setting up a third group. If we are still in this situation when Passover arrives, we will have our traditional seder (for 20 people) via Zoom.


Our Crossword Puzzle Tradition Continues

My family has been jointly solving the NY Times crossword puzzles for many years. More recently our grandson has not only joined in but become pretty prolific. On a typical Sunday we meet our daughter, son-in-law and their two kids for brunch and do the famous NY Times Sunday puzzle. If our son is in town, he also joins us. The only difficulty is that we each have our own copy, either on an iPhone or physical printout, so coordinating is a bit more difficult. This past weekend that tradition was replaced by doing it together over brunch at each of our homes. Once again, a Zoom conference call was the method of joining together. An added benefit was that, using Zoom, the puzzle was up on each of our large screens for all of us to share one version, and we actually finished in one of our fastest times ever!

The Wild Stock Market

As you know, at the beginning of each year I select stocks to invest in. One point I continue to make is that my picks tend to be high beta stocks so they might depreciate disproportionately in a down market. With the S&P down about 25%, this is certainly bear territory, but this is not your ordinary down market as the virus impacts different companies in different ways. I have been most fortunate in that 3 of my 6 selections, Zoom, Amazon and Docusign, should benefit from the virus. Zoom is the most obvious and this has not been lost on investors, as the stock as of this writing (March 24) is up almost 90% year to date. Of course, given the substantial day to day fluctuations this might not be the case by the time this blog is posted. Docusign should also be a major beneficiary of an increase in the number of people who work at home as its electronic document signing technology increases in importance (I’ve already had a major increase in e-signing in this past week at home). Amazon is having trouble keeping up with demand since most people have decided to rely on home delivery for fulfilling their needs. A fourth stock, Tesla is also ahead 21% year to date, but its stock has been impacted by the virus as it was up over 100% before the virus impact was felt. The other 2 stocks in my picks, Facebook and Stitch Fix, are down quite a bit but I still expect them to recover by year end despite the fact that Facebook should have lower revenue than previously forecast (advertising budgets will be cut) and Stitch Fix likely will also miss prior forecasts since people not leaving their homes are less likely to be buying a lot of new clothes – but whatever they do buy will be online (partly offsetting a reduction of total spending on new clothes).

Is it a good time to be buying stocks and/or munis?

In my last post I reminded you that the best strategy for making money in the stock market is to “Buy Low Sell High”. While this seems silly to even say, people have difficulty buying low as that is when the most fear exists (or the market wouldn’t be low). While there is danger that the impact of the virus could trigger a weak economy for at least this year, I still believe this is now mostly factored into the market and have been buying after days of large market declines. Don’t do this indiscriminately, as some companies (think physical retailers for example) may be permanently impaired, but others may also benefit from what is taking place. Still others will recover and their stocks are now trading at attractive prices. What has surprised me is there has also been an opportunity to buy munis at good rates of return (3.8% to over 4% for A or better rated bonds with 8 or more years to call/maturity). But this was only available to me on Schwab (not on several large well-known brokerage houses I use). It seems the panic for liquidity has led to better than expected returns despite 10-year Treasuries dropping to 1.02% from 2.41% a year ago. However, it also seems that several of the larger brokerage firms are not passing these returns through to their customers. Once the current “panic” situation passes (say 3 months from now) tax-free bonds with 10 years or less to call should be yielding under 2% annualized return to call leading to substantial appreciation of munis acquired at a much higher rate.

We need a Sports Interlude

Since sports are at a standstill my usual analysis of performance seems out of context. Instead I wanted to suggest something I have been thinking about for the last few months – how to punish the Houston Astros for their cheating. Given the mounting disapproval of the Baseball Commissioners lack of action perhaps he will even adopt my suggestion (of course he may never even hear of it). It’s a simple one that is the mirror image of the advantage the Astros created by stealing signs (through use of technology) in their home playoff games for about 3 years. My answer is to take away at least one home game from them in every playoff series they are in (including the World Series) for the next 3 years. If it’s a one game series, they would always play at the other team’s park. If it’s a 5-game series, they would at most have one home game, and in a 7-game series at most 2 home games. While this would not totally make up for what they did, it would at least somewhat even the playing field (no pun intended).

Back to the Virus

Given all the sacrifices many are making by sheltering in place, it should be easy to expect an immediate decline in the number of new cases. Unfortunately, the incubation period for the virus is estimated to be up to 14 days. We also have under-tested so there are more people who have it than the statistics show. With increased testing more of the actual cases will be detected. When these two factoids are combined, even if there was zero spread of the virus once the stringent asks were put in place, we would still continue to see many new cases during the 14-day period and the number would be further increased by improved testing. Unfortunately, not everyone is behaving perfectly so while I would expect (hope) that in each geography we would see substantial reduction in the number of new cases after 2 weeks of sheltering in place, the number won’t get to zero. It should take a drop but getting to zero could take much longer especially considering that part of the process to fix things still exposes medical professionals, delivery people, and more to becoming carriers of the virus.

What should Companies do to Protect their Futures?

There are a number of steps every company needs to consider in reacting to the threat posed by the virus to both health and the economy. At Azure we have been advising our portfolio companies to consider all of them. They include:

  1. First and foremost, make sure you protect your employee’s health by having them work remotely if at all possible.
  2. Draw down bank lines completely to increase liquidity in the face of potential reduced revenue and earnings.
  3. Create new forecast models based on at least 3 scenarios of reduced revenue for varying periods of time. If you were anticipating a fundraise assume it will take longer to close.
  4. If modeling indicates additional risk, consider cutting whatever costs you possibly can including:
    1. A potential reduction in workforce – while this is unpleasant you need to think about insuring survival which means the remaining employees will have jobs
    2. Reduced compensation for founders and top executives possibly in exchange for additional options
    3. Negotiating with your landlord (for reduced or delayed rent) as well as other vendors
    4. Eliminating any unnecessary discretionary spending
    5. Evaluating the near-term ROAS (return on advertising spend). On the one hand, preserving capital may mean the need to cut if the payback period is more than a few months. On the other hand, since advertising cost is likely to be lower given reduced demand (for example the travel industry likely will completely shut down advertising as will physical retail) it is possible you may find that increasing marketing adds to cash flow!
  5. Think about how you might play offense – are there things you can offer new and/or existing customers to induce them to spend more time on your site or app (and perhaps increase buying) in this environment?

Stay Safe

While I was a sceptic regarding how pandemic this pandemic would be, I eventually realized that there was little downside in being more cautious. So please follow the guidelines in your area. It is easy to order just about anything online so going out to shop is an unnecessary risk. As they said in the Hunger Games: “May the odds be ever in your favor!” But, unlike the Hunger Games you can improve the odds.

2020 Top Ten Predictions

I wanted to start this post by repeating something I discussed in my top ten lists in 2017 and 2018 which I learned while at Sanford Bernstein in my Wall Street days: “Owning companies that have strong competitive advantages and a great business model in a potentially mega-sized market can create the largest performance gains over time (assuming one is correct).” It does make my stock predictions somewhat boring (as they were on Wall Street where my top picks, Dell and Microsoft each appreciated over 100X over the ten years I was recommending them).

Let’s do a little simple math. Suppose one can generate an IRR of 26% per year (my target is to be over 25%) over a long period of time.  The wonder of compounding is that at 26% per year your assets will double every 3 years. In 6 years, this would mean 4X your original investment dollars and in 12 years the result would be 16X. For comparison purposes, at 5% per year your assets would only be 1.8X in 12 years and at 10% IRR 3.1X.  While 25%+ IRR represents very high performance, I have been fortunate enough to consistently exceed it (but always am worried that it can’t keep up)! For my recommendations of the past 6 years, the IRR is 34.8% and since this exceeds 26%, the 6-year performance  is roughly 6X rather than 4X.

What is the trick to achieving 25% plus IRR? Here are a few of my basic rules:

  1. Start with companies growing revenue 20% or more, where those closer to 20% also have opportunity to expand income faster than revenue
  2. Make sure the market they are attacking is large enough to support continued high growth for at least 5 years forward
  3. Stay away from companies that don’t have profitability in sight as companies eventually should trade at a multiple of earnings.
  4. Only choose companies with competitive advantages in their space
  5. Re-evaluate your choices periodically but don’t be consumed by short term movement

As I go through each of my 6 stock picks I have also considered where the stock currently trades relative to its growth and other performance metrics. With that in mind, as is my tendency (and was stated in my last post), I am continuing to recommend Tesla, Facebook, Amazon, Stitch Fix and DocuSign. I am adding Zoom Video Communications (ZM) to the list. For Zoom and Amazon I will recommend a more complex transaction to achieve my target return.

2020 Stock Recommendations:

1. Tesla stock appreciation will continue to outperform the market (it closed last year at $418/share)

Tesla is likely to continue to be a volatile stock, but it has so many positives in front of it that I believe it wise to continue to own it. The upward trend in units and revenue should be strong in 2020 because:

  • The model 3 continues to be one of the most attractive cars on the market. Electric Car Reviews has come out with a report stating that Model 3 cost of ownership not only blows away the Audi AS but is also lower than a Toyota Camry! The analysis is that the 5-year cost of ownership of the Tesla is $0.46 per mile while the Audi AS comes in 70% higher at $0.80 per mile. While Audi being more expensive is no surprise, what is shocking is how much more expensive it is. The report also determined that Toyota Camry has a higher cost as well ($0.49/mile)! Given the fact that the Tesla is a luxury vehicle and the Camry is far from that, why would anyone with this knowledge decide to buy a low-end car like a Camry over a Model 3 when the Camry costs more to own?  What gets the Tesla to a lower cost than the Camry is much lower fuel cost, virtually no maintenance cost and high resale value. While the Camry purchase price is lower, these factors more than make up for the initial price difference
  • China, the largest market for electronic vehicles, is about to take off in sales. With the new production facility in China going live, Tesla will be able to significantly increase production in 2020 and will benefit from the car no longer being subject to import duties in China.  
  • European demand for Teslas is increasing dramatically. With its Chinese plant going live, Tesla will be able to partly meet European demand which could be as high as the U.S. in the future. The company is building another factory in Europe in anticipation. The earliest indicator of just how much market share Tesla can reach has occurred in Norway where electric cars receive numerous incentives. Tesla is now the best selling car in that country and demand for electric cars there now exceeds gas driven vehicles.

While 2020 is shaping up as a stairstep uptick in sales for Tesla given increased capacity and demand, various factors augur continued growth well beyond 2020. For example, Tesla is only partway towards having a full lineup of vehicles. In the future it will add:

  • Pickup trucks – where pre-orders and recent surveys indicate it will acquire 10-20% of that market
  • A lower priced SUV – at Model 3 type pricing this will be attacking a much larger market than the Model X
  • A sports car – early specifications indicate that it could rival Ferrari in performance but at pricing more like a Porsche
  • A refreshed version of the Model S
  • A semi – where the lower cost of fuel and maintenance could mean strong market share.

2. Facebook stock appreciation will continue to outperform the market (it closed last year at $205/share)

Facebook, like Tesla, continues to have a great deal of controversy surrounding it and therefore may sometimes have price drops that its financial metrics do not warrant. This was the case in 2018 when the stock dropped 28% in value during that year. While 2019 partly recovered from what I believe was an excessive reaction, it’s important to note that the 2019 year-end price of $205/share was only 16% higher than at the end of 2017 while trailing revenue will have grown by about 75% in the 2-year period. The EPS run rate should be up in a similar way after a few quarters of lower earnings in early 2019. My point is that the stock remains at a low price given its metrics. I expect Q4 to be quite strong and believe 2020 will continue to show solid growth.

The Facebook platform is still increasing the number of active users, albeit by only about 5%-6%. Additionally, Facebook continues to increase inventory utilization and pricing. In fact, given what I anticipate will be added advertising spend due to the heated elections for president, senate seats, governorships etc., Facebook advertising inventory usage and rates could increase faster (see prediction 7 on election spending).  

Facebook should also benefit by an acceleration of commerce and increased monetization of advertising on Instagram. Facebook started monetizing that platform in 2017 and Instagram revenue has been growing exponentially and is likely to close out 2019 at well over $10 billion. A wild card for growth is potential monetization of WhatsApp. That platform now has over 1.5 billion active users with over 300 million active every day. It appears close to beginning monetization.

The factors discussed could enable Facebook to continue to grow revenue at 20% – 30% annually for another 3-5 years making it a sound longer term investment.

3. DocuSign stock appreciation will continue to outperform the market (it closed last year at $74/share)

DocuSign is the runaway leader in e-signatures facilitating multiple parties signing documents in a secure, reliable way for board resolutions, mortgages, investment documents, etc. Being the early leader creates a network effect, as hundreds of millions of people are in the DocuSign e-signature database. The company has worked hard to expand its scope of usage for both enterprise and smaller companies by adding software for full life-cycle management of agreements. This includes the process of generating, redlining, and negotiating agreements in a multi-user environment, all under secure conditions. On the small business side, the DocuSign product is called DocuSign Negotiate and is integrated with Salesforce.

The company is a SaaS company with a stable revenue base of over 560,000 customers at the end of October, up well over 20% from a year earlier. Its strategy is one of land and expand with revenue from existing customers increasing each year leading to a roughly 40% year over year revenue increase in the most recent quarter (fiscal Q3). SaaS products account for over 95% of revenue with professional services providing the rest. As a SaaS company, gross margins are high at 79% (on a non-GAAP basis).

The company has now reached positive earnings on a non-GAAP basis of $0.11/share versus $0.00 a year ago. I use non-GAAP as GAAP financials distort actual results by creating extra cost on the P&L if the company’s stock appreciates. These costs are theoretic rather than real.

My only concern with this recommendation is that the stock has had a 72% runup in 2019 but given its growth, move to positive earnings and the fact that SaaS companies trade at higher multiples of revenue than others I still believe it can outperform this year.

4. Stitch Fix Stock appreciation will continue to outperform the market (it closed last year at $25.66/share)

Stitch Fix offers customers, who are primarily women, the ability to shop from home by sending them a box with several items selected based on sophisticated analysis of her profile and prior purchases. The customer pays a $20 “styling fee” for the box which can be applied towards purchasing anything in the box. The company is the strong leader in the space with revenue approaching a $2 billion run rate. Unlike many of the recent IPO companies, it has shown an ability to balance growth and earnings. The stock had a strong 2019 ending the year at $25.66 per share up 51% over the 2018 closing price. Despite this, our valuation methodology continues to show it to be substantially under valued and it remains one of my picks for 2020. The likely cause of what I believe is a low valuation is a fear of Amazon making it difficult for Stitch Fix to succeed. As the company gets larger this fear should recede helping the multiple to expand.  

Stitch Fix continues to add higher-end brands and to increase its reach into men, plus sizes and kids. Its algorithms to personalize each box of clothes it ships keeps improving. Therefore, the company can spend less on acquiring new customers as it has increased its ability to get existing customers to spend more and come back more often. Stitch Fix can continue to grow its revenue from women in the U.S. with expansion opportunities in international markets over time. I believe the company can continue to grow by roughly 20% or more in 2020 and beyond.

Stitch Fix revenue growth (of over 21% in the latest reported quarter) comes from a combination of increasing the number of active clients by 17% to 3.4 million, coupled with driving higher revenue per active client. The company accomplished this while generating profits on a non-GAAP basis.

5. Amazon stock strategy will outpace the market (it closed last year at $1848/share).

Amazon shares increased by 23% last year while revenue in Q3 was up 24% year over year. This meant the stock performance mirrored revenue growth. Growth in the core commerce business has slowed but Amazon’s cloud and echo/Alexa businesses are strong enough to help the company maintain roughly 20% growth in 2020. The company continues to invest heavily in R&D with a push to create automated retail stores one of its latest initiatives. If that proves successful, Amazon can greatly expand its physical presence and potentially increase growth through the rollout of numerous brick and mortar locations. But at its current size, it will be difficult for the company to maintain over 20% revenue growth for many years (excluding acquisitions) so I am suggesting a more complex investment in this stock:

  1. Buy X shares of the stock (or keep the ones you have)
  2. Sell Amazon puts for the same number of shares with the puts expiring on January 15, 2021 and having a strike price of $1750. The most recent sale of these puts was for over $126
  3. So, net out of pocket cost would be reduced to $1722
  4. A 20% increase in the stock price (roughly Amazon’s growth rate) would mean 29% growth in value since the puts would expire worthless
  5. If the stock declined 226 points the option sale would be a break-even. Any decline beyond that and you would lose additional dollars.
  6. If the options still have a premium on December 31, I will measure their value on January 15, 2021 for the purposes of performance.

6. I’m adding Zoom Video Communications to the list but with an even more complex investment strategy (the stock is currently at $72.20)

I discussed Zoom Video Communications (ZM) in my post on June 24, 2019. In that post I described the reasons I liked Zoom for the long term:

  1. Revenue retention of a cohort was about 140%
  2. It acquires customers very efficiently with a payback period of 7 months as the host of a Zoom call invites various people to participate in the call and those who are not already Zoom users can be readily targeted by the company at little cost
  3. Gross Margins are over 80% and could increase
  4. The product has been rated best in class numerous times
  5. Its compression technology (the key ingredient in making video high quality) appears to have a multi-year lead over the competition
  6. Adding to those reasons it’s important to note that ZM is improving earnings and was slightly profitable in its most recent reported quarter

The fly in the ointment was that my valuation technology showed that it was overvalued. However, I came up with a way of “future pricing” the stock. Since I expected revenue to grow by about 150% over the next 7 quarters (at the time it was growing over 100% year over year) “future pricing” would make it an attractive stock. This was possible due to the extremely high premiums for options in the stock. So far that call is working out. Despite the company growing revenue in the 3 quarters subsequent to my post by over 57%, my concern about valuation has proven correct and the stock has declined from $76.92 to $72.20. If I closed out the position today by selling the stock and buying back the options (see Table 1) my return for less than 7.5 months would be a 42% profit. This has occurred despite the stock declining slightly due to shrinkage in the premiums.

Table 1: Previous Zoom trade and proposed trade

I typically prefer using longer term options for doing this type of trade as revenue growth of this magnitude should eventually cause the stock to rise, plus the premiums on options that are further out are much higher, reducing the risk profile, but I will construct this trade so that the options expire on January 15, 2021 to be able to evaluate it in one year. In measuring my performance we’ll use the closing stock price on the option expiration date, January 15, 2021 since premiums in options persist until their expiration date so the extra 2 weeks leads to better optimization of the trade.

So, here is the proposed trade (see table 1):

  1. Buy X shares of the stock at $72.20 (today’s price)
  2. Sell Calls for X shares expiring January 15, 2021 at a strike of $80/share for $11.50 (same as last price it traded)
  3. Sell puts for X shares expiring January 15, 2021 with strike of $65/share for $10.00 (same as last price it traded)

I expect revenue growth of 60% or more 4 quarters out. I also expect the stock to rise some portion of that, as it is now closer to its value than when I did the earlier transaction on May 31, 2019. Check my prior post for further analysis on Zoom, but here are 3 cases that matter at December 31, 2020:

  • Stock closes over $80/share (up 11% or more) at end of the year: the profit would be 58% of the net cost of the transaction
    • This would happen because the stock would be called, and you would get $80/share
    • The put would expire worthless
    • Since you paid a net cost of $50.70, net profit would be $29.30
  • Stock closes flat at $72.20:  your profit would be $21.50 (42%)
    • The put and the call would each expire worthless, so you would earn the original premiums you received when you sold them
    • The stock would be worth the same as what you paid
  • Stock closes at $57.85 on December 31: you would be at break even. If it closed lower, then losses would accumulate twice as quickly:
    • The put holder would require you to buy the stock at the put exercise price of $65, $7.15 more than it would be worth
    • The call would expire worthless
    • The original stock would have declined from $72.20 to $57.85, a loss of $14.35
    • The loss on the stock and put together would equal $21.50, the original premiums you received for those options

Outside of my stock picks, I always like to make a few non-stock predictions for the year ahead.

7. The major election year will cause a substantial increase in advertising dollars spent

According to Advertising Analytics political spending has grown an average of 27% per year since 2012. Both the rise of Super PACs and the launch of online donation tools such as ActBlue have substantially contributed to this growth. While much of the spend is targeted at TV, online platforms have seen an increasing share of the dollars, especially Facebook and Google. The spend is primarily in even years, as those are the ones with senate, house and gubernatorial races (except for minor exceptions). Of course, every 4th year this is boosted by the added spend from presidential candidates. The Wall Street Journal projects the 2020 amount will be about $9.9 billion…up nearly 60% from the 2016 election year. It should be noted that the forecast was prior to Bloomberg entering the race and if he remains a viable candidate an additional $2 billion or more could be added to this total.

The portion targeted at the digital world is projected to be about $2.8 billion or about 2.2% of total digital ad spending. Much of these dollars will likely go to Facebook and Google. This spend has a dual impact: first it adds to the revenue of each platform in a direct way, but secondly it can also cause the cost of advertising on those platforms to rise for others as well.

8. Automation of Retail will continue to gain momentum

This will happen in multiple ways, including:

  1. More Brick & Mortar locations will offer some or all the SKUs in the store for online purchase through Kiosks (assisted by clerks/sales personnel). By doing this, merchants will be able to offer a larger variety of items, styles, sizes and colors than can be carried in any one outlet. In addition, the consolidation of inventory achieved in this manner will add efficiency to the business model. In the case of clothing, such stores will carry samples of items so the customer can try them on, partly to optimize fit but also to determine whether he or she likes the way it looks and feels on them. If one observes the massive use of Kiosks at airports it becomes obvious that they reduce the number of employees needed and can speed up checking in. One conclusion is this will be the wave of the future for multiple consumer-based industries.
  2. Many more locations will begin incorporating technology to eliminate the number of employees needed in their stores. Amazon will likely be a leader in this, but others will also provide ways to reduce the cost of ordering, picking goods, checking out and receiving information while at the store.

9. The Warriors will come back strong in the 2020/21 season

Let me begin by saying that this prediction is not being made because I have been so humbled by my miss in the July post where I predicted that the Warriors could edge into the 2020 playoffs and then contend for a title if Klay returned in late February/early March. Rather, it is based on analysis of their opportunity for next season and also an attempt to add a little fun to my Top Ten List!  The benefit of this season:

  • Klay and Curry are getting substantial time off after 5 seasons of heavy stress. They should be refreshed at the start of next season
  • Russell, assuming he doesn’t keep missing games with injuries, is learning the Warriors style of play
  • Because of the injuries to Klay, Curry, Looney, and to a lesser extent Green and Russell, several of the younger members of the team are getting experience at a much more rapid rate than would normally be possible and the Warriors are able to have more time to evaluate them as potential long-term assets
  • If the Warriors continue to lose at their current rate, they will be able to get a high draft choice for the first time since 2012 when they drafted Harrison Barnes with the 7th pick. Since then their highest pick has been between the 28th and 30th player chosen (30 is the lowest pick in the first round)
  • The Warriors will have more cap space available to sign a quality veteran
  • Andre Iguodala might re-sign with the team, and while this is not necessary for my prediction it would be great for him and for the team
  • The veterans should be hungry again after several years of almost being bored during the regular season

I am assuming the Warriors will be relatively healthy next season for this to occur.

10. At least one of the major Unicorns will be acquired by a larger player

In 2019, there was a change to the investing environment where most companies that did not show a hint of potential profitability had difficulty maintaining their market price. This was particularly true of highly touted Unicorns, which mostly struggled to increase their share price dramatically from the price each closed on the day of their IPO. Table 2 shows the 9 Unicorns whose IPOs we highlighted in our last post. Other than Beyond Meat, Zoom and Pinterest, they all appear some distance from turning a proforma profit. Five of the other six are below their price on the first day’s close. A 6th, Peloton, is slightly above the IPO price (and further above the first days close). Beyond Meat grew revenue 250% in its latest quarter and moved to profitability as well. Its stock jumped on the first day and is even higher today.  While Pinterest is showing an ability to be profitable it is still between the price of the IPO and its close on the first day of trading.  Zoom, which is one of our recommended buys, was profitable (on a Non-GAAP basis) and grew revenue 85% in its most recent quarter. A 10th player, WeWork, had such substantial losses that it was unable to have a successful IPO.

Table 2: Recent Unicorn IPOs Stock Price & Profitability Comparisons

Something that each of these companies have in common is that they are all growing revenue at 30% or more, are attacking large markets, and are either in the leadership position in that market or are one of two in such a position. Because of this I believe one or more of these (and comparable Unicorns) could be an interesting acquisition for a much larger company who is willing to help make them profitable. For such an acquirer their growth and leadership position could be quite attractive.

Recap of 2019 Top Ten Predictions

Bull Markets have Tended to Favor My Stock Picks

I entered 2019 with some trepidation as my favored stocks are high beta and if the bear market of the latter portion of 2018 continued, I wasn’t sure I would once again beat the market…it was a pretty close call last year. However, I felt the companies I liked would continue to grow their revenue and hoped the market would reward their performance. As it turns out, the 5 stocks I included in my top ten list each showed solid company performance and the market returned to the bull side. The average gain for the stocks was 45.7% (versus the S&P gain of 24.3%).

Before reviewing each of my top ten from last year, I would like to once again reveal long term performance of the stock pick portion of my top ten list. For my picks, I assume equal weighting for each stock in each year to come up with my performance and then compound the yearly gains (or losses) to provide my 6-year performance. For the S&P my source is Multpl.com.  I’m comparing the S&P index at January 2 of each year to determine annual performance.  My compound gain for the 6-year period is 499% which equates to an IRR of 34.8%. The S&P was up 78% during the same 6-year period, an IRR of 10.1%.

The 2019 Top Ten Predictions Recap

One of my New Year’s pledges was to be more humble, so I would like to point out that I wasn’t 10 for 10 on my picks. One of my 5 stocks slightly under-performed the market and one of my non-stock forecasts was a mixed bag. The miss on the non-stock side was the only forecast outside of tech, once again highlighting that I am much better off sticking to the sector I know best (good advice for readers as well). However, I believe I had a pretty solid year in my forecasts as my stock portfolio (5 of the picks) significantly outperformed the market, with two at approximately market performance and three having amazing performance with increases of 51% to 72%. Regarding the 5 non-stock predictions, 4 were right on target and the 5th was very mixed. As a quick reminder, my predictions were:

Stock Portfolio 2019 Picks:

  • Tesla stock will outpace the market (it closed last year at $333/share and opened this year at $310)
  • Facebook Stock will outpace the market (it closed last year at $131/share)
  • Amazon Stock will outpace the market (it opened the year at $1502/share)
  • Stitch Fix stock appreciation will outpace the market (it closed last year at $17/share)
  • DocuSign stock will outpace the market in 2019 (it is currently at $43/share and opened the year at $41)

5 Non-Stock Predictions:

  • Replacing cashiers with technology will be proven out in 2019
  • Replacing cooks, baristas, and waitstaff with robots will begin to be proven in 2019
  • Influencers will be increasingly utilized to directly drive commerce
  • The Cannabis Sector should show substantial gains in 2019
  • 2019 will be the year of the unicorn IPO

In the discussion below, I’ve listed in bold each of my ten predictions and give an evaluation of how I fared on each.

Tesla stock will outpace the market (it closed last year at $333/share and opened this year at $310)

Tesla proved to be a rocky ride through 2019 as detractors of the company created quite a bit of fear towards the middle of the year, driving the stock to a low of $177 in June. A sequence of good news followed, and the stock recovered and reached a high of $379 in front of the truck unveiling. I’m a very simplistic guy when I evaluate success as I use actual success as the measure as opposed to whether I would buy a product. Critics of the truck used Elon’s unsuccessful demonstration of the truck being “bulletproof” and the fact that it was missing mirrors and windshield wipers to criticize it. Since it is not expected to be production ready for about two years this is ridiculous! If the same critics applied a similar level of skepticism to the state of other planned competitive electric vehicles (some of which are two plus years away) one could conclude that none of them will be ready on time. I certainly think the various announced electric vehicles from others will all eventually ship, but do not expect them to match the Tesla battery and software capability given its 3 to 5-year lead. I said I’m a simple guy, so when I evaluate the truck, I look at the 250,000 pre-orders and notice it equates to over $12.5B in incremental revenue for the product! While many of these pre-orders will not convert, others likely will step in. To me that is strong indication that the truck will be an important contributor to Tesla growth once it goes into production.

Tesla stock recovered from the bad press surrounding the truck as orders for it mounted, the Chinese factory launch was on target and back order volume in the U.S. kept factories at maximum production.  Given a late year run the stock was up to $418 by year end, up 34.9% from the January opening price. But for continuing recommendations I use the prior year’s close as the benchmark (for measuring my performance) which places the gain at a lower 25.6% year over year as the January opening price was lower than the December 31 close. Either way this was a successful recommendation.

Facebook Stock will outpace the market (it closed last year at $131/share)

Facebook, like Tesla, has many critics regarding its stock. In 2018 this led to a 28% decline in the stock. The problem for the critics is that it keeps turning out very strong financial numbers and eventually the stock price has to recognize that. It appears that 2019 revenue will be up roughly 30% over 2018. After several quarters of extraordinary expenses, the company returned to “normal” earnings levels of about 35% of revenue in the September quarter. I expect Q4 to be at a similar or even stronger profit level as it is the seasonally strongest quarter of the year given the company’s ability to charge high Christmas season advertising rates. As a result, the stock has had a banner year increasing to $205/share at year-end up 57% over the prior year’s close making this pick one of my three major winners.

Amazon Stock will outpace the market (it opened the year at $1502/share)

Amazon had another very solid growth year and the stock kept pace with its growth. Revenue will be up about 20% over 2018 and gross margins remain in the 40% range. For Amazon, Q4 is a wildly seasonal quarter where revenue could jump by close to 30% sequentially. While the incremental revenue tends to have gross margins in the 25% – 30% range as it is heavily driven by ecommerce, the company could post a solid profit increase over Q3. The stock pretty much followed revenue growth, posting a 23% year over year gain closing the year at $1848 per share. I view this as another winner, but it slightly under-performed the S&P index.

Stitch Fix stock appreciation will outpace the market (it closed last year at $17/share)

Stitch Fix, unlike many of the recent IPO companies, has shown an ability to balance growth and earnings. In its fiscal year ending in July, year over year growth increased from 26% in FY 2018 to over 28% in FY 2019 (although without the extra week in Q4 of FY 2019 year over year growth would have been about the same as the prior year). For fiscal 2020, the company guidance is for 23% – 25% revenue growth after adjusting for the extra week in Q4 of FY 2019. On December 9th, Stitch Fix reported Q1 results that exceeded market expectations. The stock reacted well ending the year at $25.66 per share and the year over year gain in calendar 2019 moved to a stellar level of 51% over the 2018 closing price.

DocuSign stock will outpace the market in 2019 (it is currently at $43/share and opened the year at $41)

DocuSign continued to execute well throughout calendar 2019. On December 5th it reported 40% revenue growth in its October quarter, exceeding analyst expectations. Given this momentum, DocuSign stock was the largest gainer among our 5 picks at 72% for the year ending at just over $74 per share (since this was a new recommendation, I used the higher $43 price at the time of the post to measure performance). The company also gave evidence that it is reducing losses and not burning cash. Since ~95% of its revenue is subscription, the company is able to maintain close to 80% gross margin (on a proforma basis) and is well positioned to continue to drive growth. But, remember that growth declines for very high growth companies so I would expect somewhat slower growth than 40% in 2020.

Replacing cashiers with technology will be proven out in 2019

A year ago, I emphasized that Amazon was in the early experimental phase of its Go Stores which are essentially cashierless using technology to record purchases and to bill for them. The company now has opened or announced 21 of these stores. The pace is slower than I expected as Amazon is still optimizing the experience and lowering the cost of the technology. Now, according to Bloomberg, the company appears ready to:

  • Open larger format supermarkets using the technology
  • Increase the pace of adding smaller format locations
  • Begin licensing the technology to other retailers, replicating the strategy it deployed in rolling out Amazon Web Services to others

Replacing cooks, baristas, and waitstaff with robots will begin to be proven in 2019

The rise of the robots for replacing baristas, cooks and waitstaff did indeed accelerate in 2019. In the coffee arena, Briggo now has robots making coffee in 7 locations (soon to be in SFO and already in the Austin Airport), Café X robotic coffee makers are now in 3 locations, and there are even other robots making coffee in Russia (GBL Robotics), Australia (Aabak) and Japan (HIS Co). There is similar expansion of robotic pizza and burger cooks from players like Zume Pizza and Creator and numerous robots now serving food. This emerging trend has been proven to work. As the cost of robots decline and minimum wage rises there will be further expansion of this usage including franchise approaches that might start in 2020.

Influencers will be increasingly utilized to directly drive commerce

The use of influencers to drive commerce accelerated in 2019. Possibly the most important development in the arena was the April 2019 launch by Instagram of social commerce. Instagram now let’s influencers use the app to tag and sell products directly, that is, their posts can be “shoppable”. Part of the series of steps Instagram took was adding “checkout” which lets customers purchase products without leaving the walls of the app.

A second increase in the trend is for major influencers to own a portion of companies that depend on their influence to drive a large volume of traffic. In that way they can capture more of the value of their immense influence. Using this concept, Rihanna has become the wealthiest female musician in the world at an estimated net worth of $600 million. The vast majority of her wealth is from ownership in companies where she uses her influence to drive revenue. The two primary ones are Fenty Beauty and Fenty Maison. Fenty Beauty was launched in late 2017 and appears to be valued at over $3 billion. Rihanna owns 15% – do the math! Fenty Maison is a partnership between LVMH (the largest luxury brand owner) and Rihanna announced in May of 2019. It is targeting fashion products and marks the first time the luxury conglomerate has launched a fashion brand from scratch since 1987. Rihanna has more than 70 million followers on Instagram and this clearly establishes her as someone who can influence commerce.

The Cannabis Sector should show substantial gains in 2019

The accuracy of this forecast was a mixed bag as the key companies grew revenue at extremely high rates, but their stock valuations declined resulting in poor performance of the cannabis index (which I had said should be a barometer). A few examples of the performance of the largest public companies in the sector are shown in Table 2.

Table 2: Performance of Largest Public Cannabis Companies

*Note: Canopy last quarter was Sept 2019

In each case, the last reported quarter was calendar Q3. For Tilray, I subtracted the revenue from its acquisition of Manitoba Harvest so that the growth shown is organic growth. I consider this forecast a hit and a miss as I was correct regarding revenue (it was up an average of 282%) but the stocks did not follow suit, even modestly, as the average of the three was a decline of 54%. While my forecast was not for any individual company or stock in the sector, it was wrong regarding the stocks but right regarding company growth. The conclusion is humbling as I’m glad that I exercised constraint in not investing in a sector where I do not have solid knowledge of the way the stocks might perform.

2019 will be the year of the unicorn IPO

This proved true as many of the largest unicorns went public in 2019. Some of the most famous ones included on the list are: Beyond Meat, Chewy, Lyft, Peloton, Pinterest, Slack, The Real Real, Uber and Zoom. Of the 9 shown, four had initial valuations between $8 billion and $12 billion, two over $20 billion and Uber was the highest at an $82 billion valuation. Some unicorns found the public markets not as accepting of losses as the private market, with Lyft and Uber stock coming under considerable pressure and WeWork unable to find public buyers of its stock leading to a failed IPO and shakeup of company management. There is more to come in 2020 including another mega one: Airbnb.

2020 Predictions coming soon

Stay tuned for my top ten predictions for 2020…but please note that all 5 of the stocks recommended for 2019 will remain on the list.

Soundbyte

  • Before the basketball season began, I had a post predicting that the Warriors still had a reasonable chance to make the playoffs (if Klay returned in late February). Talk about feeling humble! I guess, counting this I had 3 misses on my predictions.

Comparing Recent IPO Companies – Should Performance Drive Valuation?

In a past life, while on Wall Street, one of my favorite calls was: “Buy Dell Short Kellogg”. My reasoning behind the call was that while Dell’s revenue and earnings growth was more than 10X that of Kellogg, somehow Kellogg had a much higher PE than Dell. Portfolio managers gave me various reasons they claimed were logical to explain the un-logical situation like: “Kellogg is more reliable at meeting earnings expectations” …. when in truth they had missed estimates 20 straight quarters. What I later came to believe was that the explanation was their overall comfort level with Kellogg because they understood cereal better than they understood a direct marketing PC hardware company at the time. My call worked out well as Dell not only had a revenue CAGR of nearly 50% from January 1995 (FY 95) through January of 2000 (and a 69% EPS CAGR) but also experienced significant multiple expansion while Kellogg revenue grew at just over 1% annually during the ensuing period and its earnings shrunk (as spend was against missed revenue expectations). The success of Dell was a major reason I was subsequently selected as the number one stock picker across Wall Street analysts for 2 years in a row.

I bring up history because history repeats. One of the reasons for my success in investing is that I look at metrics as a basis of long-term valuation. This means ignoring story lines of why the future is much brighter for those with weak metrics or rationales of why disaster will befall a company that has strong results. Of course, I also consider the strength of management, competitive advantages and market size. But one key thesis that comes after studying hundreds of “growth” companies over time is that momentum tends to persist, and strong business models will show solid contribution margin as an indicator of future profitability.

Given this preamble I’ll be comparing two companies that have recently IPO’d. Much like those that supported Kellogg, the supporters of the one with the weaker metrics will have many reasons why it trades at a much higher multiple (of revenue and gross margin dollars) than the one with stronger metrics.  

Based on financial theory, companies should be valued based on future cash flows. When a company is at a relatively mature stage, earnings and earnings growth will tend to be the proxy used and a company with higher growth usually trades at a higher multiple of earnings.   Since many companies that IPO have little or no earnings, many investors use a multiple of revenue to value them but I prefer to use gross margin or contribution margin (where marketing cost is broken out clearly) as a proxy for potential earnings as they are much better indicators of what portion of revenue can potentially translate to future earnings (see our previous post for valuation methodology).

I would like to hold off on naming the companies so readers can look at the metrics with an unbiased view (which is what I try to do). So, let’s refer to them as Company A and Company B. Table 1 shows their recent metrics.

Notes:

  • Growth for Company B included an extra week in the quarter. I estimate growth would have been about 27% year/year without the extra week
  • Disclosures on marketing seem inexact so these are estimates I believe to be materially correct
  • Pre-tax income for Company A is from prior quarter as the June quarter had considerable one-time expenses that would make it appear much worse

Company B is:

  1. Growing 2 -2 ½ times faster
  2. Has over 3X the gross margin percentage
  3. Over 28% contribution margin whereas Company A contribution margin is roughly at 0
  4. Company B is bordering on profitability already whereas Company A appears years away

Yet, Company A is trading at roughly 3.5X the multiple of revenue and almost 11X the multiple of gross margin dollars (I could not use multiple of contribution margin as Company A was too close to zero). In fairness to Company A, its gross margin was much higher in the prior quarter (at 27%). But even giving it the benefit of this higher number, Company B gross margins were still about 65% higher than Company A.

The apparent illogic in this comparison is much like what we saw when comparing Kellogg to Dell many years ago. The reasons for it are similar: investors, in general, feel more comfortable with Company A than they do with Company B. Additionally, Company A has a “story” on why things will change radically in the future. You may have guessed already that Company A is Uber. Company B is Stitchfix, and despite its moving to an industry leading position for buying clothing at home (using data science to customize each offering) there continues to be fear that Amazon will overwhelm it sometime in the future. While Uber stock has declined about 35% since it peaked in late June it still appears out of sync compared to Stitchfix.

I am a believer that, in general, performance should drive valuation, and have profited greatly by investing in companies that are growing at a healthy rate, appear to have a likelihood of continuing to do so in the near future and have metrics that indicate they are undervalued.

Soundbytes

  • It appears that many others are now beginning to focus more closely on gross margins which we have been doing for years. I would encourage a shift to contribution margin, where possible, as this considers the variable cost needed to acquire customers.
  • A few notes about Tesla following our 2019 predictions: My household is about to become a two Tesla family. My wife has owned her second Tesla, a Model S, for over 4 years and I just placed an order to buy a Model 3 as a replacement for my Mercedes 550S. Besides the obvious benefits to the environment, I’m also tired of having to go to gas stations every week. The Model 3 can go 310 miles on a charge, is extremely fast, has a great user interface and has autopilot. I looked at several other cars but found it hard to justify paying twice as much (or more) for a car with less pickup, inferior electronics, etc.
  • If you were wondering why Tesla stock has gone on a run it is because the Chinese Ministry of Industry and Information Technology (MIIT) has added Tesla to its list of approved auto manufacturers (the news of the possibility broke over a week ago). It appears likely that Tesla will begin producing Model 3s out of the new Giga Factory in China some time in Q4. This not only adds capacity for Tesla to increase its unit sales substantially in 2020 but also will save the Company considerable money as it won’t need to ship cars from its US factory. Remember Tesla also is planning on a Giga Factory in Europe to service strong demand there. The company has said that it will choose the location by the end of 2019. Given the intense competition to be the selected location, it is likely that the site chosen will involve substantial incentives to Tesla. While I would not want to predict when it will be in production, Elon Musk expects the date to be sometime in 2021. Various announcements along the way could be positive for Tesla stock.

My Crazy Investment Technique for Solid Growth Stocks

You should not try it!

Applying Private Investment Analysis to the Rash of Mega-IPOs Occurring

The first half of 2019 saw a steady stream of technology IPOs. First Lyft, then Uber, then Zoom, all with different business models and revenue structures. As an early investor in technology companies, I spend a lot of time evaluating models for Venture Capital, but as a (recovering) investment analyst, I also like to take a view around how to structure a probability weighted investment once these companies have hit the public markets. The following post outlines a recent approach that I took to manage the volatility and return in these growth stocks.

Question: Which of the Recent technology IPOs Stands out as a Winning Business Model?

Investing in Lyft and Uber, post IPO, had little interest for me. On the positive side, Lyft revenue growth was 95% in Q1, 2019, but it had a negative contribution margin in 2018 and Q1 2019.  Uber’s growth was a much lower 20% in Q1, but it appears to have slightly better contribution margin than Lyft, possibly even as high as 5%. I expect Uber and Lyft to improve their contribution margin, but it is difficult to see either of them delivering a reasonable level of profitability in the near term as scaling revenue does not help profitability until contribution margin improves. Zoom Video, on the other hand, had contribution margin of roughly 25% coupled with over 100% revenue growth. It also seems on the verge of moving to profitability, especially if the company is willing to lower its growth target a bit.

Zoom has a Strong Combination of Winning Attributes

There is certainly risk in Zoom but based on the momentum we’re seeing in its usage (including an increasing number of startups who use Zoom for video pitches to Azure), the company looks to be in the midst of a multi-year escalation of revenue. Users have said that it is the easiest product to work with and I believe the quality of its video is best in class. The reasons for Zoom’s high growth include:

  1. Revenue retention of a cohort is currently 140% – meaning that the same set of customers (including those who churn) spend 40% more a year later. While this growth is probably not sustainable over the long term, its subscription model, based on plans that increase with usage, could keep the retention at over 100% for several years.
  2. It is very efficient in acquiring customers – with a payback period of 7 months, which is highly unusual for a SaaS software company. This is partly because of the viral nature of the product – the host of the Zoom call invites various people to participate (who may not be previous Zoom users). When you participate, you download Zoom software and are now in their network at no cost to Zoom. They then offer you a free service while attempting to upgrade you to paid.
  3. Gross Margins (GMs) are Software GMs – about 82% and increasing, making the long-term model likely to be quite profitable
  4. Currently the product has the reputation of being best in class (see here) for a comparison to Webex.
  5. Zoom’s compression technology is well ahead of any competitor according to my friend Mark Leslie (a superb technologist and former CEO of Veritas).

The Fly in the Ointment: My Valuation Technique shows it to be Over Valued

My valuation technique, published in one of our blog posts, provides a method of valuing companies based on revenue growth and gross margin. It helps parse which sub-scale companies are likely to be good investments before they reach the revenue levels needed to achieve long term profitability. For Zoom Video, the method shows that it is currently ahead of itself on valuation, but if it grows close to 100% (in the January quarter it was up 108%) this year it will catch up to the valuation suggested by my method. What this means is that the revenue multiple of the company is likely to compress over time.

Forward Pricing: Constructing a Way of Winning Big on Appreciation of Even 10%

So instead of just buying the stock, I constructed a complex transaction on May 29. Using it, I only required the stock to appreciate 10% in 20 months for me to earn 140% on my investment. I essentially “pre-bought” the stock for January 2021 (or will have the stock called at a large profit). Here is what I did:

  1. Bought shares of stock at $76.92
  2. Sold the same number of shares of call options at $85 strike price for $19.84/share
  3. Sold the same number of shares of put options at $70 strike for $22.08/share
  4. Both sets of options expire in Jan 2021 (20 months)
  5. Net out of pocket was $35/share

Given the momentum I think there is a high probability (75% or so) that the revenue run rate in January 2021 (when options mature) will be over 2.5x where it was in Q1 2019. If that is the case, it seems unlikely that the stock would be at a lower price per share than the day I made the purchase despite a potential for substantial contraction of Price/Revenue.

In January 2021, when the options expire, I will either own the same shares, or double the number of shares or I will have had my shares “called” at $85/share.

The possibilities are: 

  • If the stock is $85 or more at the call date, the stock would be called, and my profit would be roughly 140% of the net $35 invested
  • If the stock is between $70 and $85, I would net $42 from the options expiring worthless plus or minus the change in value from my purchase price of $76.92. The gain would exceed 100%
  • If the stock is below $70, I’ll own 2x shares at an average price of $52.50/share – which should be a reasonably good price to be at 20 months out.
  •  Of course, the options can be repurchased, and new options sold during the time period resulting in different outcomes.

Break-Even Point for the Transaction Is a 32% Decline in Zoom Video Stock Price

Portfolio Managers that are “Value Oriented” will undoubtedly have a problem with this, but I view this transaction as the equivalent of a value stock purchase (of a high flyer) since the break-even of $52/share should be a great buy in January 2021. Part of my reasoning is the downside protection offered: where my being forced to honor the put option would mean that in January 2021, I would own twice the number of shares at an average price of $52.50/share. If I’m right about the likelihood of 150% revenue growth during the period, it would mean price/revenue had declined about 73% or more. Is there some flaw in my logic or are the premiums on the options so high that the risk reward appears to favor this transaction?

I started writing this before Zoom reported their April quarter earnings, which again showed over 100% revenue growth year/year. As a result, the stock jumped and was about $100/share. I decided to do a similar transaction where my upside is 130% of net dollars invested…but that’s a story for another day.

Estimating the “Probabilistic” Return Using My Performance Estimates

Because I was uncomfortable with the valuation, I created the transaction described above. I believe going almost 2 years out provides protection against volatility and lowers risk. This can apply to other companies that are expected to grow at a high rate. As to my guess at probabilities:

  1. 75% that revenue run rate is 2.5x January 2019 (base) quarter in the quarter ending in January 2021. A 60% compound annual growth (CAG) for 2 years puts the revenue higher (they grew over 100% in the January 2019 quarter to revenue of $105.8M)
  2. 95% that revenue run rate is over 2.0X the base 2 years later (options expire in January of that year). This requires revenue CAG of 42%. Given that the existing customer revenue retention rate averaged 140% last year, this appears highly likely.
  3. 99% that revenue is over 1.5X the base in the January 2021 quarter (requires slightly over 22% CAG)
  4. 1% that revenue is less than 1.5X

Assuming the above is true, I believe that when I did the initial transaction the probabilities for the stock were (they are better today due to a strong April quarter):

  1. 50% that the stock trades over 1.5X today by January 2021 (it is almost there today, but could hit a speed bump)
  2. 80% that the stock is over $85/share (up 10% from when I did the trade) in January 2021
  3. 10% that the stock is between $70 and $85/share in January 2021
  4. 5% that the stock is between $52 and $70 in January 2021
  5. 5% that the stock is below $52

Obviously, probabilities are guesses since they heavily depend on market sentiment, whereas my revenue estimates are more solid as they are based upon analysis, I’m more comfortable with. Putting the guesses on probability together this meant:

  1. 80% probability of 140% profit = 2.4X
  2. 10% probability of 100% profit = 2.0X
  3. 5% probability of 50% profit (this assumes the stock is in the middle at $61/share) = 1.5X
  4. 5% probability of a loss assuming I don’t roll the options and don’t buy them back early. At $35/share, loss would be 100% = (1.0X)

If I’m right on these estimates, then the weighted probability is 120% profit. I’ve been doing something similar with Amazon for almost 2 years and have had great results to date. I also did part of my DocuSign buy this way in early January. Since then, the stock is up 27% and my trade is ahead over 50%. Clearly if DocuSign (or Amazon or Zoom) stock runs I won’t make the same money as a straight stock purchase would yield given that I’m capped out on those DocuSign shares at slightly under 100% profit, but the trade also provides substantial downside protection.

Conclusion: Investing in Newly Minted IPOs of High Growth Companies with Solid Contribution Margins Can be Done in a “Value Oriented” Way  

When deciding whether to invest in a company that IPOs, first consider the business model:

  • Are they growing at a high rate of at least 30%?
  • Experiencing increasing contribution margins already at 20% or more?
  • Is there visibility to profitability without a landscape change?

Next, try to get the stock on the IPO if possible. If you can’t, is there a way of pseudo buying it at a lower price? The transaction I constructed may be to complex for you to try and carries the additional risk that you might wind up owning twice the number of shares. If you decide to do it make sure you are comfortable with the potential future cash outlay.

R&D: Amazon’s Dirty Little Secret Weapon


Why doesn’t Amazon produce more earnings given its dominance?

Amazon just reported earnings and, as was the case in 2017 and 2016, emphasized that 2019 will be an investment year, so the strong operating margin expansion of 2018 would be capped in 2019. This, of course, is great fodder for bears on the stock as Amazon gave sceptics renewed opportunity to point out that it is a company that has a flawed business model and would find it difficult to ever earn a reasonable return on revenue.

In contrast, I believe that Amazon continues to transform itself into a potential strong profit performer. For example, taking the longer perspective, Amazon’s gross margins are now over 40% up from 27.2% five years ago (2013). So why doesn’t Amazon deliver higher operating margin than the slightly over 6% it reported in 2018? Amazon’s dirty little secret is that it continues to invest heavily in creating future dominance through R&D. Had it spent a similar amount in R&D to its long time competitor, Walmart, EBITDA would have nearly tripled… to over 17% of revenue! I must confess that in the past I haven’t paid enough attention to how much Amazon spends on R&D. As a result, I was surprised that Apple and Microsoft trailed it in voice recognition technology and that Amazon could lead IBM and Microsoft in cloud technology. The reason this occurred is not a surprising one: Amazon outspends Apple, Microsoft and IBM in R&D.

In fact, Amazon now outspends every company in the world (see Table 1) and have been dedicating a larger portion of available dollars to R&D (as measured by the % of gross margin dollars spent on R&D) than any other large technology company, except Qualcomm, for more than 10 years. Even though Amazon had less than 50% of Apple’s revenue and less than 1/3 of its gross margin dollars 5 years ago (2013) Amazon spent nearly 50% more than Apple on R&D that year… by 2018 the gap had increased to close to 100% more.

Table 1: Top 10 (and a few more) U.S. R&D Spenders in 2018 ($Bn)

Sources: market watch, analyst reports, annual filings

Note 1: Ford and GM may be in the top 10 but so far have not reported R&D in 2018. If they report it at year end the table could change. Walmart does not report R&D and their spend is generally unavailable, but I found a reference that said they expected to spend $1.1M in 2017.

Note 2: A 2018 global list would include auto makers VW and Toyota (with R&D of $15.8B and about 10.0B), drug company Roche (&10.8B) and tech company Samsung at $15.3B in place of the lowest 4 in Table 1.

The Innovators Financial Dilemma: Increasing Future Prospects can lower Current Earnings

When I was on Wall Street covering Microsoft (and others) Bill Gates would often point out that the company was going to make large investments the following year so they could stay ahead of competition. He said he was less concerned with what that meant for earnings. That investment helped drive Microsoft to dominance by the late 1990s. Companies are often confronted with the dilemma of whether to increase spending to drive future growth or to maximize current earnings. I believe that investment in R&D, when effective, is correlated to future success.

It is interesting to see how leaders in R&D spending have transitioned over the past 10 years. In 2008 the global leaders in R&D spending included 5 pharma companies, 3 auto makers and only 2 tech companies (Nokia and Microsoft which subsequently merged). In 2018, 6 of the top 7 spenders (Samsung plus the 5 shown in Table 1) were technology companies.

Table 2 – 2008 global R&D leaders ($Bn)

Note: *Facebook data from 2009, first available financials from S-1 filing

It’s hard to change without tanking one’s stock

When a company has a business model that allocates 1% of gross margin dollars to R&D, it is not easy to turn on the dime. If Walmart had decided to invest half as much as Amazon in R&D in 2018, its earnings would have decreased by 80% – 90% and its stock would have depreciated substantially. So, instead it began a buying binge several years ago to try to close the technology gap through acquisitions (which has a much smaller impact on operating margins). It remains to be seen if this strategy will succeed going forward but in the past 5 years Walmart revenue (including acquisitions) increased only 5% while Amazon’s was up 130% in the same period (also including acquisitions).

Whatever Happened to IBM?

When I was growing up, I thought of IBM as the king of tech. In the early 1990s it still seemed to rule the roost. The biggest fear for Microsoft was that IBM could overwhelm it, yet now it appears to be an also ran in technology. From 2014 to 2018, a heyday era for tech companies, its revenue shrank from $93 billion in 2014 to $80 billion in 2018. I can’t tell how much of the problem stems from under investing in R&D versus poor execution, but for the past 5 years it has spent an average of about 13% of GM on R&D, while the 6 tech companies in Table 1 have averaged about 24% of GM dollars with Apple the only one under 20%.


Soundbytes

Soundbyte I: Tesla

  • I recently had a long dialogue with a very smart fund manager and was struck by what I believe to be misinformation he had read regarding Tesla. There were 3 major points that he had heard:
    • The quality of Tesla cars was shoddy
    • Tesla could not maintain reasonable margins as it began producing lower priced Model 3s
    • The upcoming influx of electric cars from companies like Porsche, Jaguar and Audi would take substantial market share away from Tesla

I decided to do a bit of research to determine how valid each of these issues might be.

  • Tesla Quality: I found it hard to believe that the majority of Tesla owners thought the car was of poor quality since every one of the 15 or so people I knew who had bought one had already bought another or were planning to for their next car. So, I found a report on customer satisfaction from Consumer Reports, and I was not surprised to find that Tesla was the number 1 ranked car by customer satisfaction.
  • Tesla margins: this is much harder to predict. Since Tesla is relatively young as a manufacturer it has had numerous issues with production. Yet it is probably ahead of many others when it comes to automating its facilities. This tends to cause gross margins to be lower while volume ramps and higher subsequently. The combination of that, plus moving up the learning curve, should mean that Tesla lowers the cost of producing its products. However, Tesla charges more for cars with higher capacity for distance, but as I understand it uses software to limit battery capacity for lower priced cars. This would mean that a portion of the difference between a lower priced Model 3 and a higher priced one (the battery capacity) would be minimal change in cost, putting pressure on margins. The question becomes whether Tesla’s improving cost efficiencies offset the average price decline of a Model 3 as Tesla begins fulfilling demand for lower priced versions.
  • March 1 Update: After this post was complete (Thursday February 28) the company announced it was closing many showrooms to reduce costs. Then late today (Friday) announced that the $35,000 version of the model 3 is now available. So, we shall soon see the impact. I believe that if Tesla has increased capacity there will be very strong sales. It also likely will experience lower gross margin percentages as it climbs the learning curve and ramps production.
  • Will the influx of electric cars from others impact Tesla market share?


  1. Porsche is an electric sports car starting at $90K – at that price point it is competitive with model S not model 3. In competing with the S it comes down to whether one prefers a sports car to a sedan. I have owned a Porsche in the past and would only consider it if I wanted a sports car with limited seating capacity (but very cool). I loved my Porsche but decided to switch to sedans going forward. Since then I’ve owned only sedans for the past 10+ years. It also appears that early production is almost a year away, so it is unlikely to be competitive for 2019.
  2. Audi is at price points that do compete with the Model 3 and expects to start delivering cars in March. However, I think that is mainly in Europe where Tesla is an emerging brand so it might not impact them at all. When I look at the Audi models I don’t think they will appeal to Tesla buyers as they are very old-line designs (I would call them ugly). The range of the cars on a charge is not yet official but seems likely to be much lower than Tesla which has a big lead in battery technology.
  3. The Jaguar competes with the Tesla Model X but while cheaper, appears a weak competitor.


I don’t want to dismiss the fact that traditional players will be introducing a large number of electronic vehicles. The question really is whether the market size for electric cars is a fixed portion of all cars or whether it will become a much larger part of the entire market over time. I would compare this to fears that analysts had when Lotus and Wordperfect created Windows versions. They felt that Microsoft would lose share of windows spreadsheets and word processors. I agreed but pointed out that Windows was 10% of the entire market for spreadsheets, so having a 90% share gave Microsoft 9% of the overall spreadsheet market. I also predicted Microsoft would have over a 45% share when Windows was 100% of the market. So, while this would decrease Microsoft’s share of Windows spreadsheets, it would grow its total share of the market by 5X Of course we all were proven wrong as Microsoft eventually reached over 90% of the entire market.

For Tesla, the question becomes whether these rivals are helping accelerate the share electric cars will have of the overall market, rather than eroding Tesla volumes. I’m thinking that it’s the former, and that Tesla will have a great volume year in 2019 and that its biggest competitive issue will be whether the Model 3 is so strong that it will get people to buy it over the Model S. Of course, I could be wrong, but believe the odds favor Tesla in 2019, especially the first half of the year where the competitors are not that strong.

Soundbyte II: The NYC / Amazon Deal Collapses

I never cease to be amazed at how little regard some Politicians have for facts. I should likely not have been surprised by the furor created over Amazon locating a major facility in New York City. I thought the $44 billion or more in benefits to the City and State and massive job creation were such a win that no one would contest it. Instead, the dialog centered around the $ 3 billion in tax benefits to Amazon. All but 1/6 of the benefits (which was cash from the state) were based on existing laws and amounted to a reduction of future taxes rather than upfront cash. What a loss for the City.

2019 Top Ten Predictions

Opportunity Knocks!

The 2018 December selloff provides buying opportunity

One person’s loss is another’s gain. The market contraction in the last quarter of the year means that most stocks are at much lower prices than they were in Q3 of 2018. The 5 stocks that I’m recommending (and already own) were down considerably from their Q3 2018 highs. While this may be wishful thinking, returning to those highs by the end of 2019 would provide an average gain of 78%. Each of the 5 had revenue growth of 25% or more last year (and 3 were over 35%) and each is poised for another strong year in 2019.

For the 4 continued recommendations (all of which I mentioned I would recommend again in my last post), I’ll compare closing price on December 31, 2019 to the close on December 31, 2018 for calculating performance. For the new add to my list, I’ll use the stock price as I write this post. I won’t attempt to predict the overall market again (I’m just not that good at it) but feel that the 14% drop in Q4 means there is a better chance that it won’t take a nosedive. However, since stock picks are always relative to the market, success is based on whether my picks, on average, outperform the market.

I’ll start the post with stock picks and then follow with the remaining 5 predictions.

 2019 Stocks  

Tesla stock will outpace the market (it closed last year at $333/share and is essentially the same as I write this)

In Q3, 2018 the Tesla model 3 was the bestselling car in the U.S. in terms of revenue and 5th highest by volume. This drove a 129% revenue increase versus a year earlier and $1.75 in earnings per share versus a loss of $4.22 in the prior quarter. I expect Q4 revenue to increase sequentially and growth year/year to exceed 100%. In Q3, Tesla reported that nearly half of vehicles traded in for the Model 3 were originally priced below $35,000. As Tesla begins offering sub-$40,000 versions of it, demand should include many buyers from this high-volume price range. Since the backlog for the Model 3 is about 300,000 units I expect 2019 sales to remain supply constrained if Tesla can offer lower price points (it already has announced a $2,000 price reduction). The important caveat to demand is that tax credits will be cut in H1 2019, from $7500 to $3750 and then cut again to $1875 in the second half of the year. Part of Tesla’s rationale for a $2000 price drop is to substantially offset the initial reduction of these tax credits.

Tesla began taking orders for its Q1 launch in Europe where demand over time could replicate that in the U.S. The average price of a Model 3 will initially be about $10,000 higher than in the U.S. Tesla is also building a major manufacturing facility in China (where Model 3 prices are currently over $20,000 higher than the U.S.). This Giga-Factory is expected to begin production in the latter half of 2019. While moving production to China for vehicles sold there should eliminate trade war issues, Tesla still expects to begin delivering Model 3s to Chinese customers in March.

The combination of a large backlog, reducing prices within the U.S. and launches in Europe and China should generate strong growth in 2019. Some investors fear price reductions might lead to lower gross margins. When I followed PC stocks on Wall Street, this was a constant question. My answer is the same as what proved true there: strong opportunity for continuous cost reduction should enable gross margins to remain in the 20-25% range in any location that is at volume production. So, perhaps the Chinese Giga-Factory and a future European factory will start at lower margins while volume ramps but expect margins in the U.S. (the bulk of revenue in 2019) to remain in the targeted range. Higher prices in Europe and China due to massive initial demand allows premium pricing which may keep margins close to 20%+ in each.

Facebook stock will outpace the market (it closed last year at $131/share).

Facebook underperformed in 2018, closing the year down 28% despite revenue growth that should be 35% to 40% and EPS tracking to about 36% growth (despite a massive increase in SG&A to spur future results).  The stock reacted to the plethora of criticism regarding privacy of user information coupled with the continuing charges of Russian use of Facebook to impact the election. Before the wave of negative publicity, Facebook reached a high of $218/share in July. Facebook is likely to continue to increase its spending to address privacy issues and to burnish its image. However, scaling revenue could mean it keeps operating margins at a comparable level to 2018 rather than increasing them. Rumors of Facebook’s demise seem highly exaggerated!  According to a December 2018 JP Morgan survey of U.S. Internet users, the three most used social media products were Facebook (88% of participants), Facebook Messenger (61%) and Instagram (47%). Also, 82% of those surveyed picked a Facebook-owned platform as being the most important to them. Finally, the average Facebook user reported checking Facebook roughly 5 times per day with 56% of users spending 15 minutes to an hour or more on the platform on an average day. While Facebook has experienced a minor decrease in overall usage, Instagram usage has increased dramatically. Facebook, Instagram, and WhatsApp together give the company a growing and dominant position.

At the beginning of 2018 Facebook stock was trading at 34 times trailing EPS. By the end of the year the multiple of trailing EPS was below 18. If I assume EPS can grow 20%+ in 2019 (which is below my expectation but higher than the consensus forecast) than a multiple of 20 would put the stock at about $180/share by December 31. If it grew EPS, more in line with revenue and/or returned to a multiple closer to 34 it could reach well over 200.

Two key factors:

  1. A 20% increase in revenue (I expect the increase to be about 30%) adds over $11 billion in revenue. A comparable 20% increase in SG&A would provide over $4 billion in additional money to spend, affording the company ample dollars to devote to incremental marketing without impacting operating margins.
  2. Given the “low” stock price, Facebook increased its buyback program by $9 billion to $15 billion. Since it generates $6B – $7B in cash per quarter from operations (before capex) and has roughly $40 billion in cash and equivalents it could easily increase this further if the stock remains weak. The $15 billion could reduce the share count by as much as 3% in turn increasing EPS by a similar amount.

Amazon stock will outpace the market (it closed last year at $1502/share).

While its stock dropped from its September high of $2050, Amazon remained one of the best market performers in 2018 closing the year at $1502/share. At its 2018 high of $2050, It may have gotten ahead of itself, but at year end it was up less than 2018 revenue growth. Leveraging increased scale meant net income grew faster than revenue and is likely to triple from 2017. Growth will be lower in Q4 then Q3 as Q4 2017 was the first quarter that included all revenue from Whole Foods. Still, I would not be surprised if Amazon beat expectations in Q4 since this is already factored into analyst forecasts. Amazon trades on revenue coupled with the prospect of increasingly mining the revenue into higher profits. But the company will always prioritize making long term investments over maximizing near term earnings. Growth in the core ecommerce business is likely to gradually slow, but Amazon has created numerous revenue streams like its cloud and echo/Alexa businesses that I expect to result in maintaining revenue growth in the 20% plus range in 2019. The prospect of competing with an efficient new brick and mortar offering (see prediction 6 in this post) could drive new excitement around the stock.

Profitability in 2019 could be reduced by: announced salary increases to low end workers; increasing the number of physical store locations; and greater marketing incentives for customers. Offsets to this include higher growth in stronger margin businesses like AWS and subscription services. The stock may gyrate a bit, but I expect it to continue to outperform.

Stitch Fix stock will outpace the market (it closed last year at $17/share).

In my 2018 forecast I called this my riskiest pick and it was the most volatile which is saying a lot given the turbulence experience by Facebook, Tesla, and Amazon. I was feeling pretty smug when the stock reached a high of $52/share in September! I’m not sure how much of the subsequent drop was due to VCs and other early investors reducing their positions but this can have an impact on newly minted public companies. Whatever the case, the stock dropped from September’s high to a low point of $17.09 by year’s end. The drop was despite the company doing a good job balancing growth and profitability with October quarter revenue up 24% and earnings at $10.7 million up from $1.3 million in the prior year. Both beat analyst expectations. The stock was impacted because the number of users grew 22% (1-2% less than expected) despite revenue exceeding expectations at 24% growth. I’m not sure why this was an issue.

Stitch Fix continues to add higher-end brands and to increase its reach into men, plus sizes and kids. Its algorithms to personalize each box of clothes it ships keeps improving. Therefore, the company can spend less on acquiring new customers as it has increased its ability to get existing customers to spend more and come back more often. I believe the company can grow by roughly 20% or more in 2019. If it does and achieves anything close to the revenue multiple that it started with in 2018 (before the multiple doubled in mid-year), there would be a sizeable stock gain this year. But it is a thinly traded stock and likely to be quite volatile.

Docusign Stock will outpace the market in 2019 (it is currently at $43/share).

Docusign is a new recommendation. Like Stitch Fix, it is a recent IPO and could be volatile. Docusign is the runaway leader in e-signatures, facilitating multiple parties signing documents in a secure, reliable way on board resolutions, mortgages, investment documents, etc. Strong positives include:

  • A high value for a reasonable price – I am increasingly annoyed when I need to deal with manual signatures for documents.
  • As of October 31, 2018, Docusign had over 450,000 customers up from 350,000 customers one year earlier. Of which 50,000 are Enterprise/Commercial accounts;
  • There are hundreds of millions of users whose e-signatures are stored by the company making the network effect quite large;
  • Roughly 95% of revenue is from its SaaS product which has 80% gross margin with the rest from services where margins have improved and are now positive;
  • As a SaaS company with a stable revenue base growth is more predictable. The company exceeded revenue guidance each quarter with the October 31, 2018 quarter revenue up 37%;
  • Most customers pay annually in advance. This means cash flow from operations is positive despite the company recording an operating loss;
  • Customers expand their use resulting in retained customers growing revenue faster than decreases from churned customers making net revenue retention over 100%;
  • International expansion remains a large opportunity as international is only 18% of revenue.

Picks 6 – 10: Major Trends that will surface in 2019

I developed my primary method of stock picking at my first Wall Street firm, Stanford Bernstein. The head of research there, Chuck Cahn, emphasized that you could get small wins by correctly determining that a stock would trade up on certain news like a new product, a big customer win, and beating consensus forecasts. But larger and more predictable wins of 5X or more were possible if one identified a long-term winner riding a major trend and stuck with it for multiple years. All 5 of my stock picks fall into the latter category. I’ve been recommending Facebook, Tesla, and Amazon for 4 years or more. All 3 are now over 5X from when I first targeted them as I bought Tesla at $46 and Facebook at $24 in 2013 (before this blog) and they have been in my top 10 since. Amazon was first included in 2015 when it was at $288/share. Stitch Fix and DocuSign are riskier but if successful have substantial upside since both are early in their run of leveraging their key trends.

The next 4 picks are in early stages of trends that could lead to current and next generation companies experiencing benefits for many years. The first two go hand in hand as each describes transformation of physical retail/restaurants, namely, replacing staff with technology in a way that improves the customer experience. This is possible because we are getting closer to the tipping point where the front-end investment in technology can have a solid ROI from subsequent cost savings.

Replacing Cashiers with technology will be proven out in 2019

In October 2015 I predicted that Amazon (and others like Warby Parker) would move into physical retail between then and 2020. This has occurred with Amazon first opening bookstores and then buying Whole Foods, and Warby Parker expanding its number of physical locations to about 100 by the end of 2018. My reasoning then was simple: over 92% of purchases in the U.S. were made offline. Since Amazon had substantial share of e-commerce it would begin to have its growth limited if it didn’t create an off-line presence.

Now, for Amazon to maintain a 20% or greater revenue growth rate it’s even more important for it to increase its attack on offline commerce (now about 90% of U.S. retail) I’m not saying it won’t continue to try to increase its 50% share of online but at its current size offline offers a greater opportunity for growth.

A key to Amazon’s success has been its ability to attack new markets in ways that give it a competitive advantage. Examples of this are numerous but three of the most striking are Amazon Cloud Services (where it is the industry leader), the Kindle (allowing it to own 70% share of eBook sales) and Prime (converting millions of customers to a subscription which in turn incentivized buying more from Amazon due to free shipping).

Now the company is testing an effort to transform brick and mortar retail by replacing staff with technology and in doing so improving the buying experience. The format is called Go stores and there are currently 5 test locations. Downloading the Amazon Go App enables the user to use it to open the automated doors. The store is stocked (I think by actual people) with many of the same categories of products as a 7-Eleven, in a more modern way. Food items include La Boulangerie pastries, sushi, salads, an assortment of sandwiches and even meal kits. Like a 7-Eleven, it also has convenience items like cold medicine, aspirins, etc. The store uses cameras and sensors to track your movements, items you remove from the shelves and even whether you put an item back. When you leave, the app provides you with a digital receipt. Not only does the removal of cashiers save Amazon money but the system improves customer service by eliminating any need to wait in line. I expect Amazon to open thousands of these stores over the next 3-5 years as it perfects the concept. In the future I believe it will have locations that offer different types of inventory. While Amazon may be an early experimenter here, there is opportunity for others to offer similar locations relying on third party technology.

Replacing Cooks, Baristas and Waitstaff with robots will begin to be proven in 2019

The second step in reducing physical location staff will accelerate in 2019. There are already:

  1. Robotic coffee bars:  CafeX opened in San Francisco last year, and in them one orders drip coffee, cappuccino, latte, or hot chocolate using an app on your phone or an iPad available at a kiosk. The coffee is made and served by a robot “barista” with the charge automatically put on your credit card. Ordering, billing, and preparation are automatic, but there is still one staff member in the shop to make sure things go smoothly.
  2. The first robotic burger restaurant: Creator opened in San Francisco last June. It was in beta mode through September before opening to the general public. While a “robot” makes the burgers, Creator is not as automated as CafeX as humans prepare the sauces and prep the items that go into the machine. Creator also hasn’t automated ordering/payment. Startup Momentum Machines expects to open a robotic burger restaurant and has gotten substantial backing from well-known VCs.
  3. Robots replacing waitstaff: For example, at Robo Sushi in Toronto, a “Butlertron” escorts you to your table, you order via an iPad and a second robot delivers your meal. Unlike the robots in the coffee bar and burger restaurant these are made into cute characters rather than a machine. Several Japanese companies are investing in robotic machines that make several of the items offered at a sushi restaurant.
  4. Robotic Pizza restaurants: The furthest along in automation is the Pizza industry. Zume Pizza, a startup that uses robots to make pizzas, has recently received a $375 million investment from Softbank. Zume currently uses a mix of humans and robots to create and deliver their pizzas and is operational in the Bay Area. Pizza Hut and Dominos are working on drones and/or self-driving vehicles to deliver pizzas. And Little Caesars was just issued a patent for a robotic arm and other automated mechanisms used to create a pizza.

At CES, a robot that makes breads was announced. What all these have in common is replacing low end high turnover employees with technology for repetitive tasks. The cost of labor continues to rise while the cost of technology shrinks a la Moore’s Law. It is just a matter of time before these early experiments turn into a flood of change. I expect many of these experiments will turn into “proof points” in 2019. Successful experiments will generate substantial adoption in subsequent years. Opportunities exist to invest in both suppliers and users of many robotic technologies.

“Influencers” will be increasingly utilized to directly drive Commerce

Companies have long employed Influencers as spokespersons for products and in some cases even as brands (a la Michael Jordon and Stephan Curry basketball shoes or George Forman Grills). They appear on TV ads for products and sometimes used their social reach to tout them. Blogger, a prior Azure investment, understood how to use popular bloggers in advertising campaigns. But Blogger ads, like most TV ads did not directly offer the products to potential customers. Now we are on the verge of two major changes: tech players creating structured ways to enable fans of major influencers (with millions of followers) to use one-click to directly buy products; and technology companies that can economically harness the cumulative power of hundreds of micro-influencers (tens of thousands of fans) to replicate the reach of a major influencer. I expect to see strong growth in this method of Social Commerce this year.

The Cannabis Sector should show substantial gains in 2019

In my last post I said about the Cannabis Sector: “The industry remains at a very early stage, but numerous companies are now public, and the recent market correction has the shares of most of these at more reasonable levels. While I urge great care in stock selection, it appears that the industry has emerged as one to consider investing in.” Earlier in this post, I mentioned that riding a multi-year wave with a winning company in that segment is a way to have strong returns. I’m not knowledgeable enough regarding public Cannabis companies, so I haven’t included any among my stock recommendations. However, I expect industry wide revenue to grow exponentially. The 12 largest public Cannabis companies by descending market cap are: Canopy Growth Corp (the largest at over $11B), Tilray, Aurora Cannabis, GW Pharmaceuticals, Curealeaf Holdings, Aphria, Green Thumb Industries, Cronos Group, Medmen Enterprises, Acreage Holdings, Charlotte’s Web Holdings and Trulieve Cannabis.

I believe one or more of these will deliver major returns over the next 5 years. Last year I felt we would see good fundamentals from the industry but that stocks were inflated. Given that the North American Cannabis Index opened this year at 208 well down from its 2018 high of 386 investing now seems timely. I’ll use this index as the measure of performance of this pick.

2019 will be the Year of the Unicorn IPO

Many Unicorns went public in 2018, but this year is poised to be considerably larger and could drive the largest IPO market fund raising in at least 5 years.  Disbelievers will say: “the market is way down so companies should wait longer.” The reality is the Nasdaq is off from its all-time high in August by about 15% but is higher than its highest level at any time before 2018. Investment funds are looking for new high growth companies to invest in. It appears very likely that as many as 5 mega-players will go public this year if the market doesn’t trade off from here. Each of them is a huge brand that should have very strong individual support. Institutional investors may not be as optimistic if they are priced too high due to the prices private investors have previously paid. They are: Uber, Lyft, Airbnb, Pinterest, and Slack. Each is one of the dominant participants in a major wave, foreshadowing substantial future revenue growth. Because information has been relatively private, I have less knowledge of their business models so can’t comment on whether I would be a buyer. Assuming several of these have successful IPOs many of the other 300 or so Unicorns may rush to follow.

It will be an interesting year!

Interesting KPIs (Key Performance Indicators) for a Subscription Company

what-are-key-performance-indicators-kpis

In working with early stage businesses, I often get the question as to what metrics should management and the board use to help understand a company’s progress. It is important for every company to establish a set of consistent KPIs that are used to objectively track progress. While these need to be a part of each board package, it is even more important for the executive team to utilize this for managing their company. While this post focuses on SaaS/Subscription companies, the majority of it applies to most other types of businesses.

Areas KPIs Should Cover

  1. P&L Trends
  2. MRR (Monthly Recurring Revenue) and LTR (Lifetime Revenue)
  3. CAC (Cost of Customer Acquisition)
    1. Marketing to create leads
    2. Customers acquired electronically
    3. Customers acquired using sales professionals
  4. Gross Margin and LTV (Life Time Value of a customer)
  5. Marketing Efficiency

Many companies will also need KPIs regarding inventory in addition to the ones above.

While there may be very complex analysis behind some of these numbers, it’s important to try to keep KPIs to 2-5 pages of a board package. Use of the right KPIs will give a solid, objective, consistent top-down view of the company’s progress. The P&L portion of the package is obviously critical, but I have a possibly unique view on how this should be included in the body of a board package.

P&L Trends: Less is More

One mistake many companies make is confusing detail with better analysis. I often see models that have 50-100 line items for expenses and show this by month for 3 or more years out… but show one or no years of history. What this does is waste a great deal of time on predicting things that are inconsequential and controllable (by month), while eliminating all perspective. Things like seasonality are lost if one is unable to view 3 years of revenue at a time without scrolling from page to page. Of course, for the current year’s budget it is appropriate for management to establish monthly expectations in detail, but for any long-term planning, success revolves around revenue, gross margins, marketing/sales spend and the number of employees. For some companies that are deep technology players there may be significant costs in R&D other than payroll, but this is the exception. By using a simple formula for G&A based on the number of employees, the board can apply a sanity check on whether cost estimates in the long-term model will be on target assuming revenue is on target. So why spend excessive time on nits? Aggregating cost frees up time for better understanding how and why revenue will ramp, the relationship between revenue types and gross margin, the cost of acquiring a customer, the lifetime value of a customer and the average spend per employee.

In a similar way, the board is well served by viewing a simple P&L by quarter for 2 prior years plus the current one (with a forecast of remaining quarters). The lines could be:

Table1: P&L by Quarter

A second version of the P&L should be produced for budget comparison purposes. It should have the same rows but have the columns be current period actual, current period budget, year to date (YTD) actual, year to date budget, current full year forecast, budget for the full year.

Table 2: P&L Actual / Budget Comparison

Tracking MRR and LTR

For any SaaS/Subscription company (I’ll simply refer to this as SaaS going forward) MRR growth is the lifeblood of the company with two caveats: excessive churn makes MRR less valuable and excessive cost in growing MRR also leads to deceptive prosperity. More about that further on. MRR should be viewed on a rolling basis. It can be done by quarter for the board but by month for the management team. Doing it by quarter for the board enables seeing a 3-year trend on one page and gives the board sufficient perspective for oversight. Management needs to track this monthly to better manage the business. A relatively simple set of KPIs for each of 12 quarterly periods would be:

Table 3: MRR and Retention

Calculating Life Time Revenue through Cohort Analysis

The detailed method of calculating LTR does not need to be shown in every board package but should be included at least once per year, but calculated monthly for management.

The LTR calculation uses a grid where the columns would be the various Quarterly cohorts, that is all customers that first purchased that quarter (management might also do this using monthly instead of quarterly). This analysis can be applied to non-SaaS companies as well as SaaS entities. The first row would be the number of customers in the cohort. The next row would be the first month’s revenue for the cohort, the next the second months revenue, and so on until reaching 36 months (or whatever number the board prefers for B2B…I prefer 60 months). The next row would be the total for the full period and the final row would be the average Lifetime Revenue, LTR, per member of the cohort.

Table 4: Customer Lifetime Revenue

A second table would replicate the grid but show average per member of the cohort for each month (row). That table allows comparisons of cohorts to see if the average revenue of a newer cohort is getting better or worse than older ones for month 2 or month 6 or month 36, etc.

Table 5: Average Revenue per Cohort

Cohorts that have a full 36 months of data need to be at least 36 months old. What this means is that more recent cohorts will not have a full set of information but still can be used to see what trends have occurred. For example, is the second months average revenue for a current cohort much less than it was for a cohort one year ago? While newer cohorts do not have full sets of monthly revenue data, they still are very relevant in calculating more recent LTR. This can be done by using average monthly declines in sequential months and applying them to cohorts with fewer months of data.

Customer Acquisition Cost (CAC)

Calculating CAC is done in a variety of ways and is quite different for customers acquired electronically versus those obtained by a sales force.  Many companies I’ve seen have a combination of the two.

Marketing used to generate leads should always be considered part of CAC. The marketing cost in a month first is divided by the number of leads to generate a cost/lead. The next step is to estimate the conversion rate of leads to customers. A simple table would be as follows:

Table 6: Customer Acquisition Costs

table 6.1

For an eCommerce company, the additional cost to convert might be one free month of product or a heavily subsidized price for the first month. If the customer is getting the item before becoming a regular paying customer than the CAC would be:

CAC = MCTC / the percent that converts from the promotional trial to a paying customer.

CAC when a Sales Force is Involved

For many eCommerce companies and B2B companies that sell electronically, marketing is the primary cost involved in acquiring a paying customer. For those utilizing a sales force, the marketing expense plus the sales expense must be accumulated to determine CAC.

Typically, what this means is steps 1 through 3 above would still be used to determine CPL, but step 1 above might include marketing personnel used to generate leads plus external marketing spend:

  1. CPL (cost per lead) as above
  2. Sales Cost = current month’s cost of the sales force including T&E
  3. New Customers in the month = NC
  4. Conversion Rate to Customer = NC/number of leads= Y%
  5. CAC = CPL/Y% + (Sales Cost)/NC

There are many nuances ignored in the simple method shown. For example, some leads may take many months to close. Some may go through a pilot before closing. Therefore, there are more sophisticated methods of calculating CAC but using this method would begin the process of understanding an important indicator of efficiency of customer acquisition.

Gross Margin (GM) is a Critical Part of the Equation

While revenue is obviously an important measure of success, not all revenue is the same. Revenue that generates 90% gross margin is a lot more valuable per dollar than revenue that generates 15% gross margin. When measuring a company’s potential for future success it’s important to understand what level of revenue is required to reach profitability. A first step is understanding how gross margin may evolve. When a business scales there are many opportunities to improve margins:

  • Larger volumes may lead to larger discounts from suppliers
  • Larger volumes for products that are software/content may lower the hosting cost as a percent of revenue
  • Shipping to a larger number of customers may allow opening additional distribution centers (DCs) to facilitate serving customers from a DC closer to their location lowering shipping cost
  • Larger volumes may mean improved efficiency in the warehouse. For example, it may make more automation cost effective

When forecasting gross margin, it is important to be cautious in predicting some of these savings. The board should question radical changes in GM in the forecast. Certain efficiencies should be seen in a quarterly trend, and a marked improvement from the trend needs to be justified. The more significant jump in GM from a second DC can be calculated by looking at the change in shipping rates for customers that will be serviced from the new DC vs what rates are for these customers from the existing one.

Calculating LTV (Lifetime Value)

Gross Margin, by itself may be off as a measure of variable profits of a customer. If payment is by credit card, then the credit card cost per customer is part of variable costs. Some companies do not include shipping charges as part of cost of goods, but they should always be part of variable cost. Customer service cost is typically another cost that rises in proportion to the number of customers. So:

Variable cost = Cost of Goods sold plus any cost that varies directly with sales

Variable Profit = Revenue – Variable Cost

Variable Profit% (VP%) = (Variable Profit)/Revenue

LTV = LTR x VP%

The calculation of VP% should be based on current numbers as they will apply going forward. Determining a company’s marketing efficiency requires comparing LTV to the cost of customer acquisition. As mentioned earlier in the post, if the CAC is too large a proportion of LTV, a company may be showing deceptive (profitless) growth. So, the next set of KPIs address marketing efficiency.

Marketing Efficiency

It does not make sense to invest in an inefficient company as they will burn through capital at a rapid rate and will find it difficult to become profitable. A key measure of efficiency is the relationship between LTV and CAC or LTV/CAC. Essentially this is how many dollars of variable profit the company will make for every dollar it spends on marketing and sales. A ratio of 5 or more usually means the company is efficient. The period used for calculating LTR will influence this number. Since churn tends to be much lower for B2B companies, 5 years is often used to calculate LTR and LTV. But, using 5 years means waiting longer to receive resulting profits and can obscure cash flow implications of slower recovery of CAC. So, a second metric important to understand burn is how long it takes to recover CAC:

CAC Recovery Time = number of months until variable profit equals the CAC

The longer the CAC recovery time, the more capital required to finance growth. Of course, existing customers are also contributing to the month’s revenue alongside new customers. So, another interesting KPI is contribution margin which measures the current state of balance between marketing/sales and Variable Profits:

Contribution Margin = Variable Profits – Sales and Marketing Cost

Early on this number will be negative as there aren’t enough older customers to cover the investment in new ones. But eventually the contribution margin in a month needs to turn positive. To reach profitability it needs to exceed all other costs of the business (G&A, R&D, etc.). By reducing a month’s marketing cost, a company can improve contribution margin that month at the expense of sequential growth… which is why this is a balancing act.

I realize this post is long but wanted to include a substantial portion of KPIs in one post. However, I’ll leave more detailed measurement of sales force productivity and deeper analysis of several of the KPIs discussed here for one or more future posts.

Soundbytes

I’ll begin by apologizing for a midyear brag, but I always tell others to enjoy success and therefore am about to do that myself. In my top ten predictions for 2018 I included a market prediction and 4 stock predictions. I was feeling pretty good that they were all working well when I started to create this post. However, the stock prices for high growth stocks can experience serious shifts in very short periods. Facebook and Tesla both had (what I consider) minor shortfalls against expectations in the 10 days since and have subsequently declined quite a bit in that period. But given the strength of my other two recommendations, Amazon and Stitchfix, the four still have an average gain of 15% as of July 27. Since I’ve only felt comfortable predicting the market when it was easy (after 9/11 and after the 2008 mortgage blowup), I was nervous about predicting the S&P would be up this year as it was a closer call and was somewhat controversial given the length of the bull market prior to this year. But it seemed obvious that the new tax law would be very positive for corporate earnings. So, I thought the S&P would be up despite the likelihood of rising interest rates. So far, it is ahead 4.4% year to date driven by stronger earnings. Since I always fear that my record of annual wins can’t continue I wanted to take a midyear victory lap just in case everything collapses in the second half of the year (which I don’t expect but always fear). So I continue to hold all 4 stocks and in fact bought a bit more Facebook today.

Company Valuations Implied by my Valuations Bible: Are Snap, Netflix, Square and Twitter Grossly Overvalued?

Applying the Gross Margin Multiple Method to Public Company Valuation

In my last two posts I’ve laid out a method to value companies not yet at their mature business models. The method provides a way to value unprofitable growth companies and those that are profitable but not yet at what could be their mature business model. This often occurs when a company is heavily investing in growth at the expense of near-term profits. In the last post, I showed how I would estimate what I believed the long-term model would be for Tesla, calling the result “Potential Earnings” or “PE”. Since this method requires multiple assumptions, some of which might not find agreement among investors, I provided a second, simplified method that only involved gross margin and revenue growth.

The first step was taking about 20 public companies and calculating how they were valued as a multiple of gross margin (GM) dollars. The second step was to determine a “least square line” and formula based on revenue growth and the gross margin multiple for these companies. The coefficient of 0.62 shows that there is a good correlation between Gross Margin and Revenue Growth, and one significantly better than the one between Revenue Growth and a company’s Revenue Multiple (that had a coefficient of 0.36 which is considered very modest).

Where’s the Beef?

The least square formula derived in my post for relating revenue growth to an implied multiple of Gross Margin dollars is:

GM Multiple = (24.773 x Revenue growth percent) + 4.1083

Implied Company Market Value = GM Multiple x GM Dollars

Now comes the controversial part. I am going to apply this formula to 10 companies using their data (with small adjustments) and compare the Implied Market Value (Implied MKT Cap) to their existing market Cap as of several days ago. I’ll than calculate the Implied Over (under) Valuation based on the comparison. If the two values are within 20% I view it as normal statistical variation.

Table 1: Valuation Analysis of 10 Tech Companies

  • * Includes net cash included in expected market cap
  • ** Uses adjusted GM%
  • *** Uses 1/31/18 year end
  • **** Growth rate used in the model is q4 2017 vs q4 2016.  See text

This method suggests that 5 companies are over-valued by 100% or more and a fifth, Workday, by 25%. Since Workday is close to a normal variation, I won’t discuss it further. I have added net cash for Facebook, Snap, Workday and Twitter to the implied market cap as it was material in each case but did not do so for the six others as the impact was not as material.

I decided to include the four companies I recommended, in this year’s top ten list, Amazon, Facebook, Tesla and Stitchfix, in the analysis. To my relief, they all show as under-valued with Stitchfix, (the only one below the Jan 2 price) having an implied valuation more than 100% above where it currently trades. The other three are up year to date, and while trading below what is suggested by this method, are within a normal range. For additional discussion of these four see our 2018 top Ten List.


Digging into the “Overvalued” Five

Why is there such a large discrepancy between actual market cap and that implied by this method for 5 companies? There are three possibilities:

  1. The method is inaccurate
  2. The method is a valid screen but I’m missing some adjustment for these companies
  3. The companies are over-valued and at some point, will adjust, making them risky investments

While the method is a good screen on valuation, it can be off for any given company for three reasons:  the revenue growth rate I’m using will radically change; a particular company has an ability to dramatically increase gross margins, and/or a particular company can generate much higher profit margins than their gross margin suggests. Each of these may be reflected in the company’s actual valuation but isn’t captured by this method.

To help understand what might make the stock attractive to an advocate, I’ll go into a lot of detail in analyzing Snap. Since similar arguments apply to the other 4, I’ll go into less detail for each but still point out what is implicit in their valuations.

Snap

Snap’s gross margin (GM) is well below its peers and hurts its potential profitability and implied valuation. Last year, GM was about 15%, excluding depreciation and amortization, but it was much higher in the seasonally strong Q4. It’s most direct competitor, Facebook, has a gross margin of 87%.  The difference is that Facebook monetizes its users at a much higher level and has invested billions of dollars and executed quite well in creating its own low-cost infrastructure, while Snap has outsourced its backend to cloud providers Google and Amazon. Snap has recently signed 5-year contracts with each of them to extend the relationships. Committing to lengthy contracts will likely lower the cost of goods sold.  Additionally, increasing revenue per user should also improve GM.  But, continuing to outsource puts a cap on how high margins can reach. Using our model, Snap would need 79% gross margin to justify its current valuation. If I assume that scale and the longer-term contracts will enable Snap to double its gross margins to 30%, the model still shows it as being over-valued by 128% (as opposed to the 276% shown in our table). The other reason bulls on Snap may justify its high valuation is that they expect it to continue to grow revenue at 100% or more in 2018 and beyond. What is built into most forecasts is an assumed decline in revenue growth rates over time… as that is what typically occurs. The model shows that growing revenue 100% a year for two more years without burning cash would leave it only 32% over-valued in 2 years. But as a company scales, keeping revenue growth at that high a level is a daunting task. In fact, Snap already saw revenue growth decline to 75% in Q4 of 2017.

Twitter

Twitter is not profitable.  Revenue declined in 2017 after growing a modest 15% in 2016, and yet it trades at a valuation that implies that it is a growth company of about 50%. While it has achieved such levels in the past, it may be difficult to even get back to 15% growth in the future given increased competition for advertising.

Netflix

I recommended Netflix in January 2015 as one of my stock picks for the year, and it proved a strong recommendation as the stock went up about 140% that year. However, between January 2015 and January 2018, the stock was up over 550% while trailing revenue only increased 112%.  I continue to like the fundamentals of Netflix, but my GM model indicates that the stock may have gotten ahead of itself by a fair amount, and it is unlikely to dramatically increase revenue growth rates from last year’s 32%.

Square

Square has followed what I believe to be the average pattern of revenue growth rate decline as it went from 49% growth in 2015, down to 35% growth in 2016, to under 30% growth in 2017. There is no reason to think this will radically change, but the stock is trading as if its revenue is expected to grow at a nearly 90% rate. On the GM side, Square has been improving GM each year and advocates will point out that it could go higher than the 38% it was in 2017. But, even if I use 45% for GM, assuming it can reach that, the model still implies it is 90% over-valued.

Blue Apron

I don’t want to beat up on a struggling Blue Apron and thought it might have reached its nadir, but the model still implies it is considerably over-valued. One problem that the company is facing is that investors are negative when a company has slow growth and keeps losing money. Such companies find it difficult to raise additional capital. So, before running out of cash, Blue Apron began cutting expenses to try to reach profitability. Unfortunately, given their customer churn, cutting marketing spend resulted in shrinking revenue in each sequential quarter of 2017. In Q4 the burn was down to $30 million but the company was now at a 13% decline in revenue versus Q4 of 2016 (which is what we used in our model). I assume the solution probably needs to be a sale of the company. There could be buyers who would like to acquire the customer base, supplier relationships and Blue Apron’s understanding of process. But given that it has very thin technology, considerable churn and strong competition, I’m not sure if a buyer would be willing to pay a substantial premium to its market cap.


An Alternative Theory on the Over Valued Five

I have to emphasize that I am no longer a Wall Street analyst and don’t have detailed knowledge of the companies discussed in this post, so I easily could be missing some important factors that drive their valuation.  However, if the GM multiple model is an accurate way of determining valuation, then why are they trading at such lofty premiums to implied value? One very noticeable common characteristic of all 5 companies in question is that they are well known brands used by millions (or even tens of millions) of people. Years ago, one of the most successful fund managers ever wrote a book where he told readers to rely on their judgement of what products they thought were great in deciding what stocks to own. I believe there is some large subset of personal and professional investors who do exactly that. So, the stories go:

  • “The younger generation is using Snap instead of Facebook and my son or daughter loves it”
  • “I use Twitter every day and really depend on it”
  • “Netflix is my go-to provider for video content and I’m even thinking of getting rid of my cable subscription”

Once investors substitute such inclinations for hard analysis, valuations can vary widely from those suggested by analytics. I’m not saying that such thoughts can’t prove correct, but I believe that investors need to be very wary of relying on such intuition in the face of evidence that contradicts it.

The Valuation Bible – Part 2: Applying the Rules to Tesla and Creating an Adjusted Valuation Method for Startups

This post is part 2 of our valuation discussion (see this post for part 1).  As I write this post Tesla’s market cap is about $56 billion. I thought it would be interesting to show how the rules discussed in the first post apply to Tesla, and then to take it a step further for startups.

Revenue and Revenue Growth

Revenue for Tesla in 2017 was $11.8 billion, about 68% higher than 2016, and it is likely to grow faster this year given the over $20 billion in pre-orders (and growing) for the model 3 coupled with continued strong demand for the model S and model X. Since it is unclear when the new sports car or truck will ship, I assume no revenue in those categories. As long as Tesla can increase production at the pace they expect, I estimate 2018 revenue will be up 80% – 120% over 2017, with Q4 year over year growth at or above 120%.

If I’m correct on Tesla revenue growth, its 2018 revenue will exceed $20 billion. So, Rule Number 1 from the prior post indicates that Tesla’s high growth rates should merit a higher “theoretical PE” than the S&P (by at least 4X if one believes that growth will continue at elevated rates).

Calculating TPE

Tesla gross margins have varied a bit while ramping production for each new model, but in the 16 quarters from Q1, 2014 to Q4, 2017 gross margin averaged 23% and was above 25%, 6 of the 16 quarters. Given that Tesla is still a relatively young company it appears likely margins will increase with scale, leading me to believe that long term gross margins are very likely to be above 25%. While it will dip during the early production ramp of the model 3, 25% seems like the lowest percent to use for long term modeling and I expect it to rise to between 27% and 30% with higher production volumes and newer factory technology.

Tesla recognizes substantial cost based on stock-based compensation (which partly occurs due to the steep rise in the stock). Most professional investors ignore artificial expenses like stock-based compensation, as I will for modeling purposes, and refer to the actual cost as net SG&A and net R&D. Given that Tesla does not pay commissions and has increased its sales footprint substantially in advance of the roll-out of the model 3, I believe Net SG&A and Net R&D will each increase at a much slower pace than revenue. If they each rise 20% by Q4 of this year and revenue is at or exceeds $20 billion, this would put their total at below 20% of revenue by Q4. Since they should decline further as a percent of revenue as the company matures, I am assuming 27% gross margin and 18% operating cost as the base case for long term operating profit. While this gross margin level is well above traditional auto manufacturers, it seems in line as Tesla does not have independent dealerships (who buy vehicles at a discount) and does not discount its cars at the end of each model year.

Estimated TPE

Table 1 provides the above as the base case for long term operating profit. To provide perspective on the Tesla opportunity, Table 1 also shows a low-end case (25% GM and 20% operating cost) and a high-end profit case (30% GM and 16% operating cost).  Recall, theoretic earnings are derived from applying the mature operating profit level to trailing and to forward revenue. For calculating theoretic earnings, I will ignore interest payments and net tax loss carry forwards as they appear to be a wash over the next 5 years. Finally, to derive the Theoretic Net Earnings Percent a potential mature tax rate needs to be applied. I am using 20% for each model case which gives little credit for tax optimization techniques that could be deployed. That would make theoretic earnings for 2017 and 2018 $0.85 billion and $1.51 billion, respectively and leads to:

  • 2017 TPE=$ 56.1 billion/$0.85 = 66.0
  • 2018 TPE= $ 56.1 billion/1.51 = 37.1

The S&P trailing P/E is 25.5 and forward P/E is about 19X. Based on our analysis of the correlation between growth and P/E provided in the prior post, Tesla should be trading at a minimum of 4X the trailing S&P ratio (or 102 TP/E) and at least 3.5X S&P forward P/E (or 66.5 TP/E). To me that shows that the current valuation of Tesla does not appear out of market.  If the market stays at current P/E levels and Tesla reaches $21B in revenue in 2018 this indicates that there is strong upside for the stock.

Table 1: Tesla TPE 2017 & 2018

The question is whether Tesla can continue to grow revenue at high rates for several years. Currently Tesla has about 2.4% share of the luxury car market giving it ample room to grow that share. At the same time, it is entering the much larger medium-priced market with the launch of the Model 3 and expects to produce vehicles in other categories over the next few years. Worldwide sales of new cars for the auto market is about 90 million in 2017 and growing about 5% a year. Tesla is the leader in several forward trends: electric vehicles, automated vehicles and technology within a car. Plus, it has a superior business model as well. If it reaches $21 billion in revenue in 2018, its share of the worldwide market would be about 0.3%. It appears poised to continue to gain share over the next 3-5 years, especially as it fills out its line of product.  Given that it has achieved a 2.4% share of the market it currently plays in, one could speculate that it could get to a similar share in other categories. Even achieving a 1% share of the worldwide market in 5 years would mean about 40% compound growth between 2018 and 2022 and imply a 75X-90X TP/E at the end of this year.

The Bear Case

I would be remiss if I omitted the risks that those negative on the stock point out. Tesla is a very controversial stock for a variety of reasons:

  1. Gross Margin has been volatile as it adds new production facilities so ‘Bears’ argue that even my 25% low case is optimistic, especially as tax rebate subsidies go away
  2. It has consistently lost money so some say it will never reach the mature case I have outlined
  3. As others produce better electric cars Tesla’s market share of electric vehicles will decline so high revenue growth is not sustainable
  4. Companies like Google have better automated technology that they will license to other manufacturers leading to a leap frog of Tesla

As they say, “beauty is in the eyes of the beholder” and I believe my base case is realistic…but not without risk. In response to the bear case that Tesla revenue growth can’t continue, it is important to recognize that Tesla already has the backlog and order momentum to drive very high growth for the next two years. Past that, growing market share over the 4 subsequent years to 1% (a fraction of their current share of the luxury market) would generate compound annual growth of 40% for that 4-year period. In my opinion, the biggest risk is Tesla’s own execution in ramping production. Bears will also argue that Tesla will never reach the operating margins of my base case for a variety of reasons. This is the weakness of the TPE approach: it depends on assumptions that have yet to be proven. I’m comfortable when my assumptions depend on momentum that is already there, gross margin proof points and likelihood that scale will drive operating margin improvements without any radical change to the business model.

Applying the rules to Startups

As a VC I am often in the position of helping advise companies regarding valuation. This occurs when they are negotiating a round of financing or in an M&A situation.  Because the companies are even earlier than Tesla, theoretic earnings are a bit more difficult to establish. Some investors ignore the growth rates of companies and look for comps in the same business. The problem with the comparable approach is that by selecting companies in the same business, the comps are often very slow growth companies that do not merit a high multiple. For example, comparing Tesla to GM or Ford to me seems a bit ludicrous when Tesla’s revenue grew 68% last year and is expected to grow even faster this year while Ford and GM are growing their revenue at rates below 5%. It would be similar if investors compared Apple (in the early days of the iPhone) to Nokia, a company it was obsoleting.

Investors look for proxies to use that best correlate to what future earnings will be and often settle on a multiple of revenue. As Table 2 shows, there is a correlation between valuation as a multiple of revenue and revenue growth regardless of what industry the companies are in. This correlation is closer than one would find by comparing high growth companies to their older industry peers.

Table 2: Multiple of Revenue and Revenue Growth

However, using revenue as the proxy for future earnings suffers from a wide variety of issues. Some companies have 90% or greater gross margins like our portfolio company Education.com, while others have very low gross margins of 10% – 20%, like Spotify. It is very likely that the former will generate much higher earnings as a percent of revenue than the latter. In fact, Education.com is already cash flow positive at a relatively modest revenue level (in the low double-digit millions) while Spotify continues to lose a considerable amount of money at billions of dollars in revenue. Notice, this method also implies that Tesla should be valued about 60% higher than its current market price.

This leads me to believe a better proxy for earnings is gross margin as it is more closely correlated with earnings levels. It also removes the issue of how revenue is recognized and is much easier to analyze than TPE. For example, Uber recognizing gross revenue or net revenue has no impact on gross margin dollars but would radically change its price to revenue. Table 3 uses the same companies as Table 2 but shows their multiple of gross margin dollars relative to revenue growth. Looking at the two graphs, one can see how much more closely this correlates to the valuation of public companies. The correlation coefficient improves from 0.36 for the revenue multiple to 0.62 for the gross margin multiple.

Table 3: Multiple of Gross Margin vs. Revenue Growth

So, when evaluating a round of financing for a pre-profit company the gross margin multiple as it relates to growth should be considered. For example, while there are many other factors to consider, the formula implies that a 40% revenue growth company should have a valuation of about 14X trailing gross margin dollars.  Typically, I would expect that an earlier stage company’s mature gross margin percent would likely increase. But they also should receive some discount from this analysis as its risk profile is higher than the public companies shown here.

Notice that the price to sales graph indicates Tesla should be selling at 60% more than its multiple of 5X revenue. On the other hand, our low-end case for Tesla Gross Margin, 25%, puts Tesla at 20X Gross Margin dollars, just slightly undervalued based on where the least square line in Table 3 indicates it should be valued.

The Valuation Bible

Facebook valuation image

After many years of successfully picking public and private companies to invest in, I thought I’d share some of the core fundamentals I use to think about how a company should be valued. Let me start by saying numerous companies defy the logic that I will lay out in this post, often for good reasons, sometimes for poor ones. However, eventually most companies will likely approach this method, so it should at least be used as a sanity check against valuations.

When a company is young, it may not have any earnings at all, or it may be at an earnings level (relative to revenue) that is expected to rise. In this post, I’ll start by considering more mature companies that are approaching their long-term model for earnings to establish a framework, before addressing how this framework applies to less mature companies. The post will be followed by another one where I apply the rules to Tesla and discuss how it carries over into private companies.

Growth and Earnings are the Starting Points for Valuing Mature Companies

When a company is public, the most frequently cited metric for valuation is its price to earnings ratio (PE). This may be done based on either a trailing 12 months or a forward 12 months. In classic finance theory a company should be valued based on the present value of future cash flows. What this leads to is our first rule:

Rule 1: Higher Growth Rates should result in a higher PE ratio.

When I was on Wall Street, I studied hundreds of growth companies (this analysis does not apply to cyclical companies) over the prior 10-year period and found that there was a very strong correlation between a given year’s revenue growth rate and the next year’s revenue growth rate. While the growth rate usually declined year over year if it was over 10%, on average this decline was less than 20% of the prior year’s growth rate. What this means is that if we took a group of companies with a revenue growth rate of 40% this year, the average organic growth for the group would likely be about 33%-38% the next year. Of course, things like recessions, major new product releases, tax changes, and more could impact this, but over a lengthy period of time this tended to be a good sanity test. As of January 2, 2018, the average S&P company had a PE ratio of 25 on trailing earnings and was growing revenue at 5% per year. Rule 1 implies that companies growing faster should have higher PEs and those growing slower, lower PEs than the average.

Graph 1: Growth Rates vs. Price Earnings Ratios

graph

The graph shows the correlation between growth and PE based on the valuations of 21 public companies. Based on Rule 1, those above the line may be relatively under-priced and those below relatively over-priced. I say ‘may be’ as there are many other factors to consider, and the above is only one of several ways to value companies. Notice that most of the theoretically over-priced companies with growth rates of under 5% are traditional companies that have long histories of success and pay a dividend. What may be the case is that it takes several years for the market to adjust to their changed circumstances or they may be valued based on the return from the dividend. For example, is Coca Cola trading on: past glory, its 3.5% dividend, or is there something about current earnings that is deceptive (revenue growth has been a problem for several years as people switch from soda to healthier drinks)? I am not up to speed enough to know the answer. Those above the line may be buys despite appearing to be highly valued by other measures.

Relatively early in my career (in 1993-1995) I applied this theory to make one of my best calls on Wall Street: “Buy Dell sell Kellogg”. At the time Dell was growing revenue over 50% per year and Kellogg was struggling to grow it over 4% annually (its compounded growth from 1992 to 1995, this was partly based on price increases). Yet Dell’s PE was about half that of Kellogg and well below the S&P average. So, the call, while radical at the time, was an obvious consequence of Rule 1. Fortunately for me, Dell’s stock appreciated over 65X from January 1993 to January 2000 (and well over 100X while I had it as a top pick) while Kellogg, despite large appreciation in the overall stock market, saw its stock decline slightly over the same 7-year period (but holders did receive annual dividends).

Rule 2: Predictability of Revenue and Earnings Growth should drive a higher trailing PE

Investors place a great deal of value on predictability of growth and earnings, which is why companies with subscription/SaaS models tend to get higher multiples than those with regular sales models. It is also why companies with large sales backlogs usually get additional value. In both cases, investors can more readily value the companies on forward earnings since they are more predictable.

Rule 3: Market Opportunity should impact the Valuation of Emerging Leaders

When one considers why high growth rates might persist, the size of the market opportunity should be viewed as a major factor. The trick here is to make sure the market being considered is really the appropriate one for that company. In the early 1990s, Dell had a relatively small share of a rapidly growing PC market. Given its competitive advantages, I expected Dell to gain share in this mushrooming market. At the same time, Kellogg had a stable share of a relatively flat cereal market, hardly a formula for growth. In recent times, I have consistently recommended Facebook in this blog for the very same reasons I had recommended Dell: in 2013, Facebook had a modest share of the online advertising, a market expected to grow rapidly. Given the advantages Facebook had (and they were apparent as I saw every Azure ecommerce portfolio company moving a large portion of marketing spend to Facebook), it was relatively easy for me to realize that Facebook would rapidly gain share. During the time I’ve owned it and recommended it, this has worked out well as the share price is up over 8X.

How the rules can be applied to companies that are pre-profit

As a VC, it is important to evaluate what companies should be valued at well before they are profitable. While this is nearly impossible to do when we first invest (and won’t be covered in this post), it is feasible to get a realistic range when an offer comes in to acquire a portfolio company that has started to mature. Since they are not profitable, how can I apply a PE ratio?

What needs to be done is to try to forecast eventual profitability when the company matures. A first step is to see where current gross margins are and to understand whether they can realistically increase. The word realistic is the key one here. For example, if a young ecommerce company currently has one distribution center on the west coast, like our portfolio company Le Tote, the impact on shipping costs of adding a second eastern distribution center can be modeled based on current customer locations and known shipping rates from each distribution center. Such modeling, in the case of Le Tote, shows that gross margins will increase 5%-7% once the second distribution center is fully functional. On the other hand, a company that builds revenue city by city, like food service providers, may have little opportunity to save on shipping.

  • Calculating variable Profit Margin

Once the forecast range for “mature” gross margin is estimated, the next step is to identify other costs that will increase in some proportion to revenue. For example, if a company is an ecommerce company that acquires most of its new customers through Facebook, Google and other advertising and has high churn, the spend on customer acquisition may continue to increase in direct proportion to revenue. Similarly, if customer service needs to be labor intensive, this can also be a variable cost. So, the next step in the process is to access where one expects the “variable profit margin” to wind up. While I don’t know the company well, this appears to be a significant issue for Blue Apron: marketing and cost of goods add up to about 90% of revenue. I suspect that customer support probably eats up (no pun intended) 5-10% of what is left, putting variable margins very close to zero. If I assume that the company can eventually generate 10% variable profit margin (which is giving it credit for strong execution), it would need to reach about $4 billion in annual revenue to reach break-even if other costs (product, technology and G&A) do not increase. That means increasing revenue nearly 5-fold. At their current YTD growth rate this would take 9 years and explains why the stock has a low valuation.

  • Estimating Long Term Net Margin

Once the variable profit margin is determined, the next step would be to estimate what the long-term ratio of all other operating cost might be as a percent of revenue. Using this estimate I can determine a Theoretic Net Earnings Percent. Applying this percent to current (or next years) revenue yields a Theoretic Earnings and a Theoretic PE (TPE):

TPE= Market Cap/Theoretic Earnings     

To give you a sense of how I successfully use this, review my recap of the Top Ten Predictions from 2017 where I correctly predicted that Spotify would not go public last year despite strong top line growth as it was hard to see how its business model could support more than 2% or so positive operating margin, and that required renegotiating royalty deals with record labels.  Now that Spotify has successfully negotiated a 3% lower royalty rate from several of the labels, it appears that the 16% gross margins in 2016 could rise to 19% or more by the end of 2018. This means that variable margins (after marketing cost) might be 6%. This would narrow its losses, but still means it might be several years before the company achieves the 2% operating margins discussed in that post. As a result, Spotify appears headed for a non-traditional IPO, clearly fearing that portfolio managers would not be likely to value it at its private valuation price since that would lead to a TPE of over 200. Since Spotify is loved by many consumers, individuals might be willing to overpay relative to my valuation analysis.

Our next post will pick up this theme by walking through why this leads me to believe Tesla continues to have upside, and then discussing how entrepreneurs should view exit opportunities.


SoundBytes

I’ve often written about effective shooting percentage relative to Stephen Curry, and once again he leads the league among players who average 15 points or more per game. What also accounts for the Warriors success is the effective shooting of Klay Thompson, who is 3rd in the league, and Kevin Durant who is 6th. Not surprisingly, Lebron is also in the top 10 (4th). The table below shows the top ten among players averaging 15 points or more per game.  Of the top ten scorers in the league, 6 are among the top 10 effective shooters with James Harden only slightly behind at 54.8%. The remaining 3 are Cousins (53.0%), Lillard (52.2%), and Westbrook, the only one below the league average of 52.1% at 47.4%.

Table: Top Ten Effective Shooters in the League

table

*Note: Bolded players denote those in the top 10 in Points per Game

Ten Predictions for 2018

In my recap of 2017 predictions I pointed out how boring my stock predictions have been with Tesla and Facebook on my list every year since 2013 and Amazon on for two of the past three years. But what I learned on Wall Street is that sticking with companies that have strong competitive advantages in a potentially mega-sized market can create great performance over time (assuming one is correct)! So here we go again, because as stated in my January 5 post, I am again including Tesla, Facebook and Amazon in my Top ten list for 2018. I believe they each continue to offer strong upside, as explained below. I’m also adding a younger company, with a modest market cap, thus more potential upside coupled with more risk. The company is Stitch Fix, an early leader in providing women with the ability to shop for fashion-forward clothes at home. My belief in the four companies is backed up by my having an equity position in each of them.

I’m expecting the four stocks to outperform the market. So, in a steeply declining market, out-performance might occur with the stock itself being down (but less than the market). Having mentioned the possibility of a down market, I’m predicting the market will rise this year. This is a bit scary for me, as predicting the market as a whole is not my specialty.

We’ll start with the stock picks (with January 2 opening prices of stocks shown in parenthesis) and then move on to the remainder of my 10 predictions.

1. Tesla stock appreciation will continue to outpace the market (it opened the year at $312/share).

The good news and bad news on Tesla is the delays in production of the Model 3. The good part is that we can still look forward to massive increases in the number of cars the company sells once Tesla gets production ramping (I estimate the Model 3 backlog is well in excess of 500,000 units going into 2018 and demand appears to be growing). In 2017, Tesla shipped between 80,000 and 100,000 vehicles with revenue up 30% in Q3 without help from the model 3. If the company is successful at ramping capacity (and acquiring needed parts), it expects to reach a production rate of 5,000 cars per week by the end of Q1 and 10,000 by the end of the year. That could mean that the number of units produced in Q4 2018 will be more than four times that sold in Q4 2017 (with revenue about 2.0-2.5x due to the Model 3 being a lower priced car). Additionally, while it is modest compared to revenue from selling autos, the company appears to be the leader in battery production. It recently announced the largest battery deal ever, a $50 million contract (now completed on time) to supply what is essentially a massive backup battery complex for energy to Southern Australia. While this type of project is unlikely to be a major portion of revenue in the near term, it can add to Tesla’s growth rate and profitability.

2. Facebook stock appreciation will continue to outpace the market (it opened the year at $182/share).

The core Facebook user base growth has slowed considerably but Facebook has a product portfolio that includes Instagram, WhatsApp and Oculus. This gives Facebook multiple opportunities for revenue growth: Improve the revenue per DAU (daily active user) on Facebook itself; increase efforts to monetize Instagram and WhatsApp in more meaningful ways; and build the install base of Oculus. Facebook advertising rates have been increasing steadily as more mainstream companies shift budget from traditional advertising to Facebook, especially in view of declining TV viewership coupled with increased use of DVRs (allowing viewers to skip ads). Higher advertising rates, combined with modest growth in DAUs, should lead to continued strong revenue growth. And while the Oculus product did not get out of the gate as fast as expected, it began picking up steam in Q3 2017 after Facebook reduced prices. At 210,000 units for the quarter it may have contributed up to 5% of Q3 revenue. The wild card here is if a “killer app” (a software application that becomes a must have) launches that is only available on the Oculus, sales of Oculus could jump substantially in a short time.

3. Amazon stock appreciation will outpace the market (it opened the year at $1188/share).

Amazon, remarkably, increased its revenue growth rate in 2017 as compared to 2016. This is unusual for companies of this size. In 2018, we expect online to continue to pick up share in retail and Amazon to gain more share of online. The acquisition of Whole Foods will add approximately $4B per quarter in revenue, boosting year/year revenue growth of Amazon an additional 9%-11% per quarter, if Whole Foods revenue remains flattish. If Amazon achieves organic growth of 25% (in Q3 it was 29% so that would be a drop) in 2018, this would put the 3 quarters starting in Q4 2017 at about 35% growth. While we do expect Amazon to boost Whole Foods revenue, that is not required to reach those levels. In Q4 2018, reported revenue will return to organic growth levels. The Amazon story also features two other important growth drivers. First, I expect the Echo to have another substantial growth year and continue to emerge as a new platform in the home. Additionally, Amazon appears poised to benefit from continued business migration to the cloud coupled with increased market share and higher average revenue per cloud customer. This will be driven by modest price increases and introduction of more services as part of its cloud offering. The success of the Amazon Echo with industry leading voice technology should continue to provide another boost to Amazon’s revenue. Additionally, having a large footprint of physical stores will allow Amazon to increase distribution of many products.

4. Stitch Fix stock appreciation will outpace the market (it opened the year at $25/share and is at the same level as I write this post).

Stitch Fix is my riskiest stock forecast. As a new public company, it has yet to establish a track record of performance that one can depend upon. On the other hand, it’s the early leader in a massive market that will increasingly move online, at-home shopping for fashion forward clothes. The number of people who prefer shopping at home to going to a physical store is on the increase. The type of goods they wish to buy expands every year. Now, clothing is becoming a new category on the rapid rise (it grew from 11% of overall clothing retail sales in 2011 to 19% in 2016). It is important for women buying this way to feel that the provider understands what they want and facilitates making it easy to obtain clothes they prefer. Stitch Fix uses substantial data analysis to personalize each box it sends a customer. The woman can try them on, keep (and pay for) those they like, and return the rest very easily.

5. The stock market will rise in 2018 (the S&P opened the year at 2,696 on January 2).

While I have been accurate on recommending individual stocks over a long period, I rarely believe that I understand what will happen to the overall market. Two prior exceptions were after 9/11 and after the 2008 mortgage crisis generated meltdown. I was correct both times but those seemed like easy calls. So, it is with great trepidation that I’m including this prediction as it is based on logic and I know the market does not always follow logic! To put it simply, the new tax bill is quite favorable to corporations and therefore should boost after-tax earnings. What larger corporations pay is often a blend of taxes on U.S. earnings and those on earnings in various countries outside the U.S. There can be numerous other factors as well. Companies like Microsoft have lower blended tax rates because much of R&D and corporate overhead is in the United States and several of its key products are sold out of a subsidiary in a low tax location, thereby lowering the portion of pre-tax earnings here. This and other factors (like tax benefits in fiscal 2017 from previous phone business losses) led to blended tax rates in fiscal 2015, 2016 and 2017 of 34%, 15% and 8%, respectively. Walmart, on the other hand, generated over 75% of its pre-tax earnings in the United States over the past three fiscal years, so their blended rate was over 30% in each of those years

Table 1: Walmart Blended Tax Rates 2015-2017

The degree to which any specific company’s pre-tax earnings mix changes between the United States and other countries is unpredictable to me, so I’m providing a table showing the impact on after-tax earnings growth for theoretical companies instead. Table 2 shows the impact of lowering the U.S. corporate from 35% to 21% on four example companies. To provide context, I show two companies growing pre-tax earnings by 10% and two companies by 30%. If blended tax rates didn’t change, EPS would grow by the same amount as pre-tax earnings. For Companies 1 and 3, Table 2 shows what the increase in earnings would be if their blended 2017 tax rate was 35% and 2018 shifts to 21%. For companies 2 and 4, Table 2 shows what the increase in earnings would be if the 2017 rate was 30% (Walmart’s blended rate the past three years) and the 2018 blended rate is 20%.

Table 2: Impact on After-Tax Earnings Growth

As you can see, companies that have the majority of 2018 pre-tax earnings subject to the full U.S. tax rate could experience EPS growth 15%-30% above their pre-tax earnings growth. On the other hand, if a company has a minimal amount of earnings in the U.S. (like the 5% of earnings Microsoft had in fiscal 2017), the benefit will be minimal. Whatever benefits do accrue will also boost cash, leading to potential investments that could help future earnings.  If companies that have maximum benefits from this have no decline in their P/E ratio, this would mean a substantial increase in their share price, thus the forecast of an up market. But as I learned on Wall Street, it’s important to sight risk. The biggest risks to this forecast are the expected rise in interest rates this year (which usually is negative for the market) and the fact that the market is already at all-time highs.

6. Battles between the federal government and states will continue over marijuana use but the cannabis industry will emerge as one to invest in.

The battle over legalization of Marijuana reached a turning point in 2017 as polls showed that over 60% of Americans now favor full legalization (as compared to 12% in 1969). Prior to 2000, only three states (California, Oregon and Maine) had made medical cannabis legal. Now 29 states have made it legal for medical use and six have legalized sale for recreational use. Given the swing in voter sentiment (and a need for additional sources of tax revenue), more states are moving towards legalization for recreational and medical purposes. This has put the “legal” marijuana industry on a torrid growth curve. In Colorado, one of the first states to broadly legalize use, revenue is over $1 billion per year and overall 2017 industry revenue is estimated at nearly $8 billion, up 20% year/year. Given expected legalization by more states and the ability to market product openly once it is legal, New Frontier Data predicts that industry revenue will more than triple by 2025. The industry is making a strong case that medical use has compelling results for a wide variety of illnesses and high margin, medical use is forecast to generate over 50% of the 2025 revenue. Given this backdrop, public cannabis companies have had very strong performance. Despite this, in 2016, VCs only invested about $49 million in the sector. We expect that number to escalate dramatically in 2017 through 2019. While public cannabis stocks are trading at nosebleed valuations, they could have continued strong performance as market share consolidates and more states (and Canada) head towards legalization. One caveat to this is that Federal law still makes marijuana use illegal and the Trump administration is adopting a more aggressive policy towards pursuing producers, even in states that have made use legal. The states that have legalized marijuana use are gearing up to battle the federal government.

7. At least one city will announce a new approach to Urban transport

Traffic congestion in cities continues to worsen. Our post on December 14, 2017 discussed a new approach to urban transportation, utilizing small footprint automated cars (one to two passengers, no trunk, no driver) in a dedicated corridor. This appears much more cost effective than a Rapid Bus Transit solution and far more affordable than new subway lines. As discussed in that post, Uber and other ride services increase traffic and don’t appear to be a solution. The thought that automating these vehicles will relieve pressure is overly optimistic. I expect at least one city to commit to testing the method discussed in the December post before the end of this year – it is unlikely to be a U.S. city. The approach outlined in that post is one of several that is likely to be tried over the coming years as new thinking is clearly needed to prevent the traffic congestion that makes cities less livable.

8. Offline retailers will increase the velocity of moving towards omnichannel.

Retailers will adopt more of a multi-pronged approach to increasing their participation in e-commerce. I expect this to include:

  • An increased pace of acquisition of e-commerce companies, technologies and brands with Walmart leading the way. Walmart and others need to participate more heavily in online as their core offline business continues to lose share to online. In 2017, Walmart made several large acquisitions and has emerged as the leader among large retailers in moving online. This, in turn, has helped its stock performance. After a stellar 12 months in which the stock was up over 40%, it finally exceeded its January 2015 high of $89 per share (it reached $101/share as we are finalizing the post). I expect Walmart and others in physical retail to make acquisitions that are meaningful in 2018 so as to speed up the transformation of their businesses to an omnichannel approach.
  • Collaborating to introduce more online/technology into their physical stores (which Amazon is likely to do in Whole Foods stores). This can take the form of screens in the stores to order online (a la William Sonoma), having online purchases shipped to your local store (already done by Nordstrom) and adding substantial ability to use technology to create personalized items right at the store, which would subsequently be produced and shipped by a partner.

9. Social commerce will begin to emerge as a new category.

Many e-commerce sites have added elements of social, and many social sites have begun trying to sell various products. But few of these have a fully integrated social approach to e-commerce. The elements of a social approach to e-commerce include:

  • A feed-based user experience
  • Friends’ actions impact your feed
  • Following trend setters to see what they are buying, wearing, and favoring
  • Notifications based on your likes and tastes
  • One click to buy
  • Following particular stores and/or friends

I expect to see existing e-commerce players adding more elements of social, existing social players improving their approach to commerce and a rising trend of emerging companies focused on fully integrated social commerce.

10. “The Empire Strikes Back”: automobile manufacturers will begin to take steps to reclaim use of its GPS.

It is almost shameful that automobile manufacturers, other than Tesla, have lost substantial usage of their onboard GPS systems as many people use their cell phones or a small device to run Google, Waze (owned by Google) or Garmin instead of the larger screen in their car. In the hundreds of times I’ve taken an Uber or Lyft, I’ve never seen the driver use their car’s system. To modernize their existing systems, manufacturers may need to license software from a third party. Several companies are offering next generation products that claim to replicate the optimization offered by Waze but also add new features that go beyond it like offering to order coffee and other items to enable the driver to stop at a nearby location and have the product prepaid and waiting for them. In addition to adding value to the user, this also leads to a lead-gen revenue opportunity. In 2018, I expect one or more auto manufacturers to commit to including a third-party product in one or more of their models.

Soundbytes

Tesla model 3 sample car generates huge buzz at Stanford Mall in Menlo Park California. This past weekend my wife and I experienced something we had not seen before – a substantial line of people waiting to check out a car, one of the first Model 3 cars seen live. We were walking through the Stanford Mall where Tesla has a “Guide Store” and came upon a line of about 60 people willing to wait a few hours to get to check out one of the two Model 3’s available for perusal in California (the other was in L.A.). An hour later we came back, and the line had grown to 80 people. To be clear, the car was not available for a test drive, only for seeing it, sitting in it, finding out more info, etc. Given the buzz involved, it seems to me that as other locations are given Model 3 cars to look at, the number of people ordering a Model 3 each week might increase faster than Tesla’s capacity to fulfill.

Re-cap of 2017 Top Ten Predictions

I started 2017 by saying:

When I was on Wall Street I became very boring by having the same three strong buy recommendations for many years…  until I downgraded Compaq in 1998 (it was about 30X the original price at that point). The other two, Microsoft and Dell, remained strong recommendations until I left Wall Street in 2000. At the time, they were each well over 100X the price of my original recommendation. I mention this because my favorite stocks for this blog include Facebook and Tesla for the 4th year in a row. They are both over 5X what I paid for them in 2013 ($23 and $45, respectively) and I continue to own both. Will they get to 100X or more? This is not likely, as companies like them have had much higher valuations when going public compared with Microsoft or Dell, but I believe they continue to offer strong upside, as explained below.

Be advised that my top ten for 2018 will continue to include all three picks from 2017. I’m quite pleased that I continue to be fortunate, as the three were up an average of 53% in 2017. Furthermore, each of my top ten forecasts proved pretty accurate, as well!

I’ve listed in bold the 2017 stock picks and trend forecasts below, and give a personal evaluation of how I fared on each. For context, the S&P was up 19% and the Nasdaq 28% in 2017.

  1. Tesla stock appreciation will continue to outpace the market. Tesla, once again, posted very strong performance.  While the Model 3 experienced considerable delays, backorders for it continued to climb as ratings were very strong. As of mid-August, Tesla was adding a net of 1,800 orders per day and I believe it probably closed the year at over a 500,000-unit backlog. So, while the stock tailed off a bit from its high ($385 in September), it was up 45% from January 3, 2017 to January 2, 2018 and ended the year at 7 times the original price I paid in 2013 when I started recommending it. Its competitors are working hard to catch up, but they are still trailing by quite a bit.
  2. Facebook stock appreciation will continue to outpace the market. Facebook stock appreciated 57% year/year and opened on January 2, 2018 at $182 (nearly 8 times my original price paid in 2013 when I started recommending it). This was on the heels of 47% revenue growth (through 3 quarters) and even higher earnings growth.
  3. Amazon stock appreciation will outpace the market. Amazon stock appreciated 57% in 2017 and opened on January 2, 2018 at $1,188 per share. It had been on my recommended list in 2015 when it appreciated 137%. Taking it off in 2016 was based on Amazon’s stock price getting a bit ahead of itself (and revenue did catch up that year growing 25% while the stock was only up about 12%). In 2017, the company increased its growth rate (even before the acquisition of Whole Foods) and appeared to consolidate its ability to dominate online retail.
  4. Both online and offline retailers will increasingly use an omnichannel approach. Traditional retailers started accelerating the pace at which they attempted to blend online and offline in 2017. Walmart led, finally realizing it had to step up its game to compete with Amazon. While its biggest acquisition was Jet.com for over $3 billion, it also acquired Bonobos, Modcloth.com, Moosejaw, Shoebuy.com and Hayneedle.com, creating a portfolio of online brands that could also be sold offline. Target focused on becoming a leader in one-day delivery by acquiring Shipt and Grand Junction, two leaders in home delivery. While I had not predicted anything as large as a Whole Foods acquisition for Amazon, I did forecast that they would increase their footprint of physical locations (see October 2016 Soundbytes). The strategy for online brands to open “Guide” brick and mortar stores ( e.g. Tesla, Warby Parker, Everlane, etc.) continued at a rapid pace.
  5. A giant piloted robot will be demo’d as the next form of entertainment. As expected, Azure portfolio company, Megabots, delivered on this forecast by staging an international fight with a giant robot from Japan. The fight was not live as the robots are still “temperamental” (meaning they occasionally stop working during combat). However, interest in this new form of entertainment was incredible as the video of the fight garnered over 5 million views (which is in the range of an average prime-time TV show). There is still a large amount of work to be done to convert this to an ongoing form of entertainment, but all the ingredients are there.
  6. Virtual and Augmented reality products will escalate. Sales of VR/AR headsets appear to have well exceeded 10 million units for the year with some market gain for higher-end products. The types of applications have expanded from gaming to room design (and viewing), travel, inventory management, education, healthcare, entertainment and more. While the actual growth in unit sales fell short of what many expected, it still was substantial. With Apple’s acquisition of Vrvana (augmented reality headset maker) it seems clear that Apple plans to launch multiple products in the category over the next 2-3 years, and with Facebook’s launch of ArKIT, it’s social AR development platform, there is clearly a lot of focus and growth ahead.
  7. Magic Leap will disappoint in 2017. Magic Leap, after 5 years of development and $1.5 billion of investment, did not launch a product in 2017. But, in late December they announced that their first product will launch in 2018. Once again, the company has made strong claims for what its product will do, and some have said early adopters (at a very hefty price likely to be in the $1,500 range) are said to be like those who bought the first iPod. So, while it disappointed in 2017, it is difficult to tell whether or not this will eventually be a winning company as it’s hard to separate hype from reality.
  8. Cable companies will see a slide in adoption. According to eMarketer, “cord cutting”, i.e. getting rid of cable, reached record proportions in 2017, well exceeding their prior forecast. Just as worrisome to providers, the average time watching TV dropped as well, implying decreased dependence on traditional consumption. Given the increase now evident in cord cutting, UBS (as I did a year ago) is now forecasting substantial acceleration of the decline in subscribers. While the number of subscribers bounced around a bit between 2011 and 2015, when all was said and done, the aggregate drop in that four-year period was less than 0.02%. UBS now forecasts that between the end of 2016 and the end of 2018 the drop will be 7.3%. The more the industry tries to offset the drop by price increases, the more they will accelerate the pace of cord cutting.
  9. Spotify will either postpone its IPO or have a disappointing one. When we made this forecast, Spotify was expected to go public in Q2 2017. Spotify postponed its IPO into 2018 while working on new contracts with the major music labels to try to improve its business model. It was successful in these negotiations in that the labels all agreed to new terms. Since the terms were not announced, we’ll need to see financials for Q1 2018 to better understand the magnitude of improvement. In the first half of the year, Spotify reported that gross margins improved from 16% to 22%, but this merely cut its loss level rather than move the company to profitability. It has stated that it expects to do a non-traditional IPO (a direct listing without using an investment bank) in the first half of 2018. If the valuation approaches its last private round, I would caution investors to stay away, as that valuation, coupled with 22% gross margins (and over 12% of revenue in sales and marketing cost to acquire customers), implies net margin in the mid-single digits at best (assuming they can reduce R&D and G&A as a percent of revenue). This becomes much more challenging in the face of a $1.6 billion lawsuit filed against it for illegally offering songs without compensating the music publisher. Even if they managed to successfully fight the lawsuit and improve margin, Spotify would be valued at close to 100 times “potential earnings” and these earnings may not even materialize.
  10. Amazon’s Echo will gain considerable traction in 2017. Sales of the Echo exploded in 2017 with Amazon announcing that it “sold 10s of millions of Alexa-enabled devices” exceeding our aggressive forecast of 2-3x the 4.4 million units sold in 2016. The Alexa app was also the top app for both Android and iOS phones. It clearly has carved out a niche as a new major platform.

Stay tuned for my top 10 predictions of 2018!


SoundBytes

  • In our December 20, 2017 post, I discussed just how much Steph Curry improves teammate performance and how effective a shooter he is. I also mentioned that Russell Westbrook leading the league in scoring in the prior season might have been detrimental to his team as his shooting percentage falls well below the league average. Now, in his first game returning to the lineup, Curry had an effective shooting percentage that exceeded 100% while scoring 38 points (this means scoring more than 2 points for every shot taken). It would be interesting to know if Curry is the first player ever to score over 35 points with an effective shooting percentage above 100%! Also, as of now, the Warriors are scoring over 15 points more per game this season with Curry in the lineup than they did for the 11 games he was out (which directly ties to the 7.4% improvement in field goal percentage that his teammates achieve when playing with Curry as discussed in the post).

Top 10 Predictions for 2017

Conceptualization of giant robot fight.

When I was on Wall Street I became very boring by having the same three strong buy recommendations for many years until I downgraded Compaq in 1998 (it was about 30X the original price at that point). The other two, Microsoft and Dell, remained strong recommendations until I left in 2000. At the time, they were each well over 100X the price of my original recommendation. I mention this because my favorite stocks for this blog include Facebook and Tesla for the 4th year in a row. They are both over 5X what I paid for them in 2013 (23 and 45, respectively) and I continue to own both. Will they get to 100X or more? This is not likely, as companies like them have had much higher valuations when going public compared with Microsoft or Dell, but I believe they continue to offer strong upside, as explained below.

In each of my stock picks, I’m expecting the stocks to outperform the market. I don’t have a forecast of how the market will perform, so in a steeply declining market, out-performance might occur with the stock itself being down (but less than the market). Given the recent rise in the market subsequent to the election of Donald Trump, on top of several years of a substantial bull market, this risk is real. While I have had solid success at predicting certain individual stocks’ performance, I do not pride myself in being able to predict the market itself. So, consider yourself forewarned regarding potential market volatility.

This top ten is unusual in having three picks that are negative forecasts as last year there were no negatives and in 2015 only one.

We’ll start with the stock picks (with prices of stocks valid as of writing this post, January 10, all higher than the beginning of the year) and then move on to the remainder of my 10 predictions.

  1. Tesla stock appreciation will continue to outpace the market (it is currently at $229/share). Tesla expected to ship 50,000 vehicles in the second half of 2016 and Q3 revenue came in at $2.3 billion. This equates to 100,000 vehicles and a $9.2 billion annualized run rate. The model 3 has over 400,000 units on back order and Tesla is ramping capacity to produce 500,000 vehicles in total in 2018. If the company stays on track, from a production point of view, this amounts to 5X the vehicle unit sales rate and about 3X the revenue run rate. While the model 3 is unlikely to have the same gross margins as the current products, tripling revenue should still lead to substantially more than tripling profits. Tesla remains the clear leader in electric vehicles and fully integrated automated features in an automobile. While others are looking towards 2020/2021 to deliver automated cars, Tesla is already delivering most of the functionality required. Between now and 2020 Tesla is likely to install numerous improvements and should remain the leader. Tesla also continues to have the strongest business model as it sells directly to the consumer, eliminating dealers. I also believe that the Solar City acquisition will prove more favorable than anticipated. Given these factors, I expect Tesla stock to have solid outperformance in 2017. The biggest risk is product delay and/or delivering a faulty product, but competitors are trailing by quite a bit so there is some headroom if this happens.

2. Facebook stock appreciation will continue to outpace the market (it is currently at $123/share). While the core Facebook user base growth has slowed considerably, Facebook has a product portfolio that also includes Instagram, WhatsApp and Oculus. This gives Facebook multiple opportunities for revenue growth: Improve the revenue per DAU (daily active user) on Facebook itself; begin to monetize Instagram and WhatsApp in more meaningful ways; and build the install base of Oculus. We have seen Facebook advertising rates increase steadily as more and more mainstream companies shift budget from traditional advertising to Facebook. This, combined with modest growth in DAUs, should lead to continued strong revenue growth from the Facebook platform itself. The opportunity to increase monetization on its other platforms should become more real during 2017, providing Facebook with additional revenue streams. And while the Oculus did not get out of the gate as fast as expected, it is still viewed as the premier product in VR. We believe the company will need to produce a lower priced version to drive sales into the millions of units annually. The wild card here is the “killer app”; if a product becomes a must have and is only available on the Oculus, sales would jump substantially in a short time.

3. Amazon stock appreciation will outpace the market (it is currently at $795/share). I had Amazon as a recommended stock in 2015 but omitted it in 2016 after the stock appreciated 137% in 2015 while revenue grew less than 20%. That meant my 2015 recommendation worked extremely well. But while I still believed in Amazon fundamentals at the beginning of 2016, I felt the stock might have reached a level that needed to be absorbed for a year or so. In fact, 2016 Amazon fundamentals continued to be quite strong with revenue growth accelerating to 26% (to get to this number, I assumed it would have its usual seasonally strong Q4). At the same time, the stock was only up 10% for the year. While it has already appreciated a bit since year end, it seems to be more fairly valued than a year ago, and I am putting it back on our recommended list as we expect it to continue to gain share in retail, have continued success with its cloud offering (strong growth and increased margin), leverage their best in class AI and voice recognition with Echo (see pick 10), and add more physical outlets that drive increased adoption.

4. Both Online and Offline Retailers will increasingly use an Omnichannel Approach. The line between online and offline retailers will become blurred over the next five years. But despite the continued increase in online’s share of the total, physical stores will be the majority of sales for many years. This means that many online retailers will decide to have some form of physical outlets. The most common will be “guide stores” like those from Warby Parker, Bonobos and Tesla where samples of product are in the store but the order is still placed online for subsequent delivery. We believe Amazon may begin to create several such physical locations over the next year or two. I expect brick and mortar retailers to up their game online as they struggle to maintain share. But currently, they continue to struggle to optimize their online presence, so much so that Walmart paid what I believe to be an extremely overpriced valuation for Jet to access better technology and skills. Others may follow suit. One retailer that appears to have done a reasonable job online is William Sonoma.

5. A giant piloted robot will be demo’d as the next form of Entertainment. Since the company producing it, MegaBots, is an Azure portfolio company, this is one of my easier predictions, assuming good execution. The robot will be 16 feet high, weigh 20,000 pounds and be able to lift a car in one hand (a link to the proto-type was in my last post). It will be able to shoot a paint ball at a speed that pierces armor. If all goes well, we will also be able to experience the first combat between two such robots in 2017. Actual giant robots as a new form of entertainment will emerge as a new category over the next few years.

6. Virtual and Augmented reality products will escalate. If 2016 was the big launch year for VR (with every major platform launching), 2017 will be the year where these platforms are more broadly evaluated by millions of consumers. The race to supplement them with a plethora of software applications, follow on devices, VR enabled laptops and 360 degree cameras will escalate the number of VR enabled products on the market. For every high-tech, expensive VR technology platform release, there will be a handful of apps that will expand VR’s reach outside of gaming (and into viewing homes, room design, travel, education etc.), allowing anyone with simple VR glasses connected to a smartphone to experience VR in a variety of settings.  For AR, we see 2017 as the year where AR applicability to retail, healthcare, agriculture and manufacturing will start to be tested, and initial use cases will emerge.

7. Magic Leap will disappoint in 2017. Magic Leap has been one of the “aha” stories in technology for the past few years as it promised to build its technology into a pair of glasses that will create virtual objects and blend them with the real world. At the Fortune Brainstorm conference in 2016, I heard CEO Rony Abovitz speak about the technology. I was struck by the fact that there was no demo shown despite the fact that the company had raised about $1.4 billion starting in early 2014 (with a last post-money at $4.5 billion). The problem for this company is that while it may have been conceptually ahead in 2014, others, like Microsoft, now appear further along and it remains unclear when Magic Leap will actually deliver a marketable product.

8. Cable companies will see slide in adoption. Despite many thinking to the contrary, the number of US cable subscribers has barely changed over the past two years, going down from 49.9 million in Q2 2014 to 48.9 million in Q2 2016 (a 2% loss). During the same period, Broadband services subscribers (video on demand for Netflix, Hulu and others) increased about 12% to 57.0 million. Given the extremely high price of cable, more people (especially millennials) are shifting to paying for what they want at considerably less cost so that the rate of erosion of the subscriber base should continue and may even accelerate over the next few years. I expect to see further erosion of traditional TV usage as well, despite the fact that overall media usage per day is rising. The reason for lower TV usage is the shift people are making to consuming media on their smart phones. This shift is much broader than millennials as every age group is increasing their media consumption through their phones.

9. Spotify will either postpone its IPO or have a disappointing one. In theory, valuation of a company should be calculated based on future earnings flows. The problem for evaluating companies that are losing money is that we can only use proxies for such flows and often wind up using them to determine a multiple of revenue that appears appropriate. To do this I first consider gross margin, cost of customer acquisition and operating cost to determine a “theoretic potential operating profit percentage” that a company can reach when it matures. I believe the higher this is, the higher the multiple and similarly the higher the revenue growth rate, the higher the multiple. When I look at Spotify numbers for 2015 (2016 financials won’t be released for several months) it strikes me (and many others) that this is a difficult business to make profitable as gross margins were a thin 16% based on hosting and royalty cost. Sales and marketing (both of which are variable costs that ramp with revenue) was an additional 12.6% leaving only 3.4% before G&A and R&D (which in 2015 were over 13% of revenue). This combination has meant that scaling revenue has not improved earnings. In fact, the 80% increase in revenue over the prior year still led to higher dollars in operating loss (about 9.5% of revenue). Unless the record labels agree to lower royalties substantially (which seems unlikely) its appears that even strong growth would not result in positive operating margins. If I give them the benefit of the doubt and assume they somehow get to 2% positive operating margin, the company’s value ($8 billion post) would still be over 175X this percent of 2015 revenue. If Spotify grew another 50% in 2016, the same calculation would bring the multiple of theoretical 2016 operating margin to about 120X. I believe it will be tough for them to get an IPO valuation as high as their last post if they went public in Q2 of this year as has been rumored.

10. Amazon’s Echo will gain considerable traction in 2017. The Echo is Amazon’s voice-enabled device that has built-in artificial intelligence and voice recognition. It has a variety of functions like controlling smart devices, answering questions, telling jokes, playing music through Sonos and other smart devices and more. Essentially an app for it is called a “skill”. There are now over 3,000 of these apps and this is growing at a rapid rate. In the first 12 months of sales, a consulting firm, Activate, estimated that about 4.4 million were sold. If we assume an average price of about $150, this would amount to over $650 million to Amazon. The chart below shows the adoption curve for five popular devices launched in the past. Year 1 unit sales for each is set at 1.0 and subsequent years show the multiple of year 1 volume that occurred in that year. As can be seen from the chart, the second year ranged from 2x to over 8X the first year’s volume and in the third year every one of them was at least 5 times the first year’s volume. Should the Echo continue to ramp in a similar way to these devices, its unit sales could increase by 2-3X in 2017 placing the device sales at $1.5-2.0 billion. But the device itself is only one part of the equation for Amazon as the Echo also facilitates ordering products, and while skills are free today, some future skills could entail payments with Amazon taking a cut.

graph-image

Re-cap of 2016 Predictions

fridge-image
Samsung FamilyHub Fridge: manage groceries, family scheduling, display photos and play music through a wifi enabled touchscreen

In my post for top 10 predictions for 2016 I noted how lucky I had been for 3 years running as all my picks seemed to work. I pointed out that all winning streaks eventually come to an end. I’m not sure if this constitutes an end to my streak but in my forecasts for 2016 I was wrong with one of the three stock picks (GoPro) and also missed on one of my seven forecasts of industry trends (that the 2016 political spend would reach record levels). My other 2 stock picks and other 6 trend forecasts did prove accurate.

I’ve listed in bold the 2016 stock picks and trend forecasts below and give a personal evaluation of how I fared on each. For context, the S&P was up 7.5% and the Nasdaq 10.0% in 2016.

1. Facebook stock appreciation will continue to outpace the market (it is currently at $97/share). One year later (January 3) Facebook opened at $117.50, a year over year gain of 21.1% from the time of my blog post. While this was short of the 40% gain in 2015, it still easily outpaced the market.

2. Tesla stock appreciation will continue to outpace the market (it is currently at $193/share). One year later, Tesla shares opened at $219.25 (January 3), a 13.5% gain from the time of my blog post. It might have been higher but the acquisition of Solar City created headwinds for the stock as revenue grew well over 100%, gross profit improved and in Q3 (last reported quarter) EBITDA was positive. Still, it outperformed the market.

3. GoPro stock appreciation should outpace the market in 2016 (shares are currently at $10.86). This pick was a clear miss as the stock declined 17.1% from the time of the blog post to January 3. In my defense, I had it partly right as the stock peaked at $17/share at the time of the drone and new camera announcements. In retrospect, given GoPro’s history of poor execution, I would have been smarter to recommend selling at the time these were announced. Instead, I mistakenly viewed execution as pretty easy and failed to suggest this. Since the company, once again, had an execution misstep, I was proven wrong and the stock subsequently declined.

The remaining predictions were about industry trends rather than stocks.

4. UAV/Drones will continue to increase in popularity. Drones continued to increase in popularity at the end of 2015 and into the first half of 2016. According to Market Watch, drone sales were up over 200% in April of 2016 as compared with April of 2015. Starting in December of 2015, the government began requiring drone operators to register on a federal database and by December 2016 had registered over 600,000 drones and users.

5. Political spend will reach record levels in 2016 and have a positive impact on advertising revenue. This forecast proved incorrect. Donald Trump won the presidency despite raising less money than any major party presidential candidate since 2008. Hillary Clinton, raised nearly twice as much as Trump, but still fell short of what President Obama raised in 2012. In the case of President-Elect Trump, more than half of his small raise consisted of $66 million he personally donated to his campaign and $280 million from donors giving $200 or less. Mrs. Clinton, despite depicting Trump as the candidate of the rich, received a substantial portion of her donations from wealthy individuals. The two candidates raising less money meant that the size of the boost in advertising from political ads fell short of my prediction.

6. Virtual/Augmented Reality will have a big year in 2016. As expected, 2016 was the big launch year for VR and AR. Highly anticipated VR product launches (the Facebook Oculus Rift in March, the HTC Vive in April and the PlayStation VR in October) showed strong consumer interest with sales of over 1.5M units. Pokemon Go’s 500M + downloads and the initial release of Microsoft’s Hololense generated intense interest in AR, creating a flurry of application development across a variety of industries including healthcare, agriculture, manufacturing and retail. Unsurprisingly, this excitement is mirrored in VC investment dollars, with a 140% growth in funding over 2015, bringing the total amount invested this past year to $1.8 Bn. This shows a strong trajectory for more development across gaming and commercial applications in AR / VR as we move into 2017.

7. Robotic market will expand to new areas in 2016. From chatbots being introduced by many companies for interacting with customers, to a giant fighting robot (16 foot tall, 20,000 pounds) that can lift and throw a car, to robots for making pizzas, to robots that help educate kids, 2016 was a year of enormous expansion in the robotics market.

8. A new generation of automated functionality will begin to be added to cars. In 2016 autonomous cars moved from concept to closer to reality. To date, the technology leaders appeared to be Tesla and Google, the former building a fully integrated product, the latter a set of components that can be integrated into many different vehicles. Tesla, who appears to be furthest along in putting a fully autonomous car on the road in volume, added more components (software and sensors) to its autonomous technology but suffered a setback when a driver ignored Tesla requirements to “supervise” the autonomous driving and suffered a fatal accident. Autonomous cars took many steps forward in 2016 as additional companies entered the fray. Uber, a company that has much to gain from driverless cars (like eliminating the need for its over 1 million drivers), began an experiment in Pittsburg to offer driverless cars (supervised by an actual person in the driver’s seat) as part of its service. These cars are being manufactured in a partnership with Volvo using technology created by Carnegie Robotics (who’s founder was one of the creators of the Google technology). Uber also acquired Otto, a startup focused on driverless trucks, to gain further technology. In August, Ford announced its intent to bring an autonomous car to market by 2021. Audi just announced a partnership with Nvidia to bring an autonomous car to the road by 2020-21. Toyota, Chrysler and others have also announced intent to create such a vehicle. While I believe that the actual mass usage of driverless cars will be further out then 2021, we seem to be close to a breakout of “supervised automated vehicles”.

9. The Internet of Things will expand further into kitchen appliances and will start being adopted by the average consumer. In the past 12 months Samsung, LG, GE and others have launched numerous smart refrigerators. These can now be thought of as devices that can connect to a smart phone through an app. The user can receive alerts like ‘a water filter needs replacing’ or ‘the door was left open’. Some have digital bulletin boards on the fridges, other features can let you know when various items stored in the fridge are running low, and still more features can be deployed to control functionality (change temperature, etc). The adoption of these devices has reached sufficient levels for them to be carried in mainstream stores like Best Buy.

10. Amazon will move to profitability on their book subscription service and improve cloud capex. Amazon did indeed make three major shifts in its book subscription strategy. First, it significantly reduced payouts to publishers for their books that were downloaded; second, it reduced the proportion of third party published books offered to subscribers to the service and third it reduced the amount it pays their own authors. While Amazon does not report these numbers, I believe this combination has reduced the cost to Amazon by over 50% and has made the service profitable. The gross margin before stock based compensation for Amazon’s cloud service increased year over year in Q3 (last reported quarter) from 27.1% in 2015 to 31.6% in 2016.


While it wasn’t in my Top 10 post for 2016, I did predict that Kevin Durant would sign with the Warriors as he would fit right in and improve his chances of winning championships. He has signed, seems to fit in well, but we’ll have to wait to see if the championships follow.

I’ll be making my 2017 picks within the next week.

Top 10 Predictions for 2016

In my forecast of 2015 trends I wrote:

 “I’ve been very lucky to have a history of correctly predicting trends, especially in identifying stocks that would outperform. I say lucky because even assuming one gets the analysis right, the prediction can still be wrong due to poor management execution and/or unforeseen events. Last year I highlighted 10 trends that would occur in 2014 and I’m pleased that each proved accurate (see 2014 Predictions). Rather than pat myself on the back for past performance, my high-risk, A-type personality makes me go back into the fray for 2015. Last year’s highlighted stocks, Tesla and Facebook, were up 48% and 43%, respectively, from January 3 to December 31, 2014 vs. 15% for the Nasdaq and under 13% for the S&P 500. This year, I’ll identify more than two stocks to watch as I am probably over-confident due to past success. But because I’m not doing the level of work that I did on Wall Street, there is significant risk in assuming I’m correct.”

As I discussed in the last post I got even luckier in 2015 as my highlighted four stocks had average appreciation of 86% while the broader market was nearly flat. As we saw with the Golden State Warriors on December 12th, all winning streaks have to come to an end so bearing that in mind, I wanted to start with a more general discussion of 5 stocks and why I chose to highlight three and back off of two others (despite still liking their stories). The two stocks that I recommended last year that I’m not putting on the list again are Netflix and Amazon. The rationale is quite simple: neither is at the same compelling price that it was a year ago. Netflix stock, as of today, is up over 100% year/year while its revenue increase is under 25% and profit margins shrank. This means that the price-to-revenue and price-to-earnings multiple of its stock is about twice what it was a year ago. So, while I continue to like the long term fundamentals, the value that was there a year ago is not there today. Amazon is a similar story. Its stock is currently up over 100% year-over-year but revenue and profit growth for 2015 was likely around 20%. Again, I continue to believe in the long term story, but at this share price, it will need to grow 20% per year for three more years for the stock value to be what it was a year ago.

My two other highlighted stocks from last year are Facebook and Tesla. At today’s prices they are each at a lower price-to-revenue multiple than a year ago (that is, their stocks appreciated at a slower pace than revenue growth). But, in both cases, the fundamentals remain strong for another solid growth year (more below on these) and I would expect each to outpace the market. I’ll discuss my final (riskiest) stock pick below.

In each of my stock picks, I’m expecting the stocks to outperform the market. I don’t have a forecast of how the market will perform so in a steeply declining market, out performance might occur with the stock itself being down (but less than the market). So consider yourself forewarned on a number of accounts.

We’ll start with the three stock picks and then move on to the remainder of my 10 predictions.

  1. Facebook stock appreciation will continue to outpace the market (it is currently at $97/share). Most of the commerce companies in the Azure portfolio continue to find Facebook the most compelling place to advertise. Now many of the very large brands are moving more budget to Facebook as well. This shift to online and mobile marketing still has a long way to go and we expect Facebook revenue growth to remain very strong. In addition, Facebook has begun to ramp the monetization of other properties, particularly Instagram. If we start to see real momentum in monetization of Instagram, the market will likely react very positively as it exposes another growth engine. Finally, with the Oculus release early this year, we may see evidence that Facebook will become the early leader in the emerging virtual reality space (which was one of the hits at CES this year).
  1. Tesla stock appreciation will continue to outpace the market (it is currently at $193/share). Last year Tesla grew revenues an estimated 30%+ but order growth far exceeded that as the company remains supply constrained. The good news is that revenue growth in 2016 should continue at a very high level (perhaps higher than 30% year-over-year) and the stock’s price-to-revenue multiple is lower than a year ago. The new Model X has a very significant backlog (I’ve seen estimates as high as 25,000-30,000 vehicles). Since this would be incremental to Model S sales, growth could accelerate once capacity ramps. Additionally, both service revenue and sales of used Teslas are increasing as well. When this is added to distribution expansion, Tesla appears to have 2-3 years of solid revenue growth locked in. I’m not sure when the low priced vehicle will be announced (it is supposed to be in 2017) but a more modest price point for one of its models could increase demand exponentially.
  1. GoPro stock appreciation should outpace the market in 2016 (shares are currently at $10.86). On the surface this may appear my riskiest prediction but there are solid reasons for my thoughts here. I believe investors are mistakenly comparing GoPro to a number of tech high fliers that collapsed due to valuations based on “air”. GoPro is far from that. In fact, I believe it is now a “value” play. To begin, unlike many tech high fliers, GoPro is profitable and generates positive cash flow. Its current book value is over $6 per share (of which $3.73 is cash with no debt). It is trading at less than 1x revenue and about 15x 2016 earnings estimates. Despite the announced shortfall expected in q4 and a number of downward revisions, revenue should still be up about 15% in 2015. While the current version of its camera has failed to meet expectations (and competition is increasing), the brand is still the leader in its space (action video). If new camera offerings advance the technology, this could help GoPro resume growth in the video arena. The brand can also be used to create leverage in new arenas. The three that the company has targeted are: content, drones and virtual reality. Of the three, I would significantly discount their ability to create a large content revenue stream and believe virtual reality products may prove difficult (and even if successful, will take multiple years to be meaningful). However, the company is very well positioned to earn a reasonable share in the UAV/drone market (which was about $1.5B last year and could grow 50-100% in 2016). The primary use of drones today is for photography and video and the majority of the ones we saw at CES were outfitted with a GoPro camera. Given the GoPro brand and distribution around action video, I believe that, if they are able to launch a credible product by mid-year, the company will be well positioned to experience reasonable growth in H2 2016 and the shares should react well.

The remaining predictions revolve around industry trends rather than stocks:

  1. UAV/Drones will continue to increase in popularity. In 2015, the worldwide drone market reached about $1.5B and there is no sign of slowing growth. When I think about whether trends will continue, I base my analysis on whether there are valuable use cases. In the case of drones there are innumerable ones. We’ll save the detailed explanation for a full post but I’ll list several here:
    1. Photography: this is a major use case for both consumers and professionals, namely being able to get overhead views of terrain either in photos or in video.
    2. Security: as an offshoot of photography, drones offer the potential of having continuous monitoring of terrain from an aerial view. This enables intrusion detection, monitoring, and tracking.
    3. Delivery: although current drones are not yet able to carry significant payloads, they are close to having the ability to follow a flight path, drop off a small package and then return. As innovations in UAV hardware and battery technology continue, delivery will become more of a reality in the future (which companies like Amazon, Google and others are counting on). This will also require some type of monitoring of airspace for drones to prevent crashes.
    4. Consumer: consumers will purchase drones in droves not only for the simple pleasure of flying them but also for various types of competitions including racing, battling and obstacles.
  1. Political spend will reach record levels in 2016 and have a positive impact on advertising revenue. Political advertising is expected to reach a record $11.4 billion in 2016, up 20% from the previous presidential election year. While the bulk of spending is forecast to go to TV, 2016 will be the first election year in which digital ad spending will exceed $1 billion (and if the candidates are savvy may be even higher). Adding 2015 spending, total political advertising in this election cycle could total $16.5 billion or more. About 50% of the total spending typically goes for the national election and the other half to backing candidates and issues in local races. During the 2015-16 election cycle, $8.5 billion is expected to be spent on broadcast TV, with $5.5 billion coming from national races and $3.1 billion spent on state and local contests. Cable TV is forecast to see $1.5 billion in spending, with $738 million coming from the national contest and $729 million from local races. Online and digital spending is forecast to total $1.1 billion, with $665 million going for national races and $424 million spent on local contests.[1]
  1. Virtual/Augmented Reality will have a big year in 2016: With the general release of Oculus expected in 2016, we will see an emergence of companies developing content and use cases in virtual reality. Expect to see the early beginnings of mainstream adoption of virtual reality applications. In addition, augmented reality products were heavily on display at CES and we think they will begin to ramp as an alternative to virtual reality. Both virtual reality and augmented reality are similar in that they both immerse the user but with AR, users continue to be in touch with the real world while interacting with virtual objects. With VR, the user is isolated from the real world. For now, expect VR to remain focused on entertainment and gaming while AR has broader applications in commercial use (i.e., real estate, architecture, training, education) as well as personal use.
  1. Robotic market will expand to new areas in 2016: Outside of science fiction, robots have made only minimal progress to date in generating interesting products that begin to drive commercial acceptance (outside of carpet cleaning, i.e. the Rumba). This year could mark a change in that. First, carpet cleaning robots will expand to window cleaning, bathtub cleaning and more. Second, robots will be deployed much more generally for commercial applications (like they already are in the Tesla factory). And we will also see much more progress in the consumer entertainment applications highlighted by the emergence of actual giant robots that stage a monumental battle akin to ones previously only created visually in movies.
  2. A new generation of automated functionality will begin to be added to cars. Tesla has led the way for this and already has a fully automated car on the market. Others are now attempting to follow and perhaps even surpass Tesla in functionality. In addition to the automation of driving, the computerization of the automobile has led to the ability to improve other capabilities. One demonstration I saw at CES was from a company called Telenav. They gave a proof of concept demonstration of a next gen GPS. Their demonstration (of a product expected to launch in Q2 or Q3) showed a far more functional GPS with features like giving the driver alternate routes when there are traffic problems regardless of whether route guidance is on as it determined where the driver was going based on tracking driving habits by day of the week. Their system will also help you buy a cup of coffee in route, incorporate messaging with an iPhone (with the drivers voice converted to text on the phone and vice versa) for communicating with someone you’re picking up, helping you find a garage with available spots, etc. all through the normal interface. Telenav is working as an OEM to various auto manufacturers and others like Bosch are doing the same. And, of course, several of the car manufacturers are trying to do this themselves (which we believe will lead to inferior systems).
  3. The Internet of Things will further expand into kitchen appliances and will start being adopted by the average consumer. We’re going to see the launches of smart refrigerators, smart washing machines, ovens, etc. Earlier this month, Samsung released its new Family Hub refrigerator which uses three high quality cameras inside the fridge to manage groceries, identify foods you have or need, and track product expiration dates to cut down on waste. It also has a screen on its door that can interface with other devices (like an iphone) to find and display the current days schedule for each member of the household, keep a shopping list and more.
  4. Amazon will move to profitability on their book subscription service and also improve cloud capex. Amazon launched its book subscription service with rapid customer acquisition in mind. Publishers were incentivized to include their titles as the company would pay the full price for each book downloaded once a portion of it was read. This meant that Amazon was paying out far more money than it was taking in. We believe Amazon has gone back to publishers with a new offering that has a much more Amazon-favored revenue share which results in the service moving from highly unprofitable to profitable overnight. The Amazon cloud has reached a level of maturity where we believe the cash needed for Capex is now a much smaller portion of revenue which in turn should improve Amazon cash flow and profitability.


[1] http://www.broadcastingcable.com/news/currency/political-ad-spending-hit-114b-2016/143445