
This post is part 2 of our valuation discussion (see this post for part 1). As I write this post Tesla’s market cap is about $56 billion. I thought it would be interesting to show how the rules discussed in the first post apply to Tesla, and then to take it a step further for startups.
Revenue and Revenue Growth
Revenue for Tesla in 2017 was $11.8 billion, about 68% higher than 2016, and it is likely to grow faster this year given the over $20 billion in pre-orders (and growing) for the model 3 coupled with continued strong demand for the model S and model X. Since it is unclear when the new sports car or truck will ship, I assume no revenue in those categories. As long as Tesla can increase production at the pace they expect, I estimate 2018 revenue will be up 80% – 120% over 2017, with Q4 year over year growth at or above 120%.
If I’m correct on Tesla revenue growth, its 2018 revenue will exceed $20 billion. So, Rule Number 1 from the prior post indicates that Tesla’s high growth rates should merit a higher “theoretical PE” than the S&P (by at least 4X if one believes that growth will continue at elevated rates).
Calculating TPE
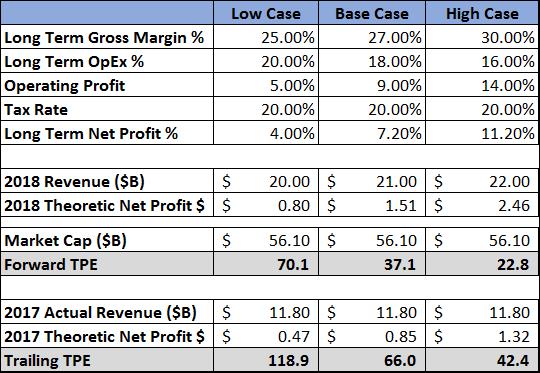
Tesla gross margins have varied a bit while ramping production for each new model, but in the 16 quarters from Q1, 2014 to Q4, 2017 gross margin averaged 23% and was above 25%, 6 of the 16 quarters. Given that Tesla is still a relatively young company it appears likely margins will increase with scale, leading me to believe that long term gross margins are very likely to be above 25%. While it will dip during the early production ramp of the model 3, 25% seems like the lowest percent to use for long term modeling and I expect it to rise to between 27% and 30% with higher production volumes and newer factory technology.
Tesla recognizes substantial cost based on stock-based compensation (which partly occurs due to the steep rise in the stock). Most professional investors ignore artificial expenses like stock-based compensation, as I will for modeling purposes, and refer to the actual cost as net SG&A and net R&D. Given that Tesla does not pay commissions and has increased its sales footprint substantially in advance of the roll-out of the model 3, I believe Net SG&A and Net R&D will each increase at a much slower pace than revenue. If they each rise 20% by Q4 of this year and revenue is at or exceeds $20 billion, this would put their total at below 20% of revenue by Q4. Since they should decline further as a percent of revenue as the company matures, I am assuming 27% gross margin and 18% operating cost as the base case for long term operating profit. While this gross margin level is well above traditional auto manufacturers, it seems in line as Tesla does not have independent dealerships (who buy vehicles at a discount) and does not discount its cars at the end of each model year.
Estimated TPE
Table 1 provides the above as the base case for long term operating profit. To provide perspective on the Tesla opportunity, Table 1 also shows a low-end case (25% GM and 20% operating cost) and a high-end profit case (30% GM and 16% operating cost). Recall, theoretic earnings are derived from applying the mature operating profit level to trailing and to forward revenue. For calculating theoretic earnings, I will ignore interest payments and net tax loss carry forwards as they appear to be a wash over the next 5 years. Finally, to derive the Theoretic Net Earnings Percent a potential mature tax rate needs to be applied. I am using 20% for each model case which gives little credit for tax optimization techniques that could be deployed. That would make theoretic earnings for 2017 and 2018 $0.85 billion and $1.51 billion, respectively and leads to:
- 2017 TPE=$ 56.1 billion/$0.85 = 66.0
- 2018 TPE= $ 56.1 billion/1.51 = 37.1
The S&P trailing P/E is 25.5 and forward P/E is about 19X. Based on our analysis of the correlation between growth and P/E provided in the prior post, Tesla should be trading at a minimum of 4X the trailing S&P ratio (or 102 TP/E) and at least 3.5X S&P forward P/E (or 66.5 TP/E). To me that shows that the current valuation of Tesla does not appear out of market. If the market stays at current P/E levels and Tesla reaches $21B in revenue in 2018 this indicates that there is strong upside for the stock.
Table 1: Tesla TPE 2017 & 2018
The question is whether Tesla can continue to grow revenue at high rates for several years. Currently Tesla has about 2.4% share of the luxury car market giving it ample room to grow that share. At the same time, it is entering the much larger medium-priced market with the launch of the Model 3 and expects to produce vehicles in other categories over the next few years. Worldwide sales of new cars for the auto market is about 90 million in 2017 and growing about 5% a year. Tesla is the leader in several forward trends: electric vehicles, automated vehicles and technology within a car. Plus, it has a superior business model as well. If it reaches $21 billion in revenue in 2018, its share of the worldwide market would be about 0.3%. It appears poised to continue to gain share over the next 3-5 years, especially as it fills out its line of product. Given that it has achieved a 2.4% share of the market it currently plays in, one could speculate that it could get to a similar share in other categories. Even achieving a 1% share of the worldwide market in 5 years would mean about 40% compound growth between 2018 and 2022 and imply a 75X-90X TP/E at the end of this year.
The Bear Case
I would be remiss if I omitted the risks that those negative on the stock point out. Tesla is a very controversial stock for a variety of reasons:
- Gross Margin has been volatile as it adds new production facilities so ‘Bears’ argue that even my 25% low case is optimistic, especially as tax rebate subsidies go away
- It has consistently lost money so some say it will never reach the mature case I have outlined
- As others produce better electric cars Tesla’s market share of electric vehicles will decline so high revenue growth is not sustainable
- Companies like Google have better automated technology that they will license to other manufacturers leading to a leap frog of Tesla
As they say, “beauty is in the eyes of the beholder” and I believe my base case is realistic…but not without risk. In response to the bear case that Tesla revenue growth can’t continue, it is important to recognize that Tesla already has the backlog and order momentum to drive very high growth for the next two years. Past that, growing market share over the 4 subsequent years to 1% (a fraction of their current share of the luxury market) would generate compound annual growth of 40% for that 4-year period. In my opinion, the biggest risk is Tesla’s own execution in ramping production. Bears will also argue that Tesla will never reach the operating margins of my base case for a variety of reasons. This is the weakness of the TPE approach: it depends on assumptions that have yet to be proven. I’m comfortable when my assumptions depend on momentum that is already there, gross margin proof points and likelihood that scale will drive operating margin improvements without any radical change to the business model.
Applying the rules to Startups
As a VC I am often in the position of helping advise companies regarding valuation. This occurs when they are negotiating a round of financing or in an M&A situation. Because the companies are even earlier than Tesla, theoretic earnings are a bit more difficult to establish. Some investors ignore the growth rates of companies and look for comps in the same business. The problem with the comparable approach is that by selecting companies in the same business, the comps are often very slow growth companies that do not merit a high multiple. For example, comparing Tesla to GM or Ford to me seems a bit ludicrous when Tesla’s revenue grew 68% last year and is expected to grow even faster this year while Ford and GM are growing their revenue at rates below 5%. It would be similar if investors compared Apple (in the early days of the iPhone) to Nokia, a company it was obsoleting.
Investors look for proxies to use that best correlate to what future earnings will be and often settle on a multiple of revenue. As Table 2 shows, there is a correlation between valuation as a multiple of revenue and revenue growth regardless of what industry the companies are in. This correlation is closer than one would find by comparing high growth companies to their older industry peers.
Table 2: Multiple of Revenue and Revenue Growth

However, using revenue as the proxy for future earnings suffers from a wide variety of issues. Some companies have 90% or greater gross margins like our portfolio company Education.com, while others have very low gross margins of 10% – 20%, like Spotify. It is very likely that the former will generate much higher earnings as a percent of revenue than the latter. In fact, Education.com is already cash flow positive at a relatively modest revenue level (in the low double-digit millions) while Spotify continues to lose a considerable amount of money at billions of dollars in revenue. Notice, this method also implies that Tesla should be valued about 60% higher than its current market price.
This leads me to believe a better proxy for earnings is gross margin as it is more closely correlated with earnings levels. It also removes the issue of how revenue is recognized and is much easier to analyze than TPE. For example, Uber recognizing gross revenue or net revenue has no impact on gross margin dollars but would radically change its price to revenue. Table 3 uses the same companies as Table 2 but shows their multiple of gross margin dollars relative to revenue growth. Looking at the two graphs, one can see how much more closely this correlates to the valuation of public companies. The correlation coefficient improves from 0.36 for the revenue multiple to 0.62 for the gross margin multiple.
Table 3: Multiple of Gross Margin vs. Revenue Growth

So, when evaluating a round of financing for a pre-profit company the gross margin multiple as it relates to growth should be considered. For example, while there are many other factors to consider, the formula implies that a 40% revenue growth company should have a valuation of about 14X trailing gross margin dollars. Typically, I would expect that an earlier stage company’s mature gross margin percent would likely increase. But they also should receive some discount from this analysis as its risk profile is higher than the public companies shown here.
Notice that the price to sales graph indicates Tesla should be selling at 60% more than its multiple of 5X revenue. On the other hand, our low-end case for Tesla Gross Margin, 25%, puts Tesla at 20X Gross Margin dollars, just slightly undervalued based on where the least square line in Table 3 indicates it should be valued.
