The Top 10 List for 2021

Professional Sports in a Covid World

I wanted to start this post by repeating something I discussed in my top ten lists in 2017, 2018 and 2020 which I learned while at Sanford Bernstein in my Wall Street days: “Owning companies that have strong competitive advantages and a great business model in a potentially mega-sized market can create the largest performance gains over time (assuming one is correct).” It does make my stock predictions somewhat boring (as they were on Wall Street where my top picks, Dell and Microsoft each appreciated over 100X over the ten years I was recommending them).

In the seven years we have been offering stock picks on this blog this strategy has worked quite well as the cumulative gains for my picks now exceeds 21X and the 7-year IRR is 55%. The two stocks that have been on the list every year, Tesla and Facebook, were at the end of 2020 at 77X and 11X, respectively, of the price I bought them in mid-2013. They both have been on our recommended list every year since but this is about to change.

In last year’s Top 10 list I pointed out that my target is to produce long-term returns at or above 26%. At that rate one would double their money every 3 years. Since the S&P has had compound growth of 10.88%/year for the past 7 years, and Soundbytes has been at 55%, I thought you might find it interesting to see how long a double takes at various levels of IRR and what multiple you would have after 10 years for each one.

Table: Compound Returns at Various Rates

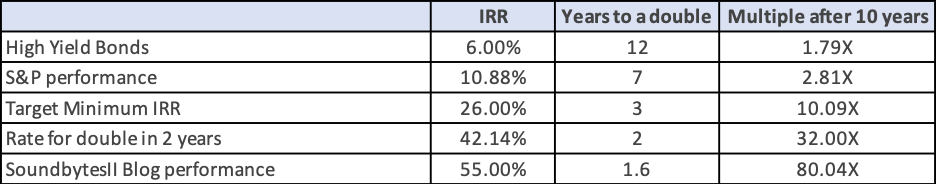
The wonder of compounding is quite apparent in the table, but it also shows that patience is a virtue as holding the stocks of great companies longer can multiply your money significantly over time, while too many investors become inpatient and sell prematurely. In our last post of 2020 we outlined the thinking process to select great companies, but even great companies can have some periods where their returns are below par. Given that our picks were up an average of 259% last year, I’m back to a fearful mode that 2021 might be that period. Of course, I’m always fearful but sticking with great companies has worked out so far and trying to time when to sell and buy back those companies often leads to sub-optimization.

To some extent, over a 5-year period or longer, stock appreciation is correlated with a company’s growth. So, as I go through each of my 6 stock picks, I will discuss what that might mean for each company. With that in mind, as is my tendency (and was stated in my last post), I am continuing to recommend 5 of the 6 stocks from last year: Tesla, Zoom, Amazon, Stitch Fix and DocuSign. I am removing Facebook from the list and adding CrowdStrike. To be clear, I still believe Facebook will outperform the S&P (see Pick 7 below) but I also believe that over the next few years CrowdStrike and the 5 continuing stocks will experience greater appreciation.

2021 Stock Recommendations:

1. Tesla stock appreciation will continue to outperform the market (it closed last year at $706/share)

Tesla is the one stock in the group that is not trading in synch with revenue growth for a variety of reasons. This means it is likely to continue to be an extremely volatile stock, but it has so many positives in front of it that I believe it wise to continue to own it. The upward trend in units and revenue should be strong in 2021 because, in addition to continued high demand for the model 3:

  1. China Expansion: Tesla continues to ramp up production in China, the world’s largest market. In 2020 the company sold about 120,000 cars (which placed it a dominant number 1 in battery powered cars) there as its Giga Factory in Shanghai ramped up production. Trade Group China Passenger Car Association predicts that Tesla will sell as many as 280,000 vehicles there in 2021…an increase of about 133%. While that is significant growth it only would represent 20% of the number of battery powered vehicles forecast to be sold. The limitation appears to be production as the Shanghai factory is just nearing a volume of 5,000 vehicles per week. Tesla believes it can double that during this year. The Model Y has just been introduced in China and early press is calling it a major hit. Together with the Model 3, I believe this positions Tesla to be supply constrained. Should the company increase production earlier in the year, it has the opportunity to sell more than the forecast 280,000 vehicles. What is also important to note, is Tesla seems to be making greater profits on sales of its cars in China than in the U.S so as China becomes a larger portion of the mix Gross Margin could increase.
  • European Factory: Tesla has a cost disadvantage in Europe as its cars are not currently built there. So, while it established an early lead in market share, as others have launched battery powered vehicles at lower prices Tesla lost market share. That should all change when its Berlin Giga Factory begins production in July, 2021. This coupled with the Model Y introduction (it will be built in the Berlin factory) should mean a notable increase in sales as Europe returns to more normal times.
  • Model Y introduction: The Model Y, launched in early 2020 in the U.S., is already selling about 12,000 units a month here. This exceeds sales of crossover vehicles from every major brand (per GCBC which uses VIN reporting to calculate its numbers). It is expected to start being delivered in China in February.
  • Cybertruck: The Cybertruck (see our graphic here) was introduced to extremely mixed reactions. Traditionalists tended to hate it due to its radical departure from what they have come to expect for a pickup truck from companies like Ford, Toyota, etc. But it rang a cord with many and pre-orders are now up to 650,000 units according to Finbold. To give perspective on what this means, it is 30% higher than the total number of vehicles Tesla sold in 2020.  While a portion of these orders could be cancelled as they only required a $100 deposit, the magnitude does imply significant incremental demand when Tesla launches in this category. The launch is expected late this year.
  • Roadster: Tesla has plans to re-introduce a Roadster in 2021. You may recall that the first Tesla’s were sports cars and are now collectors’ cars mostly valued between $50,000 and $70,000 but now the last one built, having about 200 miles on it is up for sale at $1.5 million. This time around it will make it an ultra-premium vehicle in specifications and in price. The base price Tesla has indicated starts at $200,000. A “Founders Series” will be $50,000 higher (with only 1,000 of those available). At those prices, gross margins should be quite high.  The range Tesla initially indicated for this car was 620 miles and the speed from 0 to 60 of 1.9 seconds which would be much quicker than the McLaren 570S gas powered auto.
  • Tesla Semi: of all the vehicle categories that would benefit from being battery powered I believe the Semi is on top. That is because cost of ownership is one of the highest priorities for vehicles used in commerce. And Tesla claims that their semi will offer the lowest cost of ownership due to economic cost of fuel, less maintenance required as it has fewer parts, and easier repairs. According to Green Car Reports Musk has said it will begin being produced in 2021. Even assuming that Elon’s optimism is off, it appears that it could hit the market in early 2022. Once a definite date and specs are public, sales forecasts for Tesla could rise in 2022.

I’ve taken more time than usual to review my thoughts on Tesla as its astounding stock appreciation in 2020 make it vulnerable to stock pullbacks of some magnitude from time to time. But, its potential to achieve meaningful share of overall auto sales as various geographies shift to battery powered vehicles gives it the potential to achieve high growth in revenue for many years to come.  

2. DocuSign stock appreciation will continue to outperform the market (it closed last year at $222/share)

DocuSign is the runaway leader in e-signatures facilitating multiple parties signing documents in a secure, reliable way for board resolutions, mortgages, investment documents, etc. Being the early leader creates a network effect, as hundreds of millions of people are in the DocuSign e-signature database. The company has worked hard to expand its scope of usage for both enterprise and smaller companies by adding software for full life-cycle management of agreements. This includes the process of generating, redlining, and negotiating agreements in a multi-user environment, all under secure conditions. On the small business side, the DocuSign product is called DocuSign Negotiate and is integrated with Salesforce.

DocuSign was another beneficiary of the pandemic as it helped speed the use of eSignature technology. The acceleration boosted revenue growth to 53% YoY in Q3, 2021 (the quarter ended on October 31, 2020) from 39% in Fiscal 2020.  Total customers expanded by 46% to 822,000. At the same time Net Retention (dollars spent by year-ago customers in Q3 FY21 vs dollars spent by the same customers a year earlier) was 122% in the quarter. Non-GAAP gross margin remained at 79% as increased usage per customer (due to the pandemic) had minimal impact on cost. Given DocuSign’s strong Contribution Margin, operating profits increase faster than revenue and were up to $49 million from $17 million in the year ago quarter. What has happened represents an acceleration of the migration to eSignature technology which will be the base for DocuSign going forward. Once a company becomes a customer, they are likely to increase their spend, as evidenced by 122% Net Revenue growth. Finally, competition appeared to weaken as its biggest competitor, Adobe, lost considerable ground. This all led to a sizable stock gain of 200% to $222/share at year end.  In my view, the primary risk is around valuation but at 50% growth this gets mitigated as earnings should grow much faster than revenue. I continue to believe the stock will appreciate faster than the S&P.

3. Stitch Fix Stock appreciation will continue to outperform the market (it closed last year at $58.72/share)

Stitch Fix offers customers, who are primarily women (although its sales in Men’s clothing is rising), the ability to shop from home by sending them a box with several items selected based on sophisticated analysis of their profile and prior purchases. The customer pays a $20 “styling fee” for the box which can be applied towards purchasing anything in the box. The company is the strong leader in the space with revenue at nearly a $2 billion run rate. The stock had a strong finish to 2020 after declining substantially earlier in the year due to Covid negatively impacting performance. This occurred despite gaining market share as people simply weren’t buying a normal amount of clothes at the onset of the pandemic. When revenue growth rebounded in the October quarter to 10% YoY and 7% sequentially the stock gained significant ground and closed the year up 129%.

Stitch Fix continues to add higher-end brands and to increase its reach into men, plus sizes and kids. Its algorithms to personalize each box of clothes it ships keeps improving. It appears to be beyond the worst days of the pandemic and expects revenue growth to return to a more normal 20-25% for fiscal 2021 (ending in July). This is partially due to easy comps in Q3 and Q4 and partly due to clothing purchase behavior improving. The company will also be a beneficiary of a number of closures of retail stores.

Assuming it is a 20-25% growth company that is slightly profitable, it still appears under-valued at roughly 3X expected Q2 annualized revenue. As a result, I continue to recommend it.

4. Amazon stock will outpace the market (it closed last year at $3257/share).

Amazon shares increased by 76% last year while revenue in Q3 was up 37% year over year (versus 21% in 2019). This meant the stock performance exceeded revenue growth as its multiple of revenue expanded in concert with the increased revenue growth rate. Net Income grew 197% YoY in the quarter as the leverage in Amazon’s model became apparent despite the company continuing to have “above normal” expenditures related to Covid. We expect the company to continue at elevated revenue and earnings growth rates in Q4 and Q1 before reaching comps with last year’s Covid quarters. Once that happens growth will begin to decline towards the 20-25% level in the latter half of 2021.

What will remain in place post-Covid is Amazon’s dominance in retail, leading share in Web Services and control of the book industry. Additionally, Amazon now has a much larger number of customers for its Food Services than prior to the pandemic. All in all, it will likely mean that the company will have another strong year in 2021 with overall growth in the 25-30% range for the year and earnings growing much faster. But remember, the degree earnings grow is completely under Amazon’s control as they often increase spend at faster rates than expected, especially in R&D.

5. Zoom Video Communications will continue to outperform the market (it closed last year at $337/share)

When I began highlighting Zoom in my post on June 24, 2019, it was a relatively unknown company. Now, it is a household name. I’d like to be able to say I predicted that, but it came as a surprise. It was the pandemic that accelerated the move to video conferencing as people wanted more “personal contact” than a normal phone call and businesses found it enhanced communications in a “work at home world”. Let me remind you what I saw in Zoom when I added it to the list last year, while adding some updated comments in bold:

  1. At the time, Revenue retention of business customers with at least 10 employees was about 140%. In Q3, FY 2021 revenue retention of business customers was still 130% despite pandemic caused layoffs.
  2. It acquires customers very efficiently with a payback period of 7 months as the host of a Zoom call invites various people to participate in the call and those who are not already Zoom users can be readily targeted by the company at little cost. Now that Zoom is a household name, acquiring customers should be even less costly.
  3. At the time, Gross Margins were over 80% and I believed they could increase. In Q3, GM had declined to 68% as usage increased dramatically and Zoom made its products available to K-12 schools for free. Given that students were all mostly attending school virtually, this is a major increase in COGs without associated revenue. When the pandemic ends gross margins should return close to historic levels – adding to Zoom profits. 
  4. The product has been rated best in class numerous times
  5. Its compression technology (the key ingredient in making video high quality) appears to have a multi-year lead over the competition
  6. Adding to those reasons I noted at the time that ZM was improving earnings and was slightly profitable in its then most recent reported quarter. With the enormous growth Zoom experienced it has moved to significant profitability and multiplied its positive cash flow.

While ZM stock appreciated 369% in 2020, it actually was about equal to its revenue growth rate in Q3 2020, meaning that the price to revenue was the same as a year earlier before despite:

  • Moving to significant profitability
    • Becoming a Household name  
    • Having a huge built-in multiplier of earnings as schools re-open

6. CrowdStrike will outperform the market (it closed 2020 at $211/share and is now at 217.93)

When I evaluate companies, one of the first criteria is whether their sector has the wind behind its back. I expect the online security industry to not only grow at an accelerated pace but also face an upheaval as more modern technology will be used to detect increased attacks from those deploying viruses, spam, intrusions and identity theft. I suspect all of you have become increasingly aware of this as virus after virus makes the news and company after company reports “breaches” into their data on customers/users.

The U.S. cyber security market was about $67 billion in 2019 and is forecast to grow to about $111 billion by 2025 (per the Business Research Company’s report). Yet Cloud Security spend remains at only about 1.1% of total Cloud IT spend (per IDC who expects that percent to more than double). CrowdStrike is the player poised to take the most advantage of the shift to the cloud and the accompanying need for best-in-class cloud security. It is the first Cloud-Native Endpoint Security platform. As such it is able to monitor over 4 trillion signals across its base of over 8500 subscription customers. The companies leading technology for modern corporate systems has led to substantial growth (86% YoY in its October quarter). It now counts among its customers 49 of the Fortune 100 and 40 of the top global 100 companies.

Tactically, the company continues to add modules to its suite of products and 61% of its customers pay for 4 or more, driving solid revenue retention. The company targets exceeding 120% of the prior year’s revenue from last year’s cohort of customers. They have succeeded in this for 8 quarters in a row through upselling customers combined with retaining 97% – 98% of them. Because of its cloud approach, growing also has helped gross margins grow from 55% in FY 18 to 66% in FY 19 to 72% in FY 20 and further up to 76% in its most recent quarter. This, combined with substantial improvement in the cost of sales and marketing (as a % of revenue) has in turn led to the company going from a -100% operating margin in Fiscal 2018 to +8% in Q3, FY21. It seems clear to me that the profit percentage will increase dramatically in FY22 given the leverage in its model.  

Non-Stock Picks for 2021

7. Online Advertising Companies will Experience a Spike in Growth in the Second Half of 2021

The pandemic hit was devastating for the travel industry, in-person events and associated ticket sellers, brick and mortar retailers and clothing brands.  Rational behavior necessitated a dramatic reduction of advertising spend for all those impacted. U.S. advertising revenue declined by 4.3% to $213 billion, or around 17% according to MagnaGlobal, if one excludes the jump in political advertising (discussed in our last post), with Global spend down 7.2%. That firm believes digital formats grew revenue about 1% in 2020 (with TV, radio and print declining more than average). Digital formats would normally be up substantially as they continue to gain share, so the way to think about this is that they experienced 10-20% less revenue than would have occurred without Covid.

Assuming things return to normal in H2 2021, digital advertising will continue to gain share, total industry revenue will be higher than it would have been without Covid (even without the increased political spending in 2020) and comps will be easy ones in H2 of 2021.  While there will not be major political spending there could be Olympic games which typically boost ad spend. So, while we removed Facebook from our 6 stock picks, it and other online players should be beneficiaries.

8. Real Estate will Show Surprising Resiliency in 2021

The story lines for Real Estate during the pandemic have been:

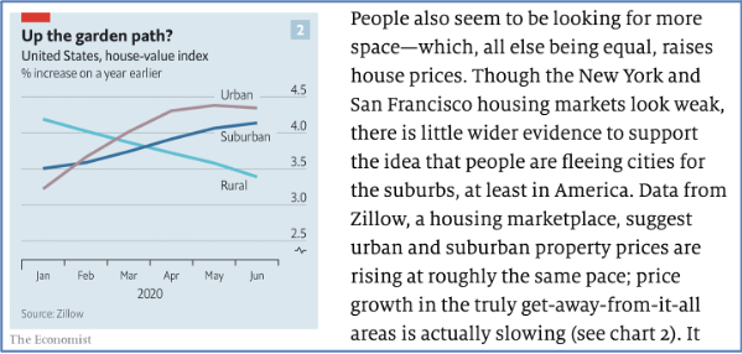
  1. The flight to larger outside space has caved urban pricing while driving up suburban values
  2. Commercial real estate pricing (and profits) is collapsing, creating permanent impairment in their value for property owners with post-pandemic demand expected to continue to fall

My son Matthew is a real estate guru who has consulted to cities like New York and Austin, to entities like Burning Man and is also a Professor of Real Estate Economics at NYU. I asked him to share his thoughts on the real estate market.

Both Matthew (quoted below) and I disagree with the story lines. I believe a portion of the thinking regarding commercial real estate pricing relates to the collapse of WeWork. That company, once the darling of the temporary rental space, had a broken IPO followed by a decline in value of nearly 95%. But the truth is that WeWork had a model of committing to long term leases (or purchasing property without regard to obtaining lowest cost possible) and renting monthly. Such a company has extreme risk as it is exposed to downturns in the business cycle where much of their business can disappear. Traditional commercial property owners lease for terms of 5 to 25 years, with 10-15 years being most common, thus reducing or even eliminating that risk as leases tend to be across business cycles. The one area where both Matthew and I do believe real estate could be impacted, at least temporarily, is in Suburban Malls and retail outlets where Covid has already led to acceleration of bankruptcies of retailers a trend I expect to continue (see prediction 10).

The rest of this prediction is a direct quote from Matthew (which I agree with).

“Real estate in 2021 will go down as the year that those who do not study history will be doomed to repeat it. The vastly overblown sentiments of the “death of the city” and the flight to the suburbs of households and firms will be overshadowed by the facts. 

In the residential world, while the market for rentals may have somewhat softened, no urban owners have been quick to give up their places, in fact, they turned to rent them even as they buy or rent roomier locations within the city or additional places outside the cities, driving up suburban prices more quickly. In fact, even in markets such as NYC, per square foot housing sale prices are stable or rising. US homebuilding sentiment is the highest in 35 years, with several Y/Y growth statistics breaking decades long records leading up to a recent temporary fizzle due to political turmoil. 

The commercial office world, which many decry as imminently bust due to the work at home boom, has seen a slowdown of new leases signed in some areas. But because most commercial office leases are of a 10–15-year term, a single bad year has little effect. While some landlords will give concessions today for an extended term tomorrow, their overall NPV may remain stable or even rise. In the meantime, tech giants like Amazon are gobbling up available space in the Seattle and Bellevue markets, and Facebook announced a 730,000 square foot lease in midtown Manhattan late in the year. In the end, the persistence of cities as clusters of activity that provide productivity advantages to firms and exceptional quality of life, entertainment options, restaurants and mating markets to individuals will not diminish. The story of cities is the story of pandemic after pandemic, each predicting the death of the city and each resulting in a larger, denser, more successful one. 

The big story of real estate in 2021 will be the meteoric rise of industrial, which began pre-COVID and was super charged as former in-person sales moved to online and an entire holiday season was run from “dark stores” and warehouses. The continual build out of the last mile supply chain will continue to lower the cost of entry for retailers to accelerate cheaper delivery options. This rising demand for industrial will continue the trend of the creation of “dark stores” which exist solely as shopping locations for couriers, Instacart, Whole Foods and Amazon. Industrial is on the rise and the vaccine distribution problems will only accelerate that in 2021.”

9. Large Brick and Mortar Retailers will continue their downward trend with numerous bankruptcies and acquisitions by PE Firms as consumer behavior has permanently shifted

While bankruptcies are commonplace in the retail world, 2020 saw an acceleration and there was a notable demise of several iconic B&M (Brick & Mortar) brands, including:

It is important to understand that a bankruptcy does not necessarily mean the elimination of the entity, but instead often is a reorganization that allows it to try to survive. Remember many airlines and auto manufacturers went through a bankruptcy process and then returned stronger than before. Often, as part of the process, a PE firm will buy the company out of bankruptcy or buy the brand during the bankruptcy process. For example, JC Penny filed for bankruptcy protection in May, 2020 and was later acquired by the Simon Property Group and Brookfield Property Partners in September, 2020. Nieman Marcus was able to emerge from bankruptcy protection without being acquired. However, in both cases, reorganizing meant closing numerous stores.

There are many who believe things will: “go back to normal” once the pandemic ends. I believe this could not be further from the truth as consumer behavior has been permanently impacted. During the pandemic, 150 million consumers shopped online for the first time and learned that it should now be part of how they buy. But, even more importantly, those who had shopped online previously became much more frequent purchasers as they came to rely on its advantages:

  1. Immediate accessibility to what you want (unlike out of stock issues in Brick and Mortar retail)
  2. Fast and Free shipping in most cases
  3. A more personalized experience than in store purchasing

As older Brick & Mortar brands add online shopping to their distribution strategy, most are unable to offer the same experience as online brands. For example, when you receive a package from Peloton the unboxing experience is an absolute delight, when you receive one from Amazon it is perfectly wrapped. On the other hand, I have bought products online from Nieman Marcus, an extremely high-end retailer, and the clothes seemed to be tossed into the box, were creased and somewhat unappealing when I opened the box. Additionally, a company like Amazon completely understands the importance of customer retention and its support is extraordinary, while those like Best Buy that offer online purchasing fall far of the bar set by Amazon.

What that all means is that many Brick and Mortar retailers will not solve their issues:

  • Adding more of an online push will not be enough
    • Customers that have experienced the benefits of online purchasing will continue to use it in much greater amounts than before the pandemic
    • Ecommerce will continue to take share from Brick and Mortar stores
    •  

As a result, we believe that in 2021 the strain on physical retail will continue, resulting in many more well-known (and lesser known) store chains and manufacturing brands filing for bankruptcy as the dual issues of eCommerce and of the pandemic keeping stores closed and/or operating at greatly diminished customer traction throughout most of the year. Coming on the heels of a disastrous 2020 it will be harder for many of them to even emerge from bankruptcy after reorganizing (including closing many stores). 

10. The Warriors will make the playoffs this Year

I couldn’t resist including one fun pick. We did speak about this in our last post but wanted to include it as an actual 2021 pick. Many pundits had the Warriors as dead before this season began once Klay Thompson was injured. And, of course, more piled on when the team lost its first 2 games by large margins. But they were mis-analyzing several significant factors:

  • Steph Curry is still Steph Curry at his peak no matter who the supporting cast
  • Andrew Wiggins is a superior talent who has the ability to shine on both offense and defense now that he is no longer in a sub-optimal Minnesota environment
  • Kelly Oubre Jr is also talented enough to be a great defender. His offense, while poor so far, is well above average and over the course of the season that should show well
  • Draymond Green is in his prime and remains one of the top defenders in the league. He is also a great facilitator on the offensive end of the floor.
  • James Wiseman is a phenomenon with the talent to be a star. As the season progresses, I expect him to continue to get better and become a major factor in Warrior success
  • Eric Pascal was on the all-rookie team last year and has gotten better

It is clear that the team needs more games to get Curry and Green back into peak playing condition, Wiseman to gain experience and the Warriors to become acclimated to playing together. They have started to show improved defense but still need time to develop offensive rhythm. I expect them to be a major surprise this year and make the playoffs.

SoundBytes

  • Please Wear A Mask: I recently read a terrific book describing the 1918 flu pandemic called The Great Influenza by John Barry. That pandemic was much deadlier than the current one, with estimates of the number of people it killed ranging from 35 million to 100 million when the world population was less than 25% of what it is today. What is so interesting is how much the current situation has replicated the progress of that one. One of the most important conclusions Barry draws from his extensive study of the past is that wearing a mask is a key weapon for reducing the spread.

Week Seven of Sheltering in Place

As hard as it would have been to believe back in the olden days (like in February) my wife and I are now in the 7th week of “Sheltering in Place” and it has just been extended another 4 weeks. The questions constantly being discussed among my colleagues, friends and family are:

  1. How long will this last?
  2. What will life be like at the beginning of the end of this initiative?
  3. When will things go back to normal?
  4. Who will the Warriors draft with their high pick this year (OK not everyone brings this one up)?

I’m not going to try to answer any of these as I’m sure you are all bombarded with potential answers and there are many who know more than I do regarding a pandemic. In this post I’ll try to grapple with 3 different questions, each of which deserves a section below.

Question 1: How will the long-term ramifications of Covid-19 impact success for companies and what can they do to enhance their opportunity?

This is a long-winded question and will get a long-winded answer. To begin, I believe this will only accelerate several trends that are already in place: online commerce gaining share, the use of video conferencing and the virtual workplace, as well as increased emphasis of companies being economically efficient. The pandemic has forced most people to be much more cautious at venturing out to accomplish such everyday tasks as shopping, eating in restaurants and going to the movies. Instead, they are learning that almost everything can be bought online (including food from some top restaurants), conferencing with Zoom provides a great experience at a low cost, and business efficiency will be correlated with survival.

My wife and I have long been online shoppers but as we shelter at home, we have increased the volume of purchases quite significantly. Department stores that were previously experiencing loss of share to online merchants but were resistant to devoting sufficient effort to their own online stores are in deep trouble. It appears likely that a number of well-known and not so well-known retailers will file for bankruptcy within the next few months. The combination of people becoming more comfortable with buying just about everything online and a major reduction in the number of physical outlets will open up more share for online players and for the online stores of multi-channel merchants.

During the current environment my board meetings (as well as everyone else’s) are being held as Zoom conference calls. For many companies, having such a meeting eliminates travel and hotel expenses for employees, board members and advisors. Replacing this with a Zoom conference call can mean lowering the cost to hundreds of dollars, from tens to hundreds of thousands of dollars, per meeting. While I am a big fan of the value of face to face, many companies will be re-evaluating whether having more of their meetings through video conferencing makes sense in an era when the technology has emerged as very viable and extremely cost effective. I’m not suggesting that all board meeting will be executed as video conference calls as face-face remains important, but perhaps companies will decide to do half of their meetings as a Zoom call. An interesting example is the NFL draft, where it was conducted through use of Zoom instead of renting a large stadium and paying for  travel expenses. Reviews have suggested that it was actually a better event than the prior year. I suspect the cost savings between all parties involved ran into the millions of dollars.

For many companies the pandemic has weakened revenue, putting pressure on survival. The government “bailout” PPP program helps, but by itself can prove insufficient to prop up companies with weak business models unless they have a very large cash reserve. The investment community was already shifting to focus more on efficient business models prior to Covid-19 but its disruption has helped to highlight the importance of building a profitable business.

Question 2: What should Companies do in the current environment?

What Azure has been suggesting for its portfolio companies is the following series of steps:

  1. If you are eligible, apply for government assistance through the PPP, SBA emergency loan or other programs.
  2. Create multiple models for your business under different scenarios (different dates that people will be back to normal, whether consumer spending will be reduced even after being back, whether customers will delay payments, etc.)
  3. If one or more of credible scenarios indicate that you will run out of cash, then cut costs as quickly as possible. For employees making over $100,000 per year (including founders) cutting them back to some amount that is still at $100,000 or more will have no impact on the forgiveness offered on the PPP loan.
  4. Make every attempt to extend any bank lines coming due as banks have been asked to cooperate with their customers.
  5. If you can afford it, be as kind as possible to your customers by extending terms, etc. Not all, but many, will remember your help and repay you with increased loyalty.
  6. While advertising seems an easy area to cut costs, make sure you evaluate the payback period for customer acquisition marketing as costs may be lower and online conversion may be higher (we have seen that with a number of our companies). In fact, if the payback is reasonably quick it may pay to play offense by being aggressive!
  7. If you have a strong cash position it may be a time to consider acquisitions as many companies will be struggling.
  8. If you have a product that customers are opting to purchase in this environment, think about trying to convert as many as possible to a subscription so that you can extend the relationship beyond the current situation. This can be done by offering attractive discounts for signing up for one or more years rather than month to month. For example, Zoom offers 2 months free if you opt for an annual plan versus a monthly plan. My wife and I decided the cost savings made it worth signing up for a full year.

Question 3: Who are the current and longer-term winners and losers as a result of Covid-19?

Winners

The biggest winners appear to be those that can leverage working at home, educating at home, buying at home, supplying infrastructure for increased online usage, and supplying products for increased cleanliness of surfaces and one’s self. In the public markets, I fortunately have 3 of my annual Blog recommendations included in these categories:

  • Zoom is the most obvious example of a beneficiary of people working and educating at home. It has reported that daily usage is up an astounding 30X between December and April. Its stock performance is just as astounding, up well over 100% year to date from the time of my pick in early January. The question for the company is whether they can harness this to make us permanently change how we communicate. For my wife and I, the number of Zoom calls we are on is now running between 5 and 10 per week. When I add my business calls the number is quite a bit higher. As they say: “How ya gonna keep ’em down on the farm after they’ve seen Paree?” That is, we are permanent customers as are many of our friends and colleagues.


  • DocuSign is another of my blog picks that should benefit in both the near term and longer term from the impact of the virus and sheltering at home. Its stock reflects higher expectation as it has increased in value by 41% year-to-date. If more meetings are going to be virtual then more documents will require esignatures and DocuSign is the runaway leader in the category


  • There are many other pure play beneficiaries of a future where more people entertain themselves, work and educate at home. This includes Netflix (stock up over 25%) who has seen a large spike in usage, Slack (stock up 30% since January 27), and online educational plays (our former company Education.com has seen a large spike in traffic and revenue as has our existing portfolio company Showbie)


  • Amazon is the poster child for purchasing online. It has announced hiring of 175,000 employees for increased warehouse and logistics operations which Wall Street interpreted as a massive increase in demand driving the stock to new highs (its currently up over 25% YTD). It should also benefit from increased purchases of eBooks and increased online usage of its Web Services (I haven’t seen much chatter about AWS benefit but it should be very large and is highly profitable). Azure portfolio company, Open Road is seeing a significant increase in its sales of eBooks since sheltering-at-home began.


  • Infrastructure Companies whose revenue varies with web usage should also benefit as volumes are increasing massively: Zoom announced that daily usage is up 3,000%; many others I’ve heard have ranged from 50% to 700% or more. Schools are converting to online classes with student usage increasing to 4-7 hours per day. Gaming companies are also beneficiaries and users. I believe that total web traffic is up at least 50% and perhaps a lot more versus where it would have been.


  • Clorox is one of the major beneficiaries of our new emphasis on cleanliness through disinfecting our environment and washing our hands many times a day, as recommended by the new folk hero Dr. Fauci. While its stock is up 20% year-to-date, the question is whether the increased demand for disinfectants is a permanent change. I’m guessing that increased usage is permanent… but not to the extent we are seeing today.

Long-Term Losers

Losers span several industries and the question for many of the companies in these industries is how permanent the loss of demand will be. Let’s look at them sector by sector.

  • Department Stores are currently shut down in most of the United States. Companies already struggling are now experiencing substantial losses every week. Those that have a pharmacy or grocery area (like Walmart) can stay open, but the real key to reducing the losses is the effectiveness of their online offering. In most cases this is pretty weak, both in percentage of the retailer’s sales and the level of profitability given inefficient distribution and high levels of returns. I expect multiple brand name players to file for bankruptcy before the year is over.


  • The Travel Industry is being hit very hard by the shelter-in-place requirements. Airlines are flying planes that are nearly empty but trying to maintain their cash by not cancelling flights until close to the date of departure so that passengers cancelling will get credits rather than rebates. One hotel I spoke to when cancelling my reservation told me that occupancy was down 90%. Many have already closed their properties. While I expect business to improve greatly for both of these arenas when we are back to normal, they are both accumulating massive losses which might pressure viability. Further, when we are back to normal (whatever that becomes) I suspect that airline traffic will be down through at least mid-2021 as fears are elevated and will take some time to subside. Cruise lines may be in worse shape as the publicity around the various ships that had large portions of passengers and crew get Covid-19 has definitely caused many to reconsider vacationing this way. I expect this sector to be impacted at least through the end of 2021. Also, cruises have had to refund most fares as opposed to providing a credit for future travel.


  • Arena Entertainment providers and entertainers have been hurt badly by the closure of their venues during this time period. This includes movie theaters as well as complexes like the Chase Center and other arenas. The question becomes when will they be able to be open for full occupancy? And when they are will people stay away for some time. I expect many of them to be at full occupancy by early 2021 as younger people (who make up the majority who attend concerts) will drive renewal of demand for concerts.

Short-term Losers that can Return to Success

  • Advertising Platforms (TV, Web, etc) have seen demand drop as the travel industry, live events and brick and mortar retailers have little reason to maintain prior spending. Additionally, those companies looking to cut cost view advertising (especially brand building advertising) as a prime candidate for cuts. However, I believe that demand will return to normal as stores reopen and travel is permitted. As of now this appears to be sometime in Q3. While many companies in sectors that take longer to return to normal will still have reduced budgets, online players will likely increase spend, as will those seeing this as an opportunity to gain share.


  • The Sports Industry consists of teams, leagues, arenas, ticket sellers (like Stubhub), equipment providers and betting. All of these are experiencing close to zero revenue (with the exception of some equipment being sold for home use). Leagues (and teams) with large TV contracts are likely to reinitiate games without live audiences by July as participants can be restricted to those having tested for no virus immediately before a game. Even without an audience the TV money will make this profitable to do. Once these are back in play, betting will resume. Equipment providers can still sell T-shirts and other paraphernalia online, but once games resume their sales will increase. By as early as the fall, but no later than early 2021, I expect that many states will allow live audiences for games and that arenas will be back to normal capacity for them. This would allow ticket sellers and sports betting to be at normal capacity. Equipment suppliers also depend on school purchases as well as little league, etc. So, while revenue will begin growing in the fall it may not be back to normal before early 2021.  A noted exception will be providers of at home equipment, like Peloton, which will lose business from gyms in the short run but should see a large increase in at-home purchases.


  • Non-Internet Service Providers (other than delivery services) have a particularly hard time as physical services cannot be provided online. Things like the Geek Squad, physician checkups and procedures, elective surgeries, automotive services, personal care like haircuts and manicures, massages, and more have been suspended. But as long as the entities survive this period, I believe there will be no permanent impairment of their businesses.


Conclusion

Coming back to where this post began, I’m still wondering who the Warriors will draft! But more importantly, I hope all of you and your families are safe and healthy. We will get through this!

2020 Top Ten Predictions

I wanted to start this post by repeating something I discussed in my top ten lists in 2017 and 2018 which I learned while at Sanford Bernstein in my Wall Street days: “Owning companies that have strong competitive advantages and a great business model in a potentially mega-sized market can create the largest performance gains over time (assuming one is correct).” It does make my stock predictions somewhat boring (as they were on Wall Street where my top picks, Dell and Microsoft each appreciated over 100X over the ten years I was recommending them).

Let’s do a little simple math. Suppose one can generate an IRR of 26% per year (my target is to be over 25%) over a long period of time.  The wonder of compounding is that at 26% per year your assets will double every 3 years. In 6 years, this would mean 4X your original investment dollars and in 12 years the result would be 16X. For comparison purposes, at 5% per year your assets would only be 1.8X in 12 years and at 10% IRR 3.1X.  While 25%+ IRR represents very high performance, I have been fortunate enough to consistently exceed it (but always am worried that it can’t keep up)! For my recommendations of the past 6 years, the IRR is 34.8% and since this exceeds 26%, the 6-year performance  is roughly 6X rather than 4X.

What is the trick to achieving 25% plus IRR? Here are a few of my basic rules:

  1. Start with companies growing revenue 20% or more, where those closer to 20% also have opportunity to expand income faster than revenue
  2. Make sure the market they are attacking is large enough to support continued high growth for at least 5 years forward
  3. Stay away from companies that don’t have profitability in sight as companies eventually should trade at a multiple of earnings.
  4. Only choose companies with competitive advantages in their space
  5. Re-evaluate your choices periodically but don’t be consumed by short term movement

As I go through each of my 6 stock picks I have also considered where the stock currently trades relative to its growth and other performance metrics. With that in mind, as is my tendency (and was stated in my last post), I am continuing to recommend Tesla, Facebook, Amazon, Stitch Fix and DocuSign. I am adding Zoom Video Communications (ZM) to the list. For Zoom and Amazon I will recommend a more complex transaction to achieve my target return.

2020 Stock Recommendations:

1. Tesla stock appreciation will continue to outperform the market (it closed last year at $418/share)

Tesla is likely to continue to be a volatile stock, but it has so many positives in front of it that I believe it wise to continue to own it. The upward trend in units and revenue should be strong in 2020 because:

  • The model 3 continues to be one of the most attractive cars on the market. Electric Car Reviews has come out with a report stating that Model 3 cost of ownership not only blows away the Audi AS but is also lower than a Toyota Camry! The analysis is that the 5-year cost of ownership of the Tesla is $0.46 per mile while the Audi AS comes in 70% higher at $0.80 per mile. While Audi being more expensive is no surprise, what is shocking is how much more expensive it is. The report also determined that Toyota Camry has a higher cost as well ($0.49/mile)! Given the fact that the Tesla is a luxury vehicle and the Camry is far from that, why would anyone with this knowledge decide to buy a low-end car like a Camry over a Model 3 when the Camry costs more to own?  What gets the Tesla to a lower cost than the Camry is much lower fuel cost, virtually no maintenance cost and high resale value. While the Camry purchase price is lower, these factors more than make up for the initial price difference
  • China, the largest market for electronic vehicles, is about to take off in sales. With the new production facility in China going live, Tesla will be able to significantly increase production in 2020 and will benefit from the car no longer being subject to import duties in China.  
  • European demand for Teslas is increasing dramatically. With its Chinese plant going live, Tesla will be able to partly meet European demand which could be as high as the U.S. in the future. The company is building another factory in Europe in anticipation. The earliest indicator of just how much market share Tesla can reach has occurred in Norway where electric cars receive numerous incentives. Tesla is now the best selling car in that country and demand for electric cars there now exceeds gas driven vehicles.

While 2020 is shaping up as a stairstep uptick in sales for Tesla given increased capacity and demand, various factors augur continued growth well beyond 2020. For example, Tesla is only partway towards having a full lineup of vehicles. In the future it will add:

  • Pickup trucks – where pre-orders and recent surveys indicate it will acquire 10-20% of that market
  • A lower priced SUV – at Model 3 type pricing this will be attacking a much larger market than the Model X
  • A sports car – early specifications indicate that it could rival Ferrari in performance but at pricing more like a Porsche
  • A refreshed version of the Model S
  • A semi – where the lower cost of fuel and maintenance could mean strong market share.

2. Facebook stock appreciation will continue to outperform the market (it closed last year at $205/share)

Facebook, like Tesla, continues to have a great deal of controversy surrounding it and therefore may sometimes have price drops that its financial metrics do not warrant. This was the case in 2018 when the stock dropped 28% in value during that year. While 2019 partly recovered from what I believe was an excessive reaction, it’s important to note that the 2019 year-end price of $205/share was only 16% higher than at the end of 2017 while trailing revenue will have grown by about 75% in the 2-year period. The EPS run rate should be up in a similar way after a few quarters of lower earnings in early 2019. My point is that the stock remains at a low price given its metrics. I expect Q4 to be quite strong and believe 2020 will continue to show solid growth.

The Facebook platform is still increasing the number of active users, albeit by only about 5%-6%. Additionally, Facebook continues to increase inventory utilization and pricing. In fact, given what I anticipate will be added advertising spend due to the heated elections for president, senate seats, governorships etc., Facebook advertising inventory usage and rates could increase faster (see prediction 7 on election spending).  

Facebook should also benefit by an acceleration of commerce and increased monetization of advertising on Instagram. Facebook started monetizing that platform in 2017 and Instagram revenue has been growing exponentially and is likely to close out 2019 at well over $10 billion. A wild card for growth is potential monetization of WhatsApp. That platform now has over 1.5 billion active users with over 300 million active every day. It appears close to beginning monetization.

The factors discussed could enable Facebook to continue to grow revenue at 20% – 30% annually for another 3-5 years making it a sound longer term investment.

3. DocuSign stock appreciation will continue to outperform the market (it closed last year at $74/share)

DocuSign is the runaway leader in e-signatures facilitating multiple parties signing documents in a secure, reliable way for board resolutions, mortgages, investment documents, etc. Being the early leader creates a network effect, as hundreds of millions of people are in the DocuSign e-signature database. The company has worked hard to expand its scope of usage for both enterprise and smaller companies by adding software for full life-cycle management of agreements. This includes the process of generating, redlining, and negotiating agreements in a multi-user environment, all under secure conditions. On the small business side, the DocuSign product is called DocuSign Negotiate and is integrated with Salesforce.

The company is a SaaS company with a stable revenue base of over 560,000 customers at the end of October, up well over 20% from a year earlier. Its strategy is one of land and expand with revenue from existing customers increasing each year leading to a roughly 40% year over year revenue increase in the most recent quarter (fiscal Q3). SaaS products account for over 95% of revenue with professional services providing the rest. As a SaaS company, gross margins are high at 79% (on a non-GAAP basis).

The company has now reached positive earnings on a non-GAAP basis of $0.11/share versus $0.00 a year ago. I use non-GAAP as GAAP financials distort actual results by creating extra cost on the P&L if the company’s stock appreciates. These costs are theoretic rather than real.

My only concern with this recommendation is that the stock has had a 72% runup in 2019 but given its growth, move to positive earnings and the fact that SaaS companies trade at higher multiples of revenue than others I still believe it can outperform this year.

4. Stitch Fix Stock appreciation will continue to outperform the market (it closed last year at $25.66/share)

Stitch Fix offers customers, who are primarily women, the ability to shop from home by sending them a box with several items selected based on sophisticated analysis of her profile and prior purchases. The customer pays a $20 “styling fee” for the box which can be applied towards purchasing anything in the box. The company is the strong leader in the space with revenue approaching a $2 billion run rate. Unlike many of the recent IPO companies, it has shown an ability to balance growth and earnings. The stock had a strong 2019 ending the year at $25.66 per share up 51% over the 2018 closing price. Despite this, our valuation methodology continues to show it to be substantially under valued and it remains one of my picks for 2020. The likely cause of what I believe is a low valuation is a fear of Amazon making it difficult for Stitch Fix to succeed. As the company gets larger this fear should recede helping the multiple to expand.  

Stitch Fix continues to add higher-end brands and to increase its reach into men, plus sizes and kids. Its algorithms to personalize each box of clothes it ships keeps improving. Therefore, the company can spend less on acquiring new customers as it has increased its ability to get existing customers to spend more and come back more often. Stitch Fix can continue to grow its revenue from women in the U.S. with expansion opportunities in international markets over time. I believe the company can continue to grow by roughly 20% or more in 2020 and beyond.

Stitch Fix revenue growth (of over 21% in the latest reported quarter) comes from a combination of increasing the number of active clients by 17% to 3.4 million, coupled with driving higher revenue per active client. The company accomplished this while generating profits on a non-GAAP basis.

5. Amazon stock strategy will outpace the market (it closed last year at $1848/share).

Amazon shares increased by 23% last year while revenue in Q3 was up 24% year over year. This meant the stock performance mirrored revenue growth. Growth in the core commerce business has slowed but Amazon’s cloud and echo/Alexa businesses are strong enough to help the company maintain roughly 20% growth in 2020. The company continues to invest heavily in R&D with a push to create automated retail stores one of its latest initiatives. If that proves successful, Amazon can greatly expand its physical presence and potentially increase growth through the rollout of numerous brick and mortar locations. But at its current size, it will be difficult for the company to maintain over 20% revenue growth for many years (excluding acquisitions) so I am suggesting a more complex investment in this stock:

  1. Buy X shares of the stock (or keep the ones you have)
  2. Sell Amazon puts for the same number of shares with the puts expiring on January 15, 2021 and having a strike price of $1750. The most recent sale of these puts was for over $126
  3. So, net out of pocket cost would be reduced to $1722
  4. A 20% increase in the stock price (roughly Amazon’s growth rate) would mean 29% growth in value since the puts would expire worthless
  5. If the stock declined 226 points the option sale would be a break-even. Any decline beyond that and you would lose additional dollars.
  6. If the options still have a premium on December 31, I will measure their value on January 15, 2021 for the purposes of performance.

6. I’m adding Zoom Video Communications to the list but with an even more complex investment strategy (the stock is currently at $72.20)

I discussed Zoom Video Communications (ZM) in my post on June 24, 2019. In that post I described the reasons I liked Zoom for the long term:

  1. Revenue retention of a cohort was about 140%
  2. It acquires customers very efficiently with a payback period of 7 months as the host of a Zoom call invites various people to participate in the call and those who are not already Zoom users can be readily targeted by the company at little cost
  3. Gross Margins are over 80% and could increase
  4. The product has been rated best in class numerous times
  5. Its compression technology (the key ingredient in making video high quality) appears to have a multi-year lead over the competition
  6. Adding to those reasons it’s important to note that ZM is improving earnings and was slightly profitable in its most recent reported quarter

The fly in the ointment was that my valuation technology showed that it was overvalued. However, I came up with a way of “future pricing” the stock. Since I expected revenue to grow by about 150% over the next 7 quarters (at the time it was growing over 100% year over year) “future pricing” would make it an attractive stock. This was possible due to the extremely high premiums for options in the stock. So far that call is working out. Despite the company growing revenue in the 3 quarters subsequent to my post by over 57%, my concern about valuation has proven correct and the stock has declined from $76.92 to $72.20. If I closed out the position today by selling the stock and buying back the options (see Table 1) my return for less than 7.5 months would be a 42% profit. This has occurred despite the stock declining slightly due to shrinkage in the premiums.

Table 1: Previous Zoom trade and proposed trade

I typically prefer using longer term options for doing this type of trade as revenue growth of this magnitude should eventually cause the stock to rise, plus the premiums on options that are further out are much higher, reducing the risk profile, but I will construct this trade so that the options expire on January 15, 2021 to be able to evaluate it in one year. In measuring my performance we’ll use the closing stock price on the option expiration date, January 15, 2021 since premiums in options persist until their expiration date so the extra 2 weeks leads to better optimization of the trade.

So, here is the proposed trade (see table 1):

  1. Buy X shares of the stock at $72.20 (today’s price)
  2. Sell Calls for X shares expiring January 15, 2021 at a strike of $80/share for $11.50 (same as last price it traded)
  3. Sell puts for X shares expiring January 15, 2021 with strike of $65/share for $10.00 (same as last price it traded)

I expect revenue growth of 60% or more 4 quarters out. I also expect the stock to rise some portion of that, as it is now closer to its value than when I did the earlier transaction on May 31, 2019. Check my prior post for further analysis on Zoom, but here are 3 cases that matter at December 31, 2020:

  • Stock closes over $80/share (up 11% or more) at end of the year: the profit would be 58% of the net cost of the transaction
    • This would happen because the stock would be called, and you would get $80/share
    • The put would expire worthless
    • Since you paid a net cost of $50.70, net profit would be $29.30
  • Stock closes flat at $72.20:  your profit would be $21.50 (42%)
    • The put and the call would each expire worthless, so you would earn the original premiums you received when you sold them
    • The stock would be worth the same as what you paid
  • Stock closes at $57.85 on December 31: you would be at break even. If it closed lower, then losses would accumulate twice as quickly:
    • The put holder would require you to buy the stock at the put exercise price of $65, $7.15 more than it would be worth
    • The call would expire worthless
    • The original stock would have declined from $72.20 to $57.85, a loss of $14.35
    • The loss on the stock and put together would equal $21.50, the original premiums you received for those options

Outside of my stock picks, I always like to make a few non-stock predictions for the year ahead.

7. The major election year will cause a substantial increase in advertising dollars spent

According to Advertising Analytics political spending has grown an average of 27% per year since 2012. Both the rise of Super PACs and the launch of online donation tools such as ActBlue have substantially contributed to this growth. While much of the spend is targeted at TV, online platforms have seen an increasing share of the dollars, especially Facebook and Google. The spend is primarily in even years, as those are the ones with senate, house and gubernatorial races (except for minor exceptions). Of course, every 4th year this is boosted by the added spend from presidential candidates. The Wall Street Journal projects the 2020 amount will be about $9.9 billion…up nearly 60% from the 2016 election year. It should be noted that the forecast was prior to Bloomberg entering the race and if he remains a viable candidate an additional $2 billion or more could be added to this total.

The portion targeted at the digital world is projected to be about $2.8 billion or about 2.2% of total digital ad spending. Much of these dollars will likely go to Facebook and Google. This spend has a dual impact: first it adds to the revenue of each platform in a direct way, but secondly it can also cause the cost of advertising on those platforms to rise for others as well.

8. Automation of Retail will continue to gain momentum

This will happen in multiple ways, including:

  1. More Brick & Mortar locations will offer some or all the SKUs in the store for online purchase through Kiosks (assisted by clerks/sales personnel). By doing this, merchants will be able to offer a larger variety of items, styles, sizes and colors than can be carried in any one outlet. In addition, the consolidation of inventory achieved in this manner will add efficiency to the business model. In the case of clothing, such stores will carry samples of items so the customer can try them on, partly to optimize fit but also to determine whether he or she likes the way it looks and feels on them. If one observes the massive use of Kiosks at airports it becomes obvious that they reduce the number of employees needed and can speed up checking in. One conclusion is this will be the wave of the future for multiple consumer-based industries.
  2. Many more locations will begin incorporating technology to eliminate the number of employees needed in their stores. Amazon will likely be a leader in this, but others will also provide ways to reduce the cost of ordering, picking goods, checking out and receiving information while at the store.

9. The Warriors will come back strong in the 2020/21 season

Let me begin by saying that this prediction is not being made because I have been so humbled by my miss in the July post where I predicted that the Warriors could edge into the 2020 playoffs and then contend for a title if Klay returned in late February/early March. Rather, it is based on analysis of their opportunity for next season and also an attempt to add a little fun to my Top Ten List!  The benefit of this season:

  • Klay and Curry are getting substantial time off after 5 seasons of heavy stress. They should be refreshed at the start of next season
  • Russell, assuming he doesn’t keep missing games with injuries, is learning the Warriors style of play
  • Because of the injuries to Klay, Curry, Looney, and to a lesser extent Green and Russell, several of the younger members of the team are getting experience at a much more rapid rate than would normally be possible and the Warriors are able to have more time to evaluate them as potential long-term assets
  • If the Warriors continue to lose at their current rate, they will be able to get a high draft choice for the first time since 2012 when they drafted Harrison Barnes with the 7th pick. Since then their highest pick has been between the 28th and 30th player chosen (30 is the lowest pick in the first round)
  • The Warriors will have more cap space available to sign a quality veteran
  • Andre Iguodala might re-sign with the team, and while this is not necessary for my prediction it would be great for him and for the team
  • The veterans should be hungry again after several years of almost being bored during the regular season

I am assuming the Warriors will be relatively healthy next season for this to occur.

10. At least one of the major Unicorns will be acquired by a larger player

In 2019, there was a change to the investing environment where most companies that did not show a hint of potential profitability had difficulty maintaining their market price. This was particularly true of highly touted Unicorns, which mostly struggled to increase their share price dramatically from the price each closed on the day of their IPO. Table 2 shows the 9 Unicorns whose IPOs we highlighted in our last post. Other than Beyond Meat, Zoom and Pinterest, they all appear some distance from turning a proforma profit. Five of the other six are below their price on the first day’s close. A 6th, Peloton, is slightly above the IPO price (and further above the first days close). Beyond Meat grew revenue 250% in its latest quarter and moved to profitability as well. Its stock jumped on the first day and is even higher today.  While Pinterest is showing an ability to be profitable it is still between the price of the IPO and its close on the first day of trading.  Zoom, which is one of our recommended buys, was profitable (on a Non-GAAP basis) and grew revenue 85% in its most recent quarter. A 10th player, WeWork, had such substantial losses that it was unable to have a successful IPO.

Table 2: Recent Unicorn IPOs Stock Price & Profitability Comparisons

Something that each of these companies have in common is that they are all growing revenue at 30% or more, are attacking large markets, and are either in the leadership position in that market or are one of two in such a position. Because of this I believe one or more of these (and comparable Unicorns) could be an interesting acquisition for a much larger company who is willing to help make them profitable. For such an acquirer their growth and leadership position could be quite attractive.

Why Apple Acquiring Tesla Seems an Obvious Step…

…and why the obvious probably won’t happen!

A Look at Apple history

Apple’s progress from a company in trouble to becoming the first company to reach a trillion dollar market cap meant over 400X appreciation in Apple stock. The metamorphosis began when the company hired Fred Anderson as an Executive VP and CFO in 1996. Tim Cook joined the company as senior VP of worldwide operations in 1998. Fred and Tim improved the company operationally, eliminating wasteful spending that preceded their tenure. Of course, as most of you undoubtedly know, bringing back Steve Jobs by acquiring his company, NeXT Computer in early 1997 added a strategic genius and great marketer to an Apple that now had an improved business model. Virtually every successful current Apple product was conceived while Steve was there. After Fred retired in 2004, Tim Cook assumed even more of a leadership role than before and eventually became CEO shortly before Jobs’ death in 2011.  

Apple post Steve Jobs

Tim Cook is a great operator. In the years following the death of Steve Jobs he squeezed every bit of profit that is possible out of the iPad, iPod, iMacs, music content, app store sales and most of all the iPhone. Because great products have a long life cycle they can increase in sales for many years before flattening out and then declining.

Table 1: Illustrative Sales Lifecycle for Great Tech Product

Cook’s limit is that he cannot conceptualize new products in the way Steve Jobs did. After all, who, besides an Elon Musk, could? The problem for Apple is that if it is to return to double digit growth, it needs a really large, successful new product as the iPhone is flattening in sales and the Apple Watch and other new initiatives have not sufficiently moved the needle to offset it. Assuming Q4 revenue growth in FY 2019 is consistent with the first 9 months, then Apple’s compound growth over the 4 years from FY 15 to FY 19 will be 3.0% (see Table 2) including the benefit of acquisitions like Beats.

iPhone sales have flattened

The problem for Apple is that the iPhone is now in the mature part of its sales life cycle. In fact, unit sales appear to be declining (Graph 1) but Apple’s near monopoly pricing power has allowed it to defy the typical price cycle for technology products where average selling prices decline over time. The iPhone has gone from a price range of $99 to $299 in June 2009 to $999 to $1449 for the iPhoneX, while the older iPhone 7 is still available with minimal storage for $449. That’s a 4.5X price increase at the bottom and nearly 5X at the high end! This defies gravity for technology products.

Graph 1: iPhone Unit Sales (2007-2018)

In the many years I followed the PC market, it kept growing until reaching the following set of conditions (which the iPhone now also faces):

  1. Improvements in features were no longer enough to drive rapid replacement cycles
  2. Pricing was under pressure as component costs declined and it became more difficult to convince buyers to add capacity or capability sufficient to hold prices where they were
  3. The number of first time users available to buy product was no longer increasing each year
  4. Competition from lower priced suppliers created pricing pressure

Prior to that time PC pricing could be maintained by convincing buyers that they needed one or more of:

  1. The next generation of processor
  2. A larger or thinner screen
  3. Next generation storage technology

What is interesting when we contrast this with iPhones is that PC manufacturers struggled to maintain average selling prices (ASPs) until they finally began declining in the early 2000s. Similarly, products like DVD players, VCRs, LCD TVs and almost every other technology driven product had to drop dramatically in price to attract a mass market. In contrast to that, Apple has been able to increase average prices at  the same time that the iPhone became a mass market product. This helped Apple postpone the inevitable revenue flattening and subsequent decline due to lengthening replacement cycles and fewer first time buyers. In the past few years, other then the bump in FY 2018 from the launch of the high priced Model X early that fiscal year, iPhone revenue has essentially been flat to down. Since it is well over 50% of Apple revenue, this puts great pressure on overall revenue growth.

To get back to double digit growth Apple needs to enter a really large market

To be clear, Apple is likely to continue to be a successful, highly profitable company for many years even if it does not make any dramatic acquisitions. While its growth may be slow, its after tax profits has been above 20% for each of the past 5 years. Strong cash flow has enabled the company to buy back stock and to support increasing dividends every year since August 2014.

Despite this, I think Apple would be well served by using a portion of their cash to make an acquisition that enables them to enter a very large market with a product that already has a great brand, traction, and superior technology. This could protect them if the iPhone enters the downside of its revenue generating cycle (and it is starting to feel that will happen sometime in the next few years). Further, Apple would benefit if the company they acquired had a visionary leader who could be the new “Steve Jobs” for Apple.

There is no better opportunity than autos

If Apple laid out criteria for what sector to target, they might want to:

  1. Find a sector that is at least hundreds of billions of dollars in size
  2. Find a sector in the midst of major transition
  3. Find a sector where market share is widely spread
  4. Find a sector ripe for disruption where the vast majority of participants are “old school”

The Automobile industry matches every criterion:

Matching 1.  It is well over $3 trillion in size

Matching 2. Cars are transitioning to electric from gas and are becoming the next technology platform

Matching 3. Eight players have between 5% and 11% market share and 7 more between 2% and 5%

Matching 4. The top ten manufacturers all started well over 50 years ago

And no better fit for Apple than Tesla

Tesla reminds me of Apple in the late 1990s. Its advocates are passionate about the company and its products. It can charge a premium versus others because it has the best battery technology coupled with the smartest software technology. The company also designs its cars from the ground up, rather than retrofitting older models, focusing on what the modern buyer would most want. Like Jobs was at Apple, Musk cares about every detail of the product and insists on ease of use wherever possible. The business model includes owning distribution outlets much like Apple Stores have done for Apple. By owning the outlets, Tesla can control its brand image much better than any other auto manufacturer. While there has been much chatter about Google and Uber in terms of self-driving cars, Tesla is the furthest along at putting product into the market to test this technology.

Tesla may have many advantages over others, but it takes time to build up market share and the company is still around 0.5% of the market (in units). It takes several years to bring a new model to market and Tesla has yet to enter several categories. It also takes time and considerable capital to build out efficient manufacturing capability and Tesla has struggled to keep up with demand. But, the two directions that the market is moving towards are all electric cars and smart, autonomous vehicles. Tesla appears to have a multi-year lead in both. What this means is that with enough capital and strong operational direction Tesla seems poised to gain significant market share.

Apple could accelerate Tesla’s growth

If Apple acquired Tesla it could:

  1. Supply capital to accelerate launch of new models
  2. Supply capital for more factories
  3. Increase distribution by offering Tesla products in Apple Stores (this would be done virtually using large computer screens). An extra benefit from this would be adding buzz to Apple stores
  4. Supply operational knowhow that would increase Tesla efficiency
  5. Add to the luster of the Tesla brand by it being part of Apple
  6. Integrate improved entertainment product (and add subscriptions) into Tesla cars

These steps would likely drive continued high growth for Tesla. If, with this type of support, it could get to 5% share in 3-5 years that would put it around $200 billion in revenue which would be higher than the iPhone is currently. Additionally, Elon Musk is possibly the greatest innovator since Steve Jobs. As a result, Tesla would bring to Apple the best battery technology, the strongest power storage technology, and the leading solar energy company. More importantly, Apple would also gain a great innovator.

The Cost of such an acquisition is well within Apple’s means

At the end of fiscal Q3, Apple had about $95 billion in cash and equivalents plus another $116 billion in marketable securities. It also has averaged over $50 billion in after tax profits annually for the past 5 fiscal years (including the current one). Tesla market cap is about $40 billion. I’m guessing Apple could potentially acquire it for less than $60 billion (which would be a large premium over where it is trading). This would be easy for Apple to afford and would create zero dilution for Apple stockholders.

If the Fit is so strong and the means are there, why won’t it happen?

I can sum up the answer in one word – ego.  I’m not sure Tim Cook is willing to admit that Elon would be a far better strategist for Apple than him. I’m not sure he would be willing to give Elon the role of guiding Apple on the product side. I’m not sure Elon Musk is willing to admit he is not the operator that Tim Cook is (remember Steve Jobs had to find out he needed the right operating/financial partners by getting fired by Apple and essentially failing at NeXT). I’m not sure Elon is willing to give up being the CEO and controlling decision-maker for his companies.

So, this probably will never happen but if it did, I believe it would be the greatest business powerhouse in history!

Soundbytes

  1. USA Today just published a story that agreed with our last Soundbytes analysis of why Klay Thompson is underrated.
  2. I expect Zoom Video to beat revenue estimates of $129 million to $130 million for the July Quarter by about $5 million or more

2019 Top Ten Predictions

Opportunity Knocks!

The 2018 December selloff provides buying opportunity

One person’s loss is another’s gain. The market contraction in the last quarter of the year means that most stocks are at much lower prices than they were in Q3 of 2018. The 5 stocks that I’m recommending (and already own) were down considerably from their Q3 2018 highs. While this may be wishful thinking, returning to those highs by the end of 2019 would provide an average gain of 78%. Each of the 5 had revenue growth of 25% or more last year (and 3 were over 35%) and each is poised for another strong year in 2019.

For the 4 continued recommendations (all of which I mentioned I would recommend again in my last post), I’ll compare closing price on December 31, 2019 to the close on December 31, 2018 for calculating performance. For the new add to my list, I’ll use the stock price as I write this post. I won’t attempt to predict the overall market again (I’m just not that good at it) but feel that the 14% drop in Q4 means there is a better chance that it won’t take a nosedive. However, since stock picks are always relative to the market, success is based on whether my picks, on average, outperform the market.

I’ll start the post with stock picks and then follow with the remaining 5 predictions.

 2019 Stocks  

Tesla stock will outpace the market (it closed last year at $333/share and is essentially the same as I write this)

In Q3, 2018 the Tesla model 3 was the bestselling car in the U.S. in terms of revenue and 5th highest by volume. This drove a 129% revenue increase versus a year earlier and $1.75 in earnings per share versus a loss of $4.22 in the prior quarter. I expect Q4 revenue to increase sequentially and growth year/year to exceed 100%. In Q3, Tesla reported that nearly half of vehicles traded in for the Model 3 were originally priced below $35,000. As Tesla begins offering sub-$40,000 versions of it, demand should include many buyers from this high-volume price range. Since the backlog for the Model 3 is about 300,000 units I expect 2019 sales to remain supply constrained if Tesla can offer lower price points (it already has announced a $2,000 price reduction). The important caveat to demand is that tax credits will be cut in H1 2019, from $7500 to $3750 and then cut again to $1875 in the second half of the year. Part of Tesla’s rationale for a $2000 price drop is to substantially offset the initial reduction of these tax credits.

Tesla began taking orders for its Q1 launch in Europe where demand over time could replicate that in the U.S. The average price of a Model 3 will initially be about $10,000 higher than in the U.S. Tesla is also building a major manufacturing facility in China (where Model 3 prices are currently over $20,000 higher than the U.S.). This Giga-Factory is expected to begin production in the latter half of 2019. While moving production to China for vehicles sold there should eliminate trade war issues, Tesla still expects to begin delivering Model 3s to Chinese customers in March.

The combination of a large backlog, reducing prices within the U.S. and launches in Europe and China should generate strong growth in 2019. Some investors fear price reductions might lead to lower gross margins. When I followed PC stocks on Wall Street, this was a constant question. My answer is the same as what proved true there: strong opportunity for continuous cost reduction should enable gross margins to remain in the 20-25% range in any location that is at volume production. So, perhaps the Chinese Giga-Factory and a future European factory will start at lower margins while volume ramps but expect margins in the U.S. (the bulk of revenue in 2019) to remain in the targeted range. Higher prices in Europe and China due to massive initial demand allows premium pricing which may keep margins close to 20%+ in each.

Facebook stock will outpace the market (it closed last year at $131/share).

Facebook underperformed in 2018, closing the year down 28% despite revenue growth that should be 35% to 40% and EPS tracking to about 36% growth (despite a massive increase in SG&A to spur future results).  The stock reacted to the plethora of criticism regarding privacy of user information coupled with the continuing charges of Russian use of Facebook to impact the election. Before the wave of negative publicity, Facebook reached a high of $218/share in July. Facebook is likely to continue to increase its spending to address privacy issues and to burnish its image. However, scaling revenue could mean it keeps operating margins at a comparable level to 2018 rather than increasing them. Rumors of Facebook’s demise seem highly exaggerated!  According to a December 2018 JP Morgan survey of U.S. Internet users, the three most used social media products were Facebook (88% of participants), Facebook Messenger (61%) and Instagram (47%). Also, 82% of those surveyed picked a Facebook-owned platform as being the most important to them. Finally, the average Facebook user reported checking Facebook roughly 5 times per day with 56% of users spending 15 minutes to an hour or more on the platform on an average day. While Facebook has experienced a minor decrease in overall usage, Instagram usage has increased dramatically. Facebook, Instagram, and WhatsApp together give the company a growing and dominant position.

At the beginning of 2018 Facebook stock was trading at 34 times trailing EPS. By the end of the year the multiple of trailing EPS was below 18. If I assume EPS can grow 20%+ in 2019 (which is below my expectation but higher than the consensus forecast) than a multiple of 20 would put the stock at about $180/share by December 31. If it grew EPS, more in line with revenue and/or returned to a multiple closer to 34 it could reach well over 200.

Two key factors:

  1. A 20% increase in revenue (I expect the increase to be about 30%) adds over $11 billion in revenue. A comparable 20% increase in SG&A would provide over $4 billion in additional money to spend, affording the company ample dollars to devote to incremental marketing without impacting operating margins.
  2. Given the “low” stock price, Facebook increased its buyback program by $9 billion to $15 billion. Since it generates $6B – $7B in cash per quarter from operations (before capex) and has roughly $40 billion in cash and equivalents it could easily increase this further if the stock remains weak. The $15 billion could reduce the share count by as much as 3% in turn increasing EPS by a similar amount.

Amazon stock will outpace the market (it closed last year at $1502/share).

While its stock dropped from its September high of $2050, Amazon remained one of the best market performers in 2018 closing the year at $1502/share. At its 2018 high of $2050, It may have gotten ahead of itself, but at year end it was up less than 2018 revenue growth. Leveraging increased scale meant net income grew faster than revenue and is likely to triple from 2017. Growth will be lower in Q4 then Q3 as Q4 2017 was the first quarter that included all revenue from Whole Foods. Still, I would not be surprised if Amazon beat expectations in Q4 since this is already factored into analyst forecasts. Amazon trades on revenue coupled with the prospect of increasingly mining the revenue into higher profits. But the company will always prioritize making long term investments over maximizing near term earnings. Growth in the core ecommerce business is likely to gradually slow, but Amazon has created numerous revenue streams like its cloud and echo/Alexa businesses that I expect to result in maintaining revenue growth in the 20% plus range in 2019. The prospect of competing with an efficient new brick and mortar offering (see prediction 6 in this post) could drive new excitement around the stock.

Profitability in 2019 could be reduced by: announced salary increases to low end workers; increasing the number of physical store locations; and greater marketing incentives for customers. Offsets to this include higher growth in stronger margin businesses like AWS and subscription services. The stock may gyrate a bit, but I expect it to continue to outperform.

Stitch Fix stock will outpace the market (it closed last year at $17/share).

In my 2018 forecast I called this my riskiest pick and it was the most volatile which is saying a lot given the turbulence experience by Facebook, Tesla, and Amazon. I was feeling pretty smug when the stock reached a high of $52/share in September! I’m not sure how much of the subsequent drop was due to VCs and other early investors reducing their positions but this can have an impact on newly minted public companies. Whatever the case, the stock dropped from September’s high to a low point of $17.09 by year’s end. The drop was despite the company doing a good job balancing growth and profitability with October quarter revenue up 24% and earnings at $10.7 million up from $1.3 million in the prior year. Both beat analyst expectations. The stock was impacted because the number of users grew 22% (1-2% less than expected) despite revenue exceeding expectations at 24% growth. I’m not sure why this was an issue.

Stitch Fix continues to add higher-end brands and to increase its reach into men, plus sizes and kids. Its algorithms to personalize each box of clothes it ships keeps improving. Therefore, the company can spend less on acquiring new customers as it has increased its ability to get existing customers to spend more and come back more often. I believe the company can grow by roughly 20% or more in 2019. If it does and achieves anything close to the revenue multiple that it started with in 2018 (before the multiple doubled in mid-year), there would be a sizeable stock gain this year. But it is a thinly traded stock and likely to be quite volatile.

Docusign Stock will outpace the market in 2019 (it is currently at $43/share).

Docusign is a new recommendation. Like Stitch Fix, it is a recent IPO and could be volatile. Docusign is the runaway leader in e-signatures, facilitating multiple parties signing documents in a secure, reliable way on board resolutions, mortgages, investment documents, etc. Strong positives include:

  • A high value for a reasonable price – I am increasingly annoyed when I need to deal with manual signatures for documents.
  • As of October 31, 2018, Docusign had over 450,000 customers up from 350,000 customers one year earlier. Of which 50,000 are Enterprise/Commercial accounts;
  • There are hundreds of millions of users whose e-signatures are stored by the company making the network effect quite large;
  • Roughly 95% of revenue is from its SaaS product which has 80% gross margin with the rest from services where margins have improved and are now positive;
  • As a SaaS company with a stable revenue base growth is more predictable. The company exceeded revenue guidance each quarter with the October 31, 2018 quarter revenue up 37%;
  • Most customers pay annually in advance. This means cash flow from operations is positive despite the company recording an operating loss;
  • Customers expand their use resulting in retained customers growing revenue faster than decreases from churned customers making net revenue retention over 100%;
  • International expansion remains a large opportunity as international is only 18% of revenue.

Picks 6 – 10: Major Trends that will surface in 2019

I developed my primary method of stock picking at my first Wall Street firm, Stanford Bernstein. The head of research there, Chuck Cahn, emphasized that you could get small wins by correctly determining that a stock would trade up on certain news like a new product, a big customer win, and beating consensus forecasts. But larger and more predictable wins of 5X or more were possible if one identified a long-term winner riding a major trend and stuck with it for multiple years. All 5 of my stock picks fall into the latter category. I’ve been recommending Facebook, Tesla, and Amazon for 4 years or more. All 3 are now over 5X from when I first targeted them as I bought Tesla at $46 and Facebook at $24 in 2013 (before this blog) and they have been in my top 10 since. Amazon was first included in 2015 when it was at $288/share. Stitch Fix and DocuSign are riskier but if successful have substantial upside since both are early in their run of leveraging their key trends.

The next 4 picks are in early stages of trends that could lead to current and next generation companies experiencing benefits for many years. The first two go hand in hand as each describes transformation of physical retail/restaurants, namely, replacing staff with technology in a way that improves the customer experience. This is possible because we are getting closer to the tipping point where the front-end investment in technology can have a solid ROI from subsequent cost savings.

Replacing Cashiers with technology will be proven out in 2019

In October 2015 I predicted that Amazon (and others like Warby Parker) would move into physical retail between then and 2020. This has occurred with Amazon first opening bookstores and then buying Whole Foods, and Warby Parker expanding its number of physical locations to about 100 by the end of 2018. My reasoning then was simple: over 92% of purchases in the U.S. were made offline. Since Amazon had substantial share of e-commerce it would begin to have its growth limited if it didn’t create an off-line presence.

Now, for Amazon to maintain a 20% or greater revenue growth rate it’s even more important for it to increase its attack on offline commerce (now about 90% of U.S. retail) I’m not saying it won’t continue to try to increase its 50% share of online but at its current size offline offers a greater opportunity for growth.

A key to Amazon’s success has been its ability to attack new markets in ways that give it a competitive advantage. Examples of this are numerous but three of the most striking are Amazon Cloud Services (where it is the industry leader), the Kindle (allowing it to own 70% share of eBook sales) and Prime (converting millions of customers to a subscription which in turn incentivized buying more from Amazon due to free shipping).

Now the company is testing an effort to transform brick and mortar retail by replacing staff with technology and in doing so improving the buying experience. The format is called Go stores and there are currently 5 test locations. Downloading the Amazon Go App enables the user to use it to open the automated doors. The store is stocked (I think by actual people) with many of the same categories of products as a 7-Eleven, in a more modern way. Food items include La Boulangerie pastries, sushi, salads, an assortment of sandwiches and even meal kits. Like a 7-Eleven, it also has convenience items like cold medicine, aspirins, etc. The store uses cameras and sensors to track your movements, items you remove from the shelves and even whether you put an item back. When you leave, the app provides you with a digital receipt. Not only does the removal of cashiers save Amazon money but the system improves customer service by eliminating any need to wait in line. I expect Amazon to open thousands of these stores over the next 3-5 years as it perfects the concept. In the future I believe it will have locations that offer different types of inventory. While Amazon may be an early experimenter here, there is opportunity for others to offer similar locations relying on third party technology.

Replacing Cooks, Baristas and Waitstaff with robots will begin to be proven in 2019

The second step in reducing physical location staff will accelerate in 2019. There are already:

  1. Robotic coffee bars:  CafeX opened in San Francisco last year, and in them one orders drip coffee, cappuccino, latte, or hot chocolate using an app on your phone or an iPad available at a kiosk. The coffee is made and served by a robot “barista” with the charge automatically put on your credit card. Ordering, billing, and preparation are automatic, but there is still one staff member in the shop to make sure things go smoothly.
  2. The first robotic burger restaurant: Creator opened in San Francisco last June. It was in beta mode through September before opening to the general public. While a “robot” makes the burgers, Creator is not as automated as CafeX as humans prepare the sauces and prep the items that go into the machine. Creator also hasn’t automated ordering/payment. Startup Momentum Machines expects to open a robotic burger restaurant and has gotten substantial backing from well-known VCs.
  3. Robots replacing waitstaff: For example, at Robo Sushi in Toronto, a “Butlertron” escorts you to your table, you order via an iPad and a second robot delivers your meal. Unlike the robots in the coffee bar and burger restaurant these are made into cute characters rather than a machine. Several Japanese companies are investing in robotic machines that make several of the items offered at a sushi restaurant.
  4. Robotic Pizza restaurants: The furthest along in automation is the Pizza industry. Zume Pizza, a startup that uses robots to make pizzas, has recently received a $375 million investment from Softbank. Zume currently uses a mix of humans and robots to create and deliver their pizzas and is operational in the Bay Area. Pizza Hut and Dominos are working on drones and/or self-driving vehicles to deliver pizzas. And Little Caesars was just issued a patent for a robotic arm and other automated mechanisms used to create a pizza.

At CES, a robot that makes breads was announced. What all these have in common is replacing low end high turnover employees with technology for repetitive tasks. The cost of labor continues to rise while the cost of technology shrinks a la Moore’s Law. It is just a matter of time before these early experiments turn into a flood of change. I expect many of these experiments will turn into “proof points” in 2019. Successful experiments will generate substantial adoption in subsequent years. Opportunities exist to invest in both suppliers and users of many robotic technologies.

“Influencers” will be increasingly utilized to directly drive Commerce

Companies have long employed Influencers as spokespersons for products and in some cases even as brands (a la Michael Jordon and Stephan Curry basketball shoes or George Forman Grills). They appear on TV ads for products and sometimes used their social reach to tout them. Blogger, a prior Azure investment, understood how to use popular bloggers in advertising campaigns. But Blogger ads, like most TV ads did not directly offer the products to potential customers. Now we are on the verge of two major changes: tech players creating structured ways to enable fans of major influencers (with millions of followers) to use one-click to directly buy products; and technology companies that can economically harness the cumulative power of hundreds of micro-influencers (tens of thousands of fans) to replicate the reach of a major influencer. I expect to see strong growth in this method of Social Commerce this year.

The Cannabis Sector should show substantial gains in 2019

In my last post I said about the Cannabis Sector: “The industry remains at a very early stage, but numerous companies are now public, and the recent market correction has the shares of most of these at more reasonable levels. While I urge great care in stock selection, it appears that the industry has emerged as one to consider investing in.” Earlier in this post, I mentioned that riding a multi-year wave with a winning company in that segment is a way to have strong returns. I’m not knowledgeable enough regarding public Cannabis companies, so I haven’t included any among my stock recommendations. However, I expect industry wide revenue to grow exponentially. The 12 largest public Cannabis companies by descending market cap are: Canopy Growth Corp (the largest at over $11B), Tilray, Aurora Cannabis, GW Pharmaceuticals, Curealeaf Holdings, Aphria, Green Thumb Industries, Cronos Group, Medmen Enterprises, Acreage Holdings, Charlotte’s Web Holdings and Trulieve Cannabis.

I believe one or more of these will deliver major returns over the next 5 years. Last year I felt we would see good fundamentals from the industry but that stocks were inflated. Given that the North American Cannabis Index opened this year at 208 well down from its 2018 high of 386 investing now seems timely. I’ll use this index as the measure of performance of this pick.

2019 will be the Year of the Unicorn IPO

Many Unicorns went public in 2018, but this year is poised to be considerably larger and could drive the largest IPO market fund raising in at least 5 years.  Disbelievers will say: “the market is way down so companies should wait longer.” The reality is the Nasdaq is off from its all-time high in August by about 15% but is higher than its highest level at any time before 2018. Investment funds are looking for new high growth companies to invest in. It appears very likely that as many as 5 mega-players will go public this year if the market doesn’t trade off from here. Each of them is a huge brand that should have very strong individual support. Institutional investors may not be as optimistic if they are priced too high due to the prices private investors have previously paid. They are: Uber, Lyft, Airbnb, Pinterest, and Slack. Each is one of the dominant participants in a major wave, foreshadowing substantial future revenue growth. Because information has been relatively private, I have less knowledge of their business models so can’t comment on whether I would be a buyer. Assuming several of these have successful IPOs many of the other 300 or so Unicorns may rush to follow.

It will be an interesting year!

Interesting KPIs (Key Performance Indicators) for a Subscription Company

what-are-key-performance-indicators-kpis

In working with early stage businesses, I often get the question as to what metrics should management and the board use to help understand a company’s progress. It is important for every company to establish a set of consistent KPIs that are used to objectively track progress. While these need to be a part of each board package, it is even more important for the executive team to utilize this for managing their company. While this post focuses on SaaS/Subscription companies, the majority of it applies to most other types of businesses.

Areas KPIs Should Cover

  1. P&L Trends
  2. MRR (Monthly Recurring Revenue) and LTR (Lifetime Revenue)
  3. CAC (Cost of Customer Acquisition)
    1. Marketing to create leads
    2. Customers acquired electronically
    3. Customers acquired using sales professionals
  4. Gross Margin and LTV (Life Time Value of a customer)
  5. Marketing Efficiency

Many companies will also need KPIs regarding inventory in addition to the ones above.

While there may be very complex analysis behind some of these numbers, it’s important to try to keep KPIs to 2-5 pages of a board package. Use of the right KPIs will give a solid, objective, consistent top-down view of the company’s progress. The P&L portion of the package is obviously critical, but I have a possibly unique view on how this should be included in the body of a board package.

P&L Trends: Less is More

One mistake many companies make is confusing detail with better analysis. I often see models that have 50-100 line items for expenses and show this by month for 3 or more years out… but show one or no years of history. What this does is waste a great deal of time on predicting things that are inconsequential and controllable (by month), while eliminating all perspective. Things like seasonality are lost if one is unable to view 3 years of revenue at a time without scrolling from page to page. Of course, for the current year’s budget it is appropriate for management to establish monthly expectations in detail, but for any long-term planning, success revolves around revenue, gross margins, marketing/sales spend and the number of employees. For some companies that are deep technology players there may be significant costs in R&D other than payroll, but this is the exception. By using a simple formula for G&A based on the number of employees, the board can apply a sanity check on whether cost estimates in the long-term model will be on target assuming revenue is on target. So why spend excessive time on nits? Aggregating cost frees up time for better understanding how and why revenue will ramp, the relationship between revenue types and gross margin, the cost of acquiring a customer, the lifetime value of a customer and the average spend per employee.

In a similar way, the board is well served by viewing a simple P&L by quarter for 2 prior years plus the current one (with a forecast of remaining quarters). The lines could be:

Table1: P&L by Quarter

A second version of the P&L should be produced for budget comparison purposes. It should have the same rows but have the columns be current period actual, current period budget, year to date (YTD) actual, year to date budget, current full year forecast, budget for the full year.

Table 2: P&L Actual / Budget Comparison

Tracking MRR and LTR

For any SaaS/Subscription company (I’ll simply refer to this as SaaS going forward) MRR growth is the lifeblood of the company with two caveats: excessive churn makes MRR less valuable and excessive cost in growing MRR also leads to deceptive prosperity. More about that further on. MRR should be viewed on a rolling basis. It can be done by quarter for the board but by month for the management team. Doing it by quarter for the board enables seeing a 3-year trend on one page and gives the board sufficient perspective for oversight. Management needs to track this monthly to better manage the business. A relatively simple set of KPIs for each of 12 quarterly periods would be:

Table 3: MRR and Retention

Calculating Life Time Revenue through Cohort Analysis

The detailed method of calculating LTR does not need to be shown in every board package but should be included at least once per year, but calculated monthly for management.

The LTR calculation uses a grid where the columns would be the various Quarterly cohorts, that is all customers that first purchased that quarter (management might also do this using monthly instead of quarterly). This analysis can be applied to non-SaaS companies as well as SaaS entities. The first row would be the number of customers in the cohort. The next row would be the first month’s revenue for the cohort, the next the second months revenue, and so on until reaching 36 months (or whatever number the board prefers for B2B…I prefer 60 months). The next row would be the total for the full period and the final row would be the average Lifetime Revenue, LTR, per member of the cohort.

Table 4: Customer Lifetime Revenue

A second table would replicate the grid but show average per member of the cohort for each month (row). That table allows comparisons of cohorts to see if the average revenue of a newer cohort is getting better or worse than older ones for month 2 or month 6 or month 36, etc.

Table 5: Average Revenue per Cohort

Cohorts that have a full 36 months of data need to be at least 36 months old. What this means is that more recent cohorts will not have a full set of information but still can be used to see what trends have occurred. For example, is the second months average revenue for a current cohort much less than it was for a cohort one year ago? While newer cohorts do not have full sets of monthly revenue data, they still are very relevant in calculating more recent LTR. This can be done by using average monthly declines in sequential months and applying them to cohorts with fewer months of data.

Customer Acquisition Cost (CAC)

Calculating CAC is done in a variety of ways and is quite different for customers acquired electronically versus those obtained by a sales force.  Many companies I’ve seen have a combination of the two.

Marketing used to generate leads should always be considered part of CAC. The marketing cost in a month first is divided by the number of leads to generate a cost/lead. The next step is to estimate the conversion rate of leads to customers. A simple table would be as follows:

Table 6: Customer Acquisition Costs

table 6.1

For an eCommerce company, the additional cost to convert might be one free month of product or a heavily subsidized price for the first month. If the customer is getting the item before becoming a regular paying customer than the CAC would be:

CAC = MCTC / the percent that converts from the promotional trial to a paying customer.

CAC when a Sales Force is Involved

For many eCommerce companies and B2B companies that sell electronically, marketing is the primary cost involved in acquiring a paying customer. For those utilizing a sales force, the marketing expense plus the sales expense must be accumulated to determine CAC.

Typically, what this means is steps 1 through 3 above would still be used to determine CPL, but step 1 above might include marketing personnel used to generate leads plus external marketing spend:

  1. CPL (cost per lead) as above
  2. Sales Cost = current month’s cost of the sales force including T&E
  3. New Customers in the month = NC
  4. Conversion Rate to Customer = NC/number of leads= Y%
  5. CAC = CPL/Y% + (Sales Cost)/NC

There are many nuances ignored in the simple method shown. For example, some leads may take many months to close. Some may go through a pilot before closing. Therefore, there are more sophisticated methods of calculating CAC but using this method would begin the process of understanding an important indicator of efficiency of customer acquisition.

Gross Margin (GM) is a Critical Part of the Equation

While revenue is obviously an important measure of success, not all revenue is the same. Revenue that generates 90% gross margin is a lot more valuable per dollar than revenue that generates 15% gross margin. When measuring a company’s potential for future success it’s important to understand what level of revenue is required to reach profitability. A first step is understanding how gross margin may evolve. When a business scales there are many opportunities to improve margins:

  • Larger volumes may lead to larger discounts from suppliers
  • Larger volumes for products that are software/content may lower the hosting cost as a percent of revenue
  • Shipping to a larger number of customers may allow opening additional distribution centers (DCs) to facilitate serving customers from a DC closer to their location lowering shipping cost
  • Larger volumes may mean improved efficiency in the warehouse. For example, it may make more automation cost effective

When forecasting gross margin, it is important to be cautious in predicting some of these savings. The board should question radical changes in GM in the forecast. Certain efficiencies should be seen in a quarterly trend, and a marked improvement from the trend needs to be justified. The more significant jump in GM from a second DC can be calculated by looking at the change in shipping rates for customers that will be serviced from the new DC vs what rates are for these customers from the existing one.

Calculating LTV (Lifetime Value)

Gross Margin, by itself may be off as a measure of variable profits of a customer. If payment is by credit card, then the credit card cost per customer is part of variable costs. Some companies do not include shipping charges as part of cost of goods, but they should always be part of variable cost. Customer service cost is typically another cost that rises in proportion to the number of customers. So:

Variable cost = Cost of Goods sold plus any cost that varies directly with sales

Variable Profit = Revenue – Variable Cost

Variable Profit% (VP%) = (Variable Profit)/Revenue

LTV = LTR x VP%

The calculation of VP% should be based on current numbers as they will apply going forward. Determining a company’s marketing efficiency requires comparing LTV to the cost of customer acquisition. As mentioned earlier in the post, if the CAC is too large a proportion of LTV, a company may be showing deceptive (profitless) growth. So, the next set of KPIs address marketing efficiency.

Marketing Efficiency

It does not make sense to invest in an inefficient company as they will burn through capital at a rapid rate and will find it difficult to become profitable. A key measure of efficiency is the relationship between LTV and CAC or LTV/CAC. Essentially this is how many dollars of variable profit the company will make for every dollar it spends on marketing and sales. A ratio of 5 or more usually means the company is efficient. The period used for calculating LTR will influence this number. Since churn tends to be much lower for B2B companies, 5 years is often used to calculate LTR and LTV. But, using 5 years means waiting longer to receive resulting profits and can obscure cash flow implications of slower recovery of CAC. So, a second metric important to understand burn is how long it takes to recover CAC:

CAC Recovery Time = number of months until variable profit equals the CAC

The longer the CAC recovery time, the more capital required to finance growth. Of course, existing customers are also contributing to the month’s revenue alongside new customers. So, another interesting KPI is contribution margin which measures the current state of balance between marketing/sales and Variable Profits:

Contribution Margin = Variable Profits – Sales and Marketing Cost

Early on this number will be negative as there aren’t enough older customers to cover the investment in new ones. But eventually the contribution margin in a month needs to turn positive. To reach profitability it needs to exceed all other costs of the business (G&A, R&D, etc.). By reducing a month’s marketing cost, a company can improve contribution margin that month at the expense of sequential growth… which is why this is a balancing act.

I realize this post is long but wanted to include a substantial portion of KPIs in one post. However, I’ll leave more detailed measurement of sales force productivity and deeper analysis of several of the KPIs discussed here for one or more future posts.

Soundbytes

I’ll begin by apologizing for a midyear brag, but I always tell others to enjoy success and therefore am about to do that myself. In my top ten predictions for 2018 I included a market prediction and 4 stock predictions. I was feeling pretty good that they were all working well when I started to create this post. However, the stock prices for high growth stocks can experience serious shifts in very short periods. Facebook and Tesla both had (what I consider) minor shortfalls against expectations in the 10 days since and have subsequently declined quite a bit in that period. But given the strength of my other two recommendations, Amazon and Stitchfix, the four still have an average gain of 15% as of July 27. Since I’ve only felt comfortable predicting the market when it was easy (after 9/11 and after the 2008 mortgage blowup), I was nervous about predicting the S&P would be up this year as it was a closer call and was somewhat controversial given the length of the bull market prior to this year. But it seemed obvious that the new tax law would be very positive for corporate earnings. So, I thought the S&P would be up despite the likelihood of rising interest rates. So far, it is ahead 4.4% year to date driven by stronger earnings. Since I always fear that my record of annual wins can’t continue I wanted to take a midyear victory lap just in case everything collapses in the second half of the year (which I don’t expect but always fear). So I continue to hold all 4 stocks and in fact bought a bit more Facebook today.

Highlights From the 2018 Azure CEO Summit

It’s All About the Network

On June 13th, 2018, Azure held our 12th Annual CEO Summit, hosted at the Citrix Templeton Conference Center. Success for our companies is typically predicated on the breadth and depth of their networks in Silicon Valley and beyond. This event is a cornerstone of how we support this, providing a highly curated, facilitated opportunity to expand connections for business development, fund-raising, and strategic partner dialogue. It is also an opportunity for our portfolio companies to develop strong relationships with our investors, networks, and among each other, which provides business partnership opportunities, potential future investors and is a first step towards engaging with future acquirers. An incidental benefit to Azure is that the appeal of the event also leads to expansion of our own network.

Throughout the day, we had participation of nearly 70 corporate entities, venture funds and financial institutions, including Amazon, Google, Apple, P&G, Citrix, Ericsson, Intel, Microsoft, Oracle, Trinet, Arcserv, Citibank, SVB, and UBS, in addition to 28 of Azure’s portfolio companies, and six Canadian startups which were invited as part of Azure’s Canada-Bridge initiative. The Canadian companies were selected from a group of about 100 nominated by Canadian VCs. At the event, the six winners gained access to Azure’s Silicon Valley network not only through participation along with our portfolio CEOs in the approximately 370 one-on-one meetings we arranged but also through networking opportunities throughout the rest of the day and into the evening.

Nearly all the Azure portfolio companies participating gave demo-day style presentations to the full audience, which expanded the reach of their message beyond the more intimate one-on-one meetings.

Visionary Keynote Speakers

Azure was quite fortunate in once again having several visionary keynote speakers who provided inspiration and thought-provoking inputs from their experiences as highly successful entrepreneurs and investors.

The first was David Ko, currently President and COO, Rally Health, and formerly SVP, Yahoo and COO, Zynga (famous for Farmville which peaked at 34.5 million daily active users). David provided his vision for the consumer-focused future for managing health and shared lessons learned from his journeys both in taking Zynga public and in leading Rally Health as it has grown in eight years from a company with low single-digit millions in revenue to more than a billion in revenue. Rally works with more than 200,000 employers to help drive employee engagement in their health. Accessible to more than 35 million people, Rally’s digital platform and solutions help people adopt healthier lifestyles, select health benefits, and choose the best doctor at the right price for their needs. The company’s wellness solution focuses on four key areas to improve health: nutrition, exercise, stress reduction and preventive health. Given the astronomical increase in the portion of U.S. GDP spent on healthcare, David pointed out how critical it is to help individuals improve their “wellness” tactics. He believes this is one of the waves of the future to curb further acceleration of healthcare cost.

Shai Agassi, Former President, Product and Technology Group, SAP, and former CEO, Better Place responded to questions posed by me and the audience during a fireside chat.  Shai first shared his experience of building a business that successfully became integrated into SAP, but the heart of his session revolved around his perspectives on the evolution of the electric car and the future emergence of (safe) automated vehicles. He painted a vivid picture of what the oncoming transition to a new generation of vehicles means for the future, where automated, electric cars will become the norm (in 5-10 years). As a result, he believes people will reduce their use of their own cars and instead, use an “automated Uber-like service” for much of their transportation. In such a world, many people won’t own a car and for those that do, their autos will have much longer useful lives thereby reducing the need to replace cars with the same frequency. If he proves correct, this would clearly have major ramifications for auto manufacturers and the oil industry.

Our final keynote speaker was Ron Suber, President Emeritus, Prosper Marketplace, who is referred to as “The Godfather of Fintech”.  Ron shared with us his perspective that we’re at the beginning stages of the ‘Golden Age of Fintech’ which he believes will be a 20-year cycle. He expects to continue to see a migration to digital, accessible platforms driven by innovation by existing players and new entrants to the market that will disrupt the incumbents. What must be scary to incumbents is that the new entrants in fintech include tech behemoths like Paypal, Google, Amazon, Tencent (owner of WeChat), Facebook and Apple.  While traditional banks may have access to several hundred million customers, these players can leverage their existing reach into relationships with billions of potential customers. For example,  WeChat and Instagram have both recently surpassed one billion users. With digital/mobile purchasing continuing to gain market share, a player like Apple can nearly force its users to include Apple Pay as one of their apps giving Apple some unique competitive advantages. Amazon and WeChat (in China) are in a strong position to leverage their user bases.

All That Plus a Great Dinner

After an action packed daytime agenda, the Summit concluded with a casual cocktail hour and outdoor dinner in Atherton. Most attendees joined, and additional members of the Azure network were invited as well. The dinner enabled significant networking to continue and provided an additional forum for some who were not able to be at the daytime event to meet some of our portfolio executives.

The Bottom Line – It’s About Results

How do we measure the success of the Summit? We consider it successful if several of our companies garner potential investors, strike business development deals, etc.  As I write this, only nine days after the event, we already know of a number of investment follow-ups, more than ten business-development deals being discussed, and multiple debt financing conversations. Investment banks and corporate players have increased awareness of the quality of numerous companies who presented. Needless to say, Azure is pleased with the bottom line.

The Valuation Bible – Part 2: Applying the Rules to Tesla and Creating an Adjusted Valuation Method for Startups

This post is part 2 of our valuation discussion (see this post for part 1).  As I write this post Tesla’s market cap is about $56 billion. I thought it would be interesting to show how the rules discussed in the first post apply to Tesla, and then to take it a step further for startups.

Revenue and Revenue Growth

Revenue for Tesla in 2017 was $11.8 billion, about 68% higher than 2016, and it is likely to grow faster this year given the over $20 billion in pre-orders (and growing) for the model 3 coupled with continued strong demand for the model S and model X. Since it is unclear when the new sports car or truck will ship, I assume no revenue in those categories. As long as Tesla can increase production at the pace they expect, I estimate 2018 revenue will be up 80% – 120% over 2017, with Q4 year over year growth at or above 120%.

If I’m correct on Tesla revenue growth, its 2018 revenue will exceed $20 billion. So, Rule Number 1 from the prior post indicates that Tesla’s high growth rates should merit a higher “theoretical PE” than the S&P (by at least 4X if one believes that growth will continue at elevated rates).

Calculating TPE

Tesla gross margins have varied a bit while ramping production for each new model, but in the 16 quarters from Q1, 2014 to Q4, 2017 gross margin averaged 23% and was above 25%, 6 of the 16 quarters. Given that Tesla is still a relatively young company it appears likely margins will increase with scale, leading me to believe that long term gross margins are very likely to be above 25%. While it will dip during the early production ramp of the model 3, 25% seems like the lowest percent to use for long term modeling and I expect it to rise to between 27% and 30% with higher production volumes and newer factory technology.

Tesla recognizes substantial cost based on stock-based compensation (which partly occurs due to the steep rise in the stock). Most professional investors ignore artificial expenses like stock-based compensation, as I will for modeling purposes, and refer to the actual cost as net SG&A and net R&D. Given that Tesla does not pay commissions and has increased its sales footprint substantially in advance of the roll-out of the model 3, I believe Net SG&A and Net R&D will each increase at a much slower pace than revenue. If they each rise 20% by Q4 of this year and revenue is at or exceeds $20 billion, this would put their total at below 20% of revenue by Q4. Since they should decline further as a percent of revenue as the company matures, I am assuming 27% gross margin and 18% operating cost as the base case for long term operating profit. While this gross margin level is well above traditional auto manufacturers, it seems in line as Tesla does not have independent dealerships (who buy vehicles at a discount) and does not discount its cars at the end of each model year.

Estimated TPE

Table 1 provides the above as the base case for long term operating profit. To provide perspective on the Tesla opportunity, Table 1 also shows a low-end case (25% GM and 20% operating cost) and a high-end profit case (30% GM and 16% operating cost).  Recall, theoretic earnings are derived from applying the mature operating profit level to trailing and to forward revenue. For calculating theoretic earnings, I will ignore interest payments and net tax loss carry forwards as they appear to be a wash over the next 5 years. Finally, to derive the Theoretic Net Earnings Percent a potential mature tax rate needs to be applied. I am using 20% for each model case which gives little credit for tax optimization techniques that could be deployed. That would make theoretic earnings for 2017 and 2018 $0.85 billion and $1.51 billion, respectively and leads to:

  • 2017 TPE=$ 56.1 billion/$0.85 = 66.0
  • 2018 TPE= $ 56.1 billion/1.51 = 37.1

The S&P trailing P/E is 25.5 and forward P/E is about 19X. Based on our analysis of the correlation between growth and P/E provided in the prior post, Tesla should be trading at a minimum of 4X the trailing S&P ratio (or 102 TP/E) and at least 3.5X S&P forward P/E (or 66.5 TP/E). To me that shows that the current valuation of Tesla does not appear out of market.  If the market stays at current P/E levels and Tesla reaches $21B in revenue in 2018 this indicates that there is strong upside for the stock.

Table 1: Tesla TPE 2017 & 2018

The question is whether Tesla can continue to grow revenue at high rates for several years. Currently Tesla has about 2.4% share of the luxury car market giving it ample room to grow that share. At the same time, it is entering the much larger medium-priced market with the launch of the Model 3 and expects to produce vehicles in other categories over the next few years. Worldwide sales of new cars for the auto market is about 90 million in 2017 and growing about 5% a year. Tesla is the leader in several forward trends: electric vehicles, automated vehicles and technology within a car. Plus, it has a superior business model as well. If it reaches $21 billion in revenue in 2018, its share of the worldwide market would be about 0.3%. It appears poised to continue to gain share over the next 3-5 years, especially as it fills out its line of product.  Given that it has achieved a 2.4% share of the market it currently plays in, one could speculate that it could get to a similar share in other categories. Even achieving a 1% share of the worldwide market in 5 years would mean about 40% compound growth between 2018 and 2022 and imply a 75X-90X TP/E at the end of this year.

The Bear Case

I would be remiss if I omitted the risks that those negative on the stock point out. Tesla is a very controversial stock for a variety of reasons:

  1. Gross Margin has been volatile as it adds new production facilities so ‘Bears’ argue that even my 25% low case is optimistic, especially as tax rebate subsidies go away
  2. It has consistently lost money so some say it will never reach the mature case I have outlined
  3. As others produce better electric cars Tesla’s market share of electric vehicles will decline so high revenue growth is not sustainable
  4. Companies like Google have better automated technology that they will license to other manufacturers leading to a leap frog of Tesla

As they say, “beauty is in the eyes of the beholder” and I believe my base case is realistic…but not without risk. In response to the bear case that Tesla revenue growth can’t continue, it is important to recognize that Tesla already has the backlog and order momentum to drive very high growth for the next two years. Past that, growing market share over the 4 subsequent years to 1% (a fraction of their current share of the luxury market) would generate compound annual growth of 40% for that 4-year period. In my opinion, the biggest risk is Tesla’s own execution in ramping production. Bears will also argue that Tesla will never reach the operating margins of my base case for a variety of reasons. This is the weakness of the TPE approach: it depends on assumptions that have yet to be proven. I’m comfortable when my assumptions depend on momentum that is already there, gross margin proof points and likelihood that scale will drive operating margin improvements without any radical change to the business model.

Applying the rules to Startups

As a VC I am often in the position of helping advise companies regarding valuation. This occurs when they are negotiating a round of financing or in an M&A situation.  Because the companies are even earlier than Tesla, theoretic earnings are a bit more difficult to establish. Some investors ignore the growth rates of companies and look for comps in the same business. The problem with the comparable approach is that by selecting companies in the same business, the comps are often very slow growth companies that do not merit a high multiple. For example, comparing Tesla to GM or Ford to me seems a bit ludicrous when Tesla’s revenue grew 68% last year and is expected to grow even faster this year while Ford and GM are growing their revenue at rates below 5%. It would be similar if investors compared Apple (in the early days of the iPhone) to Nokia, a company it was obsoleting.

Investors look for proxies to use that best correlate to what future earnings will be and often settle on a multiple of revenue. As Table 2 shows, there is a correlation between valuation as a multiple of revenue and revenue growth regardless of what industry the companies are in. This correlation is closer than one would find by comparing high growth companies to their older industry peers.

Table 2: Multiple of Revenue and Revenue Growth

However, using revenue as the proxy for future earnings suffers from a wide variety of issues. Some companies have 90% or greater gross margins like our portfolio company Education.com, while others have very low gross margins of 10% – 20%, like Spotify. It is very likely that the former will generate much higher earnings as a percent of revenue than the latter. In fact, Education.com is already cash flow positive at a relatively modest revenue level (in the low double-digit millions) while Spotify continues to lose a considerable amount of money at billions of dollars in revenue. Notice, this method also implies that Tesla should be valued about 60% higher than its current market price.

This leads me to believe a better proxy for earnings is gross margin as it is more closely correlated with earnings levels. It also removes the issue of how revenue is recognized and is much easier to analyze than TPE. For example, Uber recognizing gross revenue or net revenue has no impact on gross margin dollars but would radically change its price to revenue. Table 3 uses the same companies as Table 2 but shows their multiple of gross margin dollars relative to revenue growth. Looking at the two graphs, one can see how much more closely this correlates to the valuation of public companies. The correlation coefficient improves from 0.36 for the revenue multiple to 0.62 for the gross margin multiple.

Table 3: Multiple of Gross Margin vs. Revenue Growth

So, when evaluating a round of financing for a pre-profit company the gross margin multiple as it relates to growth should be considered. For example, while there are many other factors to consider, the formula implies that a 40% revenue growth company should have a valuation of about 14X trailing gross margin dollars.  Typically, I would expect that an earlier stage company’s mature gross margin percent would likely increase. But they also should receive some discount from this analysis as its risk profile is higher than the public companies shown here.

Notice that the price to sales graph indicates Tesla should be selling at 60% more than its multiple of 5X revenue. On the other hand, our low-end case for Tesla Gross Margin, 25%, puts Tesla at 20X Gross Margin dollars, just slightly undervalued based on where the least square line in Table 3 indicates it should be valued.

How much do you know about SEO?

Search Engine Optimization: A step by step process recommended by experts

Azure just completed its annual ecommerce marketing day. It was attended by 15 of our portfolio companies, two high level executives at major corporations, a very strong SEO consultant and the Azure team. The purpose of the day is to help the CMOs in the Azure portfolio gain a broader perspective on hot marketing topics and share ideas and best practices. This year’s agenda included the following sessions:

  1. Working with QVC/HSN
  2. Brand building
  3. Using TV, radio and/or podcasts for marketing
  4. Techniques to improve email marketing
  5. Measuring and improving email marketing effectiveness
  6. Storytelling to build your brand and drive marketing success
  7. Working with celebrities, brands, popular YouTube personalities, etc.
  8. Optimizing SEO
  9. Product Listing Ads (PLAs) and Search Engine Marketing (SEM)

One pleasant aspect of the day is that it generated quite a few interesting ideas for blog posts! In other words, I learned a lot regarding the topics covered. This post is on an area many of you may believe you know well, Search Engine Optimization (SEO). I thought I knew it well too… before being exposed to a superstar consultant, Allison Lantz, who provided a cutting-edge presentation on the topic. With her permission, this post borrows freely from her content. Of course, I’ve added my own ideas in places and may have introduced some errors in thinking, and a short post can only touch on a few areas and is not a substitute for true expertise.

SEO is Not Free if You Want to Optimize

I have sometimes labeled SEO as a free source of visitors to a site, but Allison correctly points out that if you want to focus on Optimization (the O in SEO) with the search engines, then it isn’t free, but rather an ongoing process (and investment) that should be part of company culture. The good news is that SEO likely will generate high quality traffic that lasts for years and leads to a high ROI against the cost of striving to optimize. All content creators should be trained to write in a manner that optimizes generating traffic by using targeted key words in their content and ensuring these words appear in the places that are optimal for search. To be clear, it’s also best if the content is relevant, well written and user-friendly. If you were planning to create the content anyway, then the cost of doing this is relatively minor. However, if the content is incremental to achieve higher SEO rankings, then the cost will be greater. But I’m getting ahead of myself and need to review the step by step process Allison recommends to move towards optimization.

Keyword Research

The first thing to know when developing an SEO Strategy is what you are targeting to optimize. Anyone doing a search enters a word or phrase they are searching for. Each such word or phrase is called a ‘keyword’. If you want to gain more users through SEO, it’s critical to identify thousands, tens of thousands or even hundreds of thousands of keywords that are relevant to your site. For a fashion site, these could be brands, styles, and designers. For an educational site like Education.com (an Azure portfolio company that is quite strong in SEO and ranks on over 600,000 keywords) keywords might be math, english, multiplication, etc. The broader the keywords, the greater the likelihood of higher volume.  But along with that comes more competition for search rankings and a higher cost per keyword. The first step in the process is spending time brainstorming what combinations of words are relevant to your site – in other words if someone searched for that specific combination would your site be very relevant to them? To give you an idea of why the number gets very high, consider again Education.com. Going beyond searching on “math”, one can divide math into arithmetic, algebra, geometry, calculus, etc. Each of these can then be divided further. For example, arithmetic can include multiplication, addition, division, subtraction, exponentiation, fractions and more.  Each of these can be subdivided further with multiplication covering multiplication games, multiplication lesson plans, multiplication worksheets, multiplication quizzes and more.

Ranking Keywords

Once keywords are identified the next step is deciding which ones to focus on. The concept leads to ranking keywords based upon the likely number of clicks to your site that could be generated from each one and the expected value of potential users obtained through these clicks. Doing this requires determining for each keyword:

  • Monthly searches
  • Competition for the keyword
  • Conversion potential
  • Effort (and possible cost) required to achieve a certain ranking

Existing tools report the monthly volume of searches for each keyword (remember to add searches on Bing to those on Google). Estimating the strength of competition requires doing a search using the keyword and learning who the top-ranking sites are currently (given the volume of keywords to analyze, this is very labor intensive). If Amazon is a top site they may be difficult to surpass but if the competition includes relatively minor players, they would be easier to outrank.

The next question to answer for each keyword is: “What is the likelihood of converting someone who is searching on the keyword if they do come to my site”. For example, for Education.com, someone searching on ‘sesame street math games’ might not convert well since they don’t have the license to use Sesame Street characters in their math games. But someone searching on ‘1st grade multiplication worksheets’ would have a high probability of converting since the company is world-class in that area. The other consideration mentioned above is the effort required to achieve a degree of success. If you already have a lot of content relevant to a keyword, then search optimizing that content for the keyword might not be very costly. But, if you currently don’t have any content that is relevant or the keyword is very broad, then a great deal more work might be required.

Example of Keyword Ranking Analysis

Source: Education.com

Comparing Effort Required to Estimated Value of Keywords

Once you have produced the first table, you can make a very educated guess on your possible ranking after about 12 months (the time it may take Google/Bing to recognize your new status for that keyword).

There are known statistics on what the likely click-through rates (share of searches against the keyword) will be if you rank 1st, 2nd, 3rd, etc. Multiplying that by the average search volume for that keyword gives a reasonable estimate of the monthly traffic that this would generate to your site. The next step is to estimate the rate at which you will convert that traffic to members (where they register so you get their email) and/or customers (I’ll assume customers for the rest of this post but the same method would apply to members). Since you already know your existing conversion rate, in general, this could be your estimate. But, if you have been buying clicks on that keyword from Google or Bing, you may already have a better estimate of conversion. Multiplying the number of customers obtained by the LTV (Life Time Value) of a customer yields the $ value generated if the keyword obtains the estimated rank. Subtract from this the current value being obtained from the keyword (based on its current ranking) to see the incremental benefit.

Content Optimization

One important step to improve rankings is to use keywords in titles of articles. While the words to use may seem intuitive, it’s important to test variations to see how each may improve results. Will “free online multiplication games” outperform “free times table games”. The way to test this is by trying each for a different 2-week (or month) time period and see which gives a higher CTR (Click Through Rate). As discussed earlier, it’s also important to optimize the body copy against keywords. Many of our companies create a guide for writing copy that provides rules that result in better CTR.

The Importance of Links

Google views links from other sites to yours as an indication of your level of authority. The more important the site linking to you, the more it impacts Google’s view. Having a larger number of sites linking to you can drive up your Domain Authority (a search engine ranking score) which in turn will benefit rankings across all keywords. However, it’s important to be restrained in acquiring links as those from “Black Hats” (sites Google regards as somewhat bogus) can actually result in getting penalized. While getting another site to link to you will typically require some motivation for them, Allison warns that paying cash for a link is likely to result in obtaining some of them from black hat sites. Instead, motivation can be your featuring an article from the other site, selling goods from a partner, etc.

Other Issues

I won’t review it here but site architecture is also a relevant factor in optimizing SEO benefits. For a product company with tens of thousands of products, it can be extremely important to have the right titles and structure in how you list products. If you have duplicative content on your site, removing it may help your rankings, even if there was a valid reason to have such duplication. Changing the wording of content on a regular basis will help you maintain rankings.

Summary

SEO requires a well-thought-out strategy and consistent, continued execution to produce results. This is not a short-term fix, as an SEO investment will likely only start to show improvements four to six months after implementation with ongoing management. But as many of our portfolio companies can attest, it’s well worth the effort.


SoundBytes

  • It’s a new basketball season so I can’t resist a few comments. First, as much as I am a fan of the Warriors, it’s pretty foolish to view them as a lock to win as winning is very tenuous. For example, in game 5 of the finals last year, had Durant missed his late game three point shot the Warriors may have been facing the threat of a repeat of the 2016 finals – going back to Cleveland for a potential tying game.
  • Now that Russell Westbrook has two star players to accompany him we can see if I am correct that he is less valuable than Curry, who has repeatedly shown the ability to elevate all teammates. This is why I believe that, despite his two MVPs, Curry is under-rated!
  • With Stitchfix filing for an IPO, we are seeing the first of several next generation fashion companies emerging. In the filing, I noted the emphasis they place on SEO as a key component of their success. I believe new fashion startups will continue to exert pressure on traditional players. One Azure company moving towards scale in this domain is Le Tote – keep an eye on them!

When and How to Create a Valuable Marketing Event

Azure CEO Summit
Snapshots from Azure’s 11th Annual CEO Summit

A key marketing tool for companies is to hold an event like a user’s conference or a topical forum to build relationships with their customers and partners, drive additional revenue and/or generate business development opportunities. Azure held its 11th annual CEO Summit last week, and as we’re getting great feedback on the success of the conference, I thought it might be helpful to dig deeply into what makes a conference effective. I will use the Azure event as the example but try to abstract rules and lessons to be learned, as I have been asked for my advice on this topic by other firms and companies.

Step 1. Have a clear set of objectives

For the Azure CEO Summit, our primary objectives are to help our portfolio companies connect with:

  1. Corporate and Business Development executives from relevant companies
  2. Potential investors (VCs and Family Offices)
  3. Investment banks so the companies are on the radar and can get invited to their conferences
  4. Debt providers for those that can use debt as part of their capital structure

A secondary objective of the conference is to build Azure’s brand thereby increasing our deal flow and helping existing and potential investors in Azure understand some of the value we bring to the table.

When I created a Wall Street tech conference in the late 90’s, the objectives were quite different. They still included brand building, but I also wanted our firm to own trading in tech stocks for that week, have our sell side analysts gain reputation and following, help our bankers expand their influence among public companies, and generate a profit for the firm at the same time. We didn’t charge directly for attending but monetized through attendees increasing use of our trading desk and more companies using our firm for investment banking.

When Fortune began creating conferences, their primary objective was to monetize their brand in a new way. This meant charging a hefty price for attending. If people were being asked to pay, the program had to be very strong, which they market quite effectively.

Conferences that have clear objectives, and focus the activities on those objectives, are the most successful.

Step 2. Determine invitees based on who will help achieve those objectives

For our Summit, most of the invitees are a direct fallout from the objectives listed above. If we want to help our portfolio companies connect with the above-mentioned constituencies, we need to invite both our portfolio CEOs and the right players from corporations, VCs, family offices, investment banks and debt providers. To help our brand, inviting our LPs and potential LPs is important. To insure the Summit is at the quality level needed to attract the right attendees we also target getting great speakers.  As suggested by my partners and Andrea Drager, Azure VP (and my collaborator on Soundbytes) we invited several non-Azure Canadian startups. In advance of the summit, we asked Canadian VCs to nominate candidates they thought would be interesting for us and we picked the best 6 to participate in the summit. This led to over 70 interesting companies nominated and added to our deal flow pipeline.

Step 3. Create a program that will attract target attendees to come

This is especially true in the first few years of a conference while you build its reputation. It’s important to realize that your target attendees have many conflicting pulls on their time. You won’t get them to attend just because you want them there! Driving attendance from the right people is a marketing exercise. The first step is understanding what would be attractive to them. In Azure’s case, they might not understand the benefit of meeting our portfolio companies, but they could be very attracted by the right keynotes.

Azure’s 2017 Summit Keynote Speakers: Mark Lavelle, CEO of Magento Commerce & Co-founder of Bill Me Later. Cameron Lester, Managing Director and Co-Head of Global Technology Investment Banking, Jeffries. Nagraj Kashyap, Corporate VP & Global Head, Microsoft Ventures.

Over the years we have had the heads of technology investment banking from Qatalyst, Morgan Stanley, Goldman, JP Morgan and Jeffries as one of our keynote speakers. From the corporate world, we also typically have a CEO, former CEO or chairman of notable companies like Microsoft, Veritas, Citrix, Concur and Audible as a second keynote. Added to these were CEOs of important startups like Stance and Magento and terrific technologists like the head of Microsoft Labs.

Finding the right balance of content, interaction and engagement is challenging, but it should be explicitly tied to meeting the core objectives of the conference.

Step 4. Make sure the program facilitates meeting your objectives

Since Azure’s primary objective is creating connections between our portfolio (and this year, the 6 Canadian companies) with the various other constituencies we invite, we start the day with speed dating one-on-ones of 10 minutes each. Each attendee participating in one-on-ones can be scheduled to meet up to 10 entities between 8:00AM and 9:40. Following that time, we schedule our first keynote.

In addition to participating in the one-on-ones, which start the day, 26 of our portfolio companies had speaking slots at the Summit, intermixed with three compelling keynote speakers. Company slots are scheduled between keynotes to maximize continued participation. This schedule takes us to about 5:00pm. We then invite the participants and additional VCs, lawyers and other important network connections to join us for dinner. The dinner increases everyone’s networking opportunity in a very relaxed environment.

These diverse types of interaction phases throughout the conference (one-on-ones, presentations, discussions, and networking) all facilitate a different type of connection between attendees, focused on maximizing the opportunity for our portfolio companies to build strong connections.

Azure Company Presentations
Azure Portfolio Company CEO Presentations: Chairish, Megabots & Atacama

Step 5. Market the program you create to the target attendees

I get invited to about 30 conferences each year plus another 20-30 events. It’s safe to assume that most of the invitees to the Azure conference get a similar (or greater) number of invitations. What this means is that it’s unlikely that people will attend if you send an invitation but then don’t effectively market the event (especially in the first few years). It is important to make sure every key invitee gets a personal call, email, or other message from an executive walking them through the agenda and highlighting the value to them (link to fortune could also go here). For the Azure event, we highlight the great speakers but also the value of meeting selected portfolio companies. Additionally, one of my partners or I connect with every attendee we want to do one-on-ones with portfolio companies to stress why this benefits them and to give them the chance to alter their one-on-one schedule. This year we managed over 320 such meetings.

When I created the first “Quattrone team” conference on Wall Street, we marketed it as an exclusive event to portfolio managers. While the information exchanged was all public, the portfolio managers still felt they would have an investment edge by being at a smaller event (and we knew the first year’s attendance would be relatively small) where all the important tech companies spoke and did one-on-one meetings. For user conferences, it can help to land a great speaker from one of your customers or from the industry. For example, if General Electric, Google, Microsoft or some similar important entity is a customer, getting them to speak will likely increase attendance. It also may help to have an industry guru as a speaker. If you have the budget, adding an entertainer or other star personality can also add to the attraction, as long as the core agenda is relevant to attendees.

Step 6. Decide on the metrics you will use to measure success

It is important to set targets for what you want to accomplish and then to measure whether you’ve achieved those targets. For Azure, the number of entities that attend (besides our portfolio), the number of one-on-one meetings and the number of follow-ups post the conference that emanate from one-on-one are three of the metrics we measure. One week after the conference, I already know that we had over 320 one-on-ones which, so far, has led to about 50 follow ups that we are aware of including three investments in our portfolio. We expect to learn of additional follow up meetings but this has already exceeded our targets.

Step 7. Make sure the value obtained from the conference exceeds its cost

It is easy to spend money but harder to make sure the benefit of that spend exceeds its cost. On one end of the spectrum, some conferences have profits as one of the objectives. But in many cases, the determination of success is not based on profits, but rather on meeting objectives at a reasonable cost. I’ve already discussed Azure’s objectives but most of you are not VCs. For those of you dealing with customers, your objectives can include:

  1. Signing new customers
  2. Reducing churn of existing customers
  3. Developing a better understanding of how to evolve your product
  4. Strong press pickup / PR opportunity

Spending money on a conference should always be compared to other uses of those marketing dollars. To the degree you can be efficient in managing it, the conference can become a solid way to utilize marketing dollars. Some of the things we do for the Azure conference to control cost which may apply to you include:

  1. Partnering with a technology company to host our conference instead of holding it at a hotel. This only works if there is value to your partner. Cost savings is about 60-70%.
  2. Making sure our keynotes are very relevant but are at no cost. You can succeed at this with keynotes from your customers and/or the industry. Cost savings is whatever you might have paid someone.
  3. Having the dinner for 150 people at my house. This has two benefits: it is a much better experience for those attending and the cost is about 70% less than having it at a venue.

Summary

I have focused on using the Azure CEO Summit as the primary example but the rules laid out apply in general. They not only will help you create a successful conference but following them means only holding it if its value to you exceeds its cost.


SoundBytes

The warriors…

Last June I wrote about why Kevin Durant should join the Warriors

If you look at that post, you’ll see that my logic appears to have been born out, as my main reason was that Durant was likely to win a championship and this would be very instrumental in helping his reputation/legacy.

Not mentioned in that post was the fact that he would also increase his enjoyment of playing, because playing with Curry, Thompson, Green and the rest of the Warriors is optimizing how the game should be played

Now it’s up to both Durant and Curry to agree to less than cap salaries so the core of the team can be kept intact for many years. If they do, and win multiple championships, they’ll probably increase endorsement revenue. But even without that offset my question is “How much is enough?” I believe one can survive nicely on $30-$32 million a year (Why not both agree to identical deals for 4 years, not two?). Trying for the maximum is an illusion that can be self-defeating. The difference will have zero impact on their lives, but will keep players like Iguodala and Livingston with the Warriors, which could have a very positive impact. I’m hoping they can also keep West, Pachulia and McGee as well.

It would also be nice if Durant and Curry got Thompson and Green to provide a handshake agreement that they would follow the Durant/Curry lead on this and sign for the same amount per year when their contracts came up. Or, if Thompson and Green can extend now, to do the extension at equal pay to what Curry and Durant make in the extension years. By having all four at the same salary at the end of the period, the Warriors would be making a powerful statement of how they feel about each other.

Amazon & Whole Foods…

Amazon’s announced acquisition of Whole Foods is very interesting. In a previous post, we predicted that Amazon would open physical stores. Our reasoning was that over 90% of retail revenue still occurs offline and Amazon would want to attack that. I had expected these to be Guide Stores (not carrying inventory but having samples of products). Clearly this acquisition shows that, at least in food, Amazon wants to go even further. I will discuss this in more detail in a future post.

The Business of Theater

Earnest Shackleton

I have become quite interested in analyzing theater, in particular, Broadway and Off-Broadway shows for two reasons:

  1. I’m struck by the fact that revenue for the show Hamilton is shaping up like a Unicorn tech company
  2. My son Matthew is producing a show that is now launching at a NYC theater, and as I have been able to closely observe the 10-year process of it getting to New York, I see many attributes that are consistent with a startup in tech.

Incubation

It is fitting that Matthew’s show, Ernest Shackleton Loves Me, was first incubated at Theatreworks, San Francisco, as it is the primary theater of Silicon Valley. Each year the company hosts a “writer’s retreat” to help incubate new shows. Teams go there for a week to work on the shows, all expenses paid. Theatreworks supplies actors, musicians, and support so the creators can see how songs and scenes seem to work (or not) when performed. Show creators exchange ideas much like what happens at a tech incubator. At the culmination of the week, a part of each show is performed before a live audience to get feedback.

Creation of the Beta Version

After attending the writer’s retreat the creators of Shackleton needed to do two things: find a producer (like a VC, a Producer is a backer of the show that recruits others to help finance the project); and add other key players to the team – a book writer, director, actors, etc. Recruiting strong players for each of these positions doesn’t guarantee success but certainly increases the probability. In the case of Shackleton, Matthew came on as lead producer and he and the team did quite well in getting a Tony winning book writer, an Obie winning director and very successful actors on board. Once this team was together an early (beta version) of the show was created and it was performed to an audience of potential investors (the pitch). Early investors in the show are like angel investors as risk is higher at this point.

Beta Testing

The next step was to run a beta test of the product – called the “out of town tryout”. In general, out of town is anyplace other than New York City. It is used to do continuous improvement of the show much like beta testing is used to iterate a technology product based on user feedback. Theater critics also review shows in each city where they are performed. Ernest Shackleton Loves Me (Shackleton) had three runs outside of NYC: Seattle, New Jersey and Boston. During each, the show was improved based on audience and critic reaction. While it received rave reviews in each location, critics and the live audience can be helpful as they usually still can suggest ways that a show can be improved. Responding to that feedback helps prepare a show for a New York run.

Completing the Funding

Like a tech startup, it becomes easier to raise money in theater once the product is complete. In theater, a great deal of funding is required for the steps mentioned above, but it is difficult to obtain the bulk of funding to bring a show to New York for most shows without having actual performances. An average musical that goes to Off-Broadway will require $1.0 – $2.0 million in capitalization. And an average one that goes to Broadway tends to capitalize between $8 – $17 million. Hamilton cost roughly $12.5 million to produce, while Shackleton will capitalize at the lower end of the Off-Broadway range due to having a small cast and relatively efficient management. For many shows the completion of funding goes through the early days of the NYC run. It is not unusual for a show to announce it will open at a certain theater on a certain date and then be unable to raise the incremental money needed to do so. Like a tech startup, some shows, like Shackleton, may run a crowdfunding campaign to help top off its funding.

You can see what a campaign for a theater production looks like by clicking on this link and perhaps support the arts, or by buying tickets on the website (since the producer is my son, I had to include that small ask)!

The Product Launch

Assuming funding is sufficient and a theater has been secured (there currently is a shortage of Broadway theaters), the New York run then begins.  This is the true “product launch”. Part of a shows capitalization may be needed to fund a shortfall in revenue versus weekly cost during the first few weeks of the show as reviews plus word of mouth are often needed to help drive revenue above weekly break-even. Part of the reason so many Broadway shows employ famous Hollywood stars or are revivals of shows that had prior success and/or are based on a movie, TV show, or other well-known property is to insure substantial initial audiences. Some examples of this currently on Broadway are Hamilton (bestselling book), Aladdin (movie), Beautiful (Carole King story), Chicago (revival of successful show), Groundhog Day (movie), Hello Dolly (revival plus Bette Midler as star) and Sunset Boulevard (revival plus Glenn Close as star).

Crossing Weekly Break Even

Gross weekly burn for shows have a wide range (just like startups), with Broadway musicals having weekly costs from $500,000 to about $800,000 and Off-Broadway musicals in the $50,000 to $200,000 range. In addition, there are royalties of roughly 10% of revenue that go to a variety of players like the composer, book writer, etc. Hamilton has about $650,000 in weekly cost and roughly a $740,000 breakeven level when royalties are factored in.  Shackleton weekly costs are about $53,000, at the low end of the range for an off-Broadway musical, at under 10% of Hamilton’s weekly cost.

Is Hamilton the Facebook of Broadway?

Successful Broadway shows have multiple sources of revenue and can return significant multiples to investors.

Chart 1: A ‘Hits’ Business Example Capital Account

Since Shackleton just had its first performance on April 14, it’s too early to predict what the profit (or loss) picture will be for investors. On the other hand, Hamilton already has a track record that can be analyzed. In its first months on Broadway the show was grossing about $2 million per week which I estimate drove about $ 1 million per week in profits. Financial investors, like preferred shareholders of a startup, are entitled to the equivalent of “liquidation preferences”. This meant that investors recouped their money in a very short period, perhaps as little as 13 weeks. Once they recouped 110%, the producer began splitting profits with financial investors. This reduced the financial investors to roughly 42% of profits. In the early days of the Hamilton run, scalpers were reselling tickets at enormous profits. When my wife and I went to see the show in New York (March 2016) we paid $165 per ticket for great orchestra seats which we could have resold for $2500 per seat! Instead, we went and enjoyed the show. But if a scalper owned those tickets they could have made 15 times their money. Subsequently, the company decided to capture a portion of this revenue by adjusting seat prices for the better seats and as a result the show now grosses nearly $3 million per week. Since fixed weekly costs probably did not change, I estimate weekly profits are now about $1.8 million. At 42% of this, investors would be accruing roughly $750,000 per week. At this run rate, investors would receive over 3X their investment dollars annually from this revenue source alone if prices held up.

Multiple Companies Amplify Revenue and Profits

Currently Hamilton has a second permanent show in Chicago, a national touring company in San Francisco (until August when it’s supposed to move to LA) and has announced a second touring company that will begin the tour in Seattle in early 2018 before moving to Las Vegas and Cleveland and other stops. I believe it will also have a fifth company in London and a sixth in Asia by late 2018 or early 2019. Surprisingly, the touring companies can, in some cities, generate more weekly revenue than the Broadway company due to larger venues. Table 1 shows an estimate of the revenue per performance in the sold out San Francisco venue, the Orpheum Theater which has a capacity 2203 versus the Broadway capacity (Richard Rogers Theater) of 1319.

Table 1: Hamilton San Francisco Revenue Estimates

While one would expect Broadway prices to be higher, this has not been the case. I estimate the average ticket price in San Francisco to be $339 whereas the average on Broadway is now $282. The combination of 67% higher seating capacity and 20% higher average ticket prices means the revenue per week in San Francisco is now close to $6 million. Since it was lower in the first 4 weeks of the 21 plus week run, I estimate the total revenue for the run to be about $120 million. Given the explosive revenue, I wouldn’t be surprised if the run in San Francisco was extended again. While it has not been disclosed what share of this revenue goes to the production company, normally the production company is compensated as a base guarantee level plus a share of the profits (overage) after the venue covers its labor and marketing costs. Given these high weekly grosses, I assume the production company’s share is close to 50% of the grosses given the enormous profits versus an average show at the San Francisco venue (this would include both guarantee and overage). At 50% of revenue, there would still be almost $3 million per week to go towards paying the production company expenses (guarantee) and the local theater’s labor and marketing costs. If I use a lower $2 million of company share per week as profits to the production company that annualizes at over $100 million in additional profits or $42 million more per year for financial investors. The Chicago company is generating lower revenue than in San Francisco as the theater is smaller (1800 seats) and average ticket prices appear to be closer to $200. This would make revenue roughly $2.8 million per week. When the show ramps to 6 companies (I think by early 2019) the show could be generating aggregate revenue of $18-20 million per week or more should demand hold up. So, it would not be surprising if annual ticket revenue exceeded $1 billion per year at that time.

Merchandise adds to the mix

I’m not sure what amount of income each item of merchandise generates to the production company. Items like the cast album and music downloads could generate over $25 million in revenue, but in general only 40% of the net income from this comes to the company. On the other hand, T-shirts ($50 each) and the high-end program ($20 each) have extremely large margin which I think would accrue to the production company. If an average attendee of the show across the 6 (future) or more production companies spent $15 this could mean $1.2 million in merchandise sales per week across the 6 companies or another $60 million per year in revenue. At 60% gross margin this would add another $36 million in profits.

I expect Total Revenue for Hamilton to exceed $10 billion

In addition to the sources of revenue outlined above Hamilton will also have the opportunity for licensing to schools and others to perform the show, a movie, additional touring companies and more.  It seems likely to easily surpass the $6 billion that Lion King and Phantom are reported to have grossed to date, or the $4 billion so far for Wicked. In fact, I believe it eventually will gross over a $10 billion total. How this gets divided between the various players is more difficult to fully access but investors appear likely to receive over 100x their investment, Lin-Manuel Miranda could net as much as $ 1 billion (before taxes) and many other participants should become millionaires.

Surprisingly Hamilton may not generate the Highest Multiple for Theater Investors!

Believe it or not, a very modest musical with 2 actors appears to be the winner as far as return on investment. It is The Fantasticks which because of its low budget and excellent financial performance sustained over decades is now over a 250X return on invested capital. Obviously, my son, an optimistic entrepreneur, hopes his 2 actor musical, Ernest Shackleton Loves Me, will match this record.