Mike Kwatinetz is a Founding General Partner at Azure Capital Partners and a Venture Capitalist investing in application software (SaaS), ecommerce, consumer web and infrastructure technology companies. Successful exits include: Bill Me Later, VMware, TripIt and Top Tier.
In the long run, companies should be valued based on future earnings flows. Since this is often nearly impossible to calculate, proxies are often used instead. I find it difficult to competently determine what proxies should be used for cyclical companies, so will ignore them as they are not in my universe in venture or public investing. The focus of this post will be on exploring valuation for high-growth companies.
Companies that are already at or near their long-term model for profitability are often valued based on a multiple of earnings. If they are still in their high growth phase, they are likely to have increasing earnings over time and should therefore command a higher multiple than those that are growing slowly or not at all. Much analysis has been done to compare various such entities based on how their multiple of earnings varies depending on their level of growth. There will be a strong correlation between their multiple of earnings and level of growth, but other factors such as the “dependability of growth and earnings” can lead to wide variations in valuations. For example, a company that has a SaaS business model with greater than 100% revenue retention would usually be viewed as one where growth is “safer” … thus commanding a higher multiple than those with different models.
What about companies that are not near their long-term profit model?
Many of the companies that have recently gone public are a long way from reaching their long-term business model, and so other methods of valuing them must be used. Often, Investment Bankers suggest a multiple of revenue as one method. By considering how “comparable” companies trade based on revenue and growth a suggested valuation can be derived:
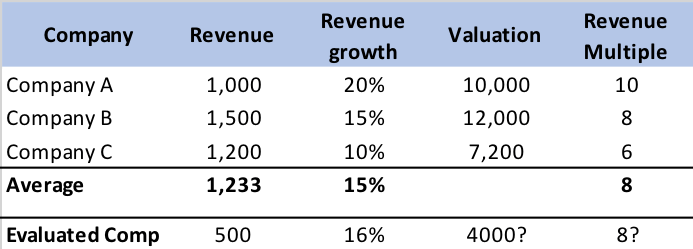
Table 1 Valuation of Comparable Companies
Table 1 shows a sample of what an investment banker might use as one method of determining potential valuation. However, there are many weaknesses to this approach. The biggest of which is: “what makes a company a comparable?” Usually companies selected are in the same sector. But, within a sector, business models can vary widely. For example, a sector like eCommerce has companies that:
Sell physical goods which are not their own brands
Sell physical goods that are their own brands
Are a marketplace in which sellers list their goods and the company facilitates sales, collects the money and pays the seller (e.g., eBay). Such a company’s revenue is not the sales of the goods but instead the marketplace commission.
Sell virtual goods that are their own
There can be wide variation in gross margin among the four categories, but in general, gross margins are higher as we go from 1 to 2 to 3 to 4. In fact, companies in category 1 often have gross margins in the 20% to 40% range, those in category 2 in the 40% to 70% range, those in category 3 in the 70% to 90% range and those in category 4 in the 85% to 95% range. What this means is that all other things being equal the potential earnings at scale for these will depend more on its business model than on the sector.
To test our theory of whether using a multiple of Gross Margin was a better measure of value than a multiple of revenue, we plotted the relationship between growth and valuation using each of these methods. It turns out there is a correlation between valuation as a multiple of revenue based on revenue growth regardless of industry. We found the correlation coefficient for it to be 0.36, an indication of a moderate relationship. This was still far better than the correlation between slow growth and high growth plays that just happen to be in the same industry. So, I believe (based on evidence) that growth is a better indicator of multiple than industry sector.
In that same post we plotted the relationship between revenue growth and valuation as a multiple of gross margin dollars (GMD). For the remainder of this post I’ll use multiple to mean the multiple of GMD. Since it seemed obvious that GM% is a better indicator of future earnings than revenue, I wasn’t surprised that the correlation coefficient was a much higher 0.62, an indication of a much stronger relationship. While other factors like dependability of revenue, market size, perceived competitive advantage and more will affect the multiple, I decided that this method of assessing valuation was strong enough that I use the resulting least square regression formula as a way of getting a starting approximation for the value of a company that has yet to reach “business model maturity”.
Why Contribution Margin is a better indicator than Gross Margin of future earnings.
The reason the correlation coefficient between GMD multiples and revenue growth is 0.62 rather than a number much closer to 1.0 is that a number of other factors play a role in determining future earnings. For me, the most important one is Contribution Margin, which considers the marketing/sales cost spent each month to help drive revenue (think of it as GMD minus marketing/sales cost). Contribution Margin indicates how quickly the benefits of scaling the business will enable reaching mature earnings. When I look at a company that has low contribution margins it is difficult to see how it can generate substantial profits unless it can improve gross margin and/or reduce marketing spend as a percentage of sales. That is why the bull story on Spotify is that it will get the music labels to substantially reduce their royalty level (from close to 80%), or for Uber is that it will go to self-driving vehicles or why Blue Apron keeps reducing its marketing spend in an effort to increase contribution margin. The argument then becomes a speculation on why the multiple should be of a “theoretically” higher amount. I would like to plot revenue growth versus the multiple of Contribution Margin to obtain a new least square formula, which I am confident would have a higher correlation coefficient. Unfortunately, many companies do not readily identify variable marketing/sales cost so instead I analyze where it is likely to be, and factor that into how I view valuation.
Other Factors to Consider for Understanding a Company’s Valuation
Recurring revenue models should have a higher multiple: Business to Business SaaS (Software as a Service) companies usually trade at higher multiples than those with other models that are growing at the same rate. The reason is simple: their customers are likely to stay on their platforms for a decade or more and often increase what they spend over time. This creates a situation where a portion of revenue growth can be sustained even before adding the marketing spend to acquire future customers which in turn should lead to higher Contribution Margins.
Companies that are in markets that are likely to grow at a high rate for 5 years or more should have higher multiples: If the market a company plays in is growing quickly there is more opportunity to sustain high growth levels for a longer time, leading to a likelihood of greater future earnings.
Companies with substantial competitive advantage should have higher multiples: Any company that has a product that it is difficult to replicate can elevate its margins and earnings for a long period of time. One of the best examples of this is pharmaceutical companies, where their drug patents last for 20 years. Even after the patent expires the original holder will continue to sell the drug at a much higher price than its generic alternatives and still maintain strong market share.
Companies that are farther away from generating actual earnings should trade at lower multiples than those that are close or already generating some earnings: The reason for this is obvious to me but it is often not the case … especially for newly minted IPOs. I believe there is considerable risk that such companies will take many years to reach profitability (if they do at all) and that when they do it will only be a modest portion of revenue. I started this post by saying that eventually valuations should reflect the present value of future earnings flows. The longer it takes to get to mature earnings, the lower its present value (see table 2). If tangible earnings started 7 years out (vs immediately) the discounted value of the flow would be reduced by more than half – reflecting that the valuation of the company should be half that of a company with a similar earnings flow that started immediately.
Table 2: Present value of future dollars using a 12% discount rate
How I bet on my Valuation Methodology.
Consider the three recommendations in my last post that have had their IPO between November of 2017 and mid-2019: DocuSign, Stitch fix and Zoom. They all are profitable already. Two are B to B SaaS companies with greater than 100% revenue retention (that means that the cohort of customers they had a year ago, including those that churned, are spending more today than when they started). The third has existing customers increasing their year over spend as well. They are all growing at a strong pace.
SoundBytes
While I did not include it in my recommended stocks for 2020, I recently purchased shares in Pinterest (at $19.50 per share), one of the three 2019 Unicorn IPOs (of the nine I highlighted in my last post) that was already profitable. Based on my valuation methods it is at a reasonable valuation, grew 47% year over year in its last reported quarter, and appears well positioned to grow at a high level for many years. What I find surprising is the comparison to the valuation of Snap. Snap is growing at roughly the same pace (50% in the last reported quarter), had an adjusted EBITDA loss of nearly 10% in Q3 and yet was trading at nearly double the multiple of GMD.
I can’t help mentioning that we predicted that Tesla was likely to have a great Q4 in our post in November, based on the long wait time for my getting a model 3 I had ordered, coupled with manufacturing cranking out more expensive model S and X versions for most of the quarter, and that the Chinese factory was starting to produce cars. At the time the stock was $333 per share. Now, after it has risen over 200 points a number of analysts are saying the same thing.
I wanted to start this post by repeating something I discussed in my top ten lists in 2017 and 2018 which I learned while at Sanford Bernstein in my Wall Street days: “Owning companies that have strong competitive advantages and a great business model in a potentially mega-sized market can create the largest performance gains over time (assuming one is correct).” It does make my stock predictions somewhat boring (as they were on Wall Street where my top picks, Dell and Microsoft each appreciated over 100X over the ten years I was recommending them).
Let’s do a little simple math. Suppose one can generate an IRR of 26% per year (my target is to be over 25%) over a long period of time. The wonder of compounding is that at 26% per year your assets will double every 3 years. In 6 years, this would mean 4X your original investment dollars and in 12 years the result would be 16X. For comparison purposes, at 5% per year your assets would only be 1.8X in 12 years and at 10% IRR 3.1X. While 25%+ IRR represents very high performance, I have been fortunate enough to consistently exceed it (but always am worried that it can’t keep up)! For my recommendations of the past 6 years, the IRR is 34.8% and since this exceeds 26%, the 6-year performance is roughly 6X rather than 4X.
What is the trick to achieving 25% plus IRR? Here are a few of my basic rules:
Start with companies growing revenue 20% or more, where those closer to 20% also have opportunity to expand income faster than revenue
Make sure the market they are attacking is large enough to support continued high growth for at least 5 years forward
Stay away from companies that don’t have profitability in sight as companies eventually should trade at a multiple of earnings.
Only choose companies with competitive advantages in their space
Re-evaluate your choices periodically but don’t be consumed by short term movement
As I go through each of my 6 stock picks I have also considered where the stock currently trades relative to its growth and other performance metrics. With that in mind, as is my tendency (and was stated in my last post), I am continuing to recommend Tesla, Facebook, Amazon, Stitch Fix and DocuSign. I am adding Zoom Video Communications (ZM) to the list. For Zoom and Amazon I will recommend a more complex transaction to achieve my target return.
2020 Stock Recommendations:
1. Tesla stock appreciation will continue to outperform the market (it closed last year at $418/share)
Tesla is likely to continue to be a volatile stock, but it has so many positives in front of it that I believe it wise to continue to own it. The upward trend in units and revenue should be strong in 2020 because:
The model 3 continues to be one of the most attractive cars on the market. Electric Car Reviews has come out with a report stating that Model 3 cost of ownership not only blows away the Audi AS but is also lower than a Toyota Camry! The analysis is that the 5-year cost of ownership of the Tesla is $0.46 per mile while the Audi AS comes in 70% higher at $0.80 per mile. While Audi being more expensive is no surprise, what is shocking is how much more expensive it is. The report also determined that Toyota Camry has a higher cost as well ($0.49/mile)! Given the fact that the Tesla is a luxury vehicle and the Camry is far from that, why would anyone with this knowledge decide to buy a low-end car like a Camry over a Model 3 when the Camry costs more to own? What gets the Tesla to a lower cost than the Camry is much lower fuel cost, virtually no maintenance cost and high resale value. While the Camry purchase price is lower, these factors more than make up for the initial price difference
China, the largest market for electronic vehicles, is about to take off in sales. With the new production facility in China going live, Tesla will be able to significantly increase production in 2020 and will benefit from the car no longer being subject to import duties in China.
European demand for Teslas is increasing dramatically. With its Chinese plant going live, Tesla will be able to partly meet European demand which could be as high as the U.S. in the future. The company is building another factory in Europe in anticipation. The earliest indicator of just how much market share Tesla can reach has occurred in Norway where electric cars receive numerous incentives. Tesla is now the best selling car in that country and demand for electric cars there now exceeds gas driven vehicles.
While 2020 is shaping up as a stairstep uptick in sales for Tesla given increased capacity and demand, various factors augur continued growth well beyond 2020. For example, Tesla is only partway towards having a full lineup of vehicles. In the future it will add:
Pickup trucks – where pre-orders and recent surveys indicate it will acquire 10-20% of that market
A lower priced SUV – at Model 3 type pricing this will be attacking a much larger market than the Model X
A sports car – early specifications indicate that it could rival Ferrari in performance but at pricing more like a Porsche
A refreshed version of the Model S
A semi – where the lower cost of fuel and maintenance could mean strong market share.
2. Facebook stock appreciation will continue to outperform the market (it closed last year at $205/share)
Facebook, like Tesla, continues to have a great deal of controversy surrounding it and therefore may sometimes have price drops that its financial metrics do not warrant. This was the case in 2018 when the stock dropped 28% in value during that year. While 2019 partly recovered from what I believe was an excessive reaction, it’s important to note that the 2019 year-end price of $205/share was only 16% higher than at the end of 2017 while trailing revenue will have grown by about 75% in the 2-year period. The EPS run rate should be up in a similar way after a few quarters of lower earnings in early 2019. My point is that the stock remains at a low price given its metrics. I expect Q4 to be quite strong and believe 2020 will continue to show solid growth.
The Facebook platform is still increasing the number of active users, albeit by only about 5%-6%. Additionally, Facebook continues to increase inventory utilization and pricing. In fact, given what I anticipate will be added advertising spend due to the heated elections for president, senate seats, governorships etc., Facebook advertising inventory usage and rates could increase faster (see prediction 7 on election spending).
Facebook should also benefit by an acceleration of commerce and increased monetization of advertising on Instagram. Facebook started monetizing that platform in 2017 and Instagram revenue has been growing exponentially and is likely to close out 2019 at well over $10 billion. A wild card for growth is potential monetization of WhatsApp. That platform now has over 1.5 billion active users with over 300 million active every day. It appears close to beginning monetization.
The factors discussed could enable Facebook to continue to grow revenue at 20% – 30% annually for another 3-5 years making it a sound longer term investment.
3. DocuSign stock appreciation will continue to outperform the market (it closed last year at $74/share)
DocuSign is the runaway leader in e-signatures facilitating multiple parties signing documents in a secure, reliable way for board resolutions, mortgages, investment documents, etc. Being the early leader creates a network effect, as hundreds of millions of people are in the DocuSign e-signature database. The company has worked hard to expand its scope of usage for both enterprise and smaller companies by adding software for full life-cycle management of agreements. This includes the process of generating, redlining, and negotiating agreements in a multi-user environment, all under secure conditions. On the small business side, the DocuSign product is called DocuSign Negotiate and is integrated with Salesforce.
The company is a SaaS company with a stable revenue base of over 560,000 customers at the end of October, up well over 20% from a year earlier. Its strategy is one of land and expand with revenue from existing customers increasing each year leading to a roughly 40% year over year revenue increase in the most recent quarter (fiscal Q3). SaaS products account for over 95% of revenue with professional services providing the rest. As a SaaS company, gross margins are high at 79% (on a non-GAAP basis).
The company has now reached positive earnings on a non-GAAP basis of $0.11/share versus $0.00 a year ago. I use non-GAAP as GAAP financials distort actual results by creating extra cost on the P&L if the company’s stock appreciates. These costs are theoretic rather than real.
My only concern with this recommendation is that the stock has had a 72% runup in 2019 but given its growth, move to positive earnings and the fact that SaaS companies trade at higher multiples of revenue than others I still believe it can outperform this year.
4. Stitch Fix Stock appreciation will continue to outperform the market (it closed last year at $25.66/share)
Stitch Fix offers customers, who are primarily women, the ability to shop from home by sending them a box with several items selected based on sophisticated analysis of her profile and prior purchases. The customer pays a $20 “styling fee” for the box which can be applied towards purchasing anything in the box. The company is the strong leader in the space with revenue approaching a $2 billion run rate. Unlike many of the recent IPO companies, it has shown an ability to balance growth and earnings. The stock had a strong 2019 ending the year at $25.66 per share up 51% over the 2018 closing price. Despite this, our valuation methodology continues to show it to be substantially under valued and it remains one of my picks for 2020. The likely cause of what I believe is a low valuation is a fear of Amazon making it difficult for Stitch Fix to succeed. As the company gets larger this fear should recede helping the multiple to expand.
Stitch Fix continues to add higher-end brands and to increase its reach into men, plus sizes and kids. Its algorithms to personalize each box of clothes it ships keeps improving. Therefore, the company can spend less on acquiring new customers as it has increased its ability to get existing customers to spend more and come back more often. Stitch Fix can continue to grow its revenue from women in the U.S. with expansion opportunities in international markets over time. I believe the company can continue to grow by roughly 20% or more in 2020 and beyond.
Stitch Fix revenue growth (of over 21% in the latest reported quarter) comes from a combination of increasing the number of active clients by 17% to 3.4 million, coupled with driving higher revenue per active client. The company accomplished this while generating profits on a non-GAAP basis.
5. Amazon stock strategy will outpace the market (it closed last year at $1848/share).
Amazon shares increased by 23% last year while revenue in Q3 was up 24% year over year. This meant the stock performance mirrored revenue growth. Growth in the core commerce business has slowed but Amazon’s cloud and echo/Alexa businesses are strong enough to help the company maintain roughly 20% growth in 2020. The company continues to invest heavily in R&D with a push to create automated retail stores one of its latest initiatives. If that proves successful, Amazon can greatly expand its physical presence and potentially increase growth through the rollout of numerous brick and mortar locations. But at its current size, it will be difficult for the company to maintain over 20% revenue growth for many years (excluding acquisitions) so I am suggesting a more complex investment in this stock:
Buy X shares of the stock (or keep the ones you have)
Sell Amazon puts for the same number of shares with the puts expiring on January 15, 2021 and having a strike price of $1750. The most recent sale of these puts was for over $126
So, net out of pocket cost would be reduced to $1722
A 20% increase in the stock price (roughly Amazon’s growth rate) would mean 29% growth in value since the puts would expire worthless
If the stock declined 226 points the option sale would be a break-even. Any decline beyond that and you would lose additional dollars.
If the options still have a premium on December 31, I will measure their value on January 15, 2021 for the purposes of performance.
6. I’m adding Zoom Video Communications to the list but with an even more complex investment strategy (the stock is currently at $72.20)
I discussed Zoom Video Communications (ZM) in my post on June 24, 2019. In that post I described the reasons I liked Zoom for the long term:
Revenue retention of a cohort was about 140%
It acquires customers very efficiently with a payback period of 7 months as the host of a Zoom call invites various people to participate in the call and those who are not already Zoom users can be readily targeted by the company at little cost
Gross Margins are over 80% and could increase
The product has been rated best in class numerous times
Its compression technology (the key ingredient in making video high quality) appears to have a multi-year lead over the competition
Adding to those reasons it’s important to note that ZM is improving earnings and was slightly profitable in its most recent reported quarter
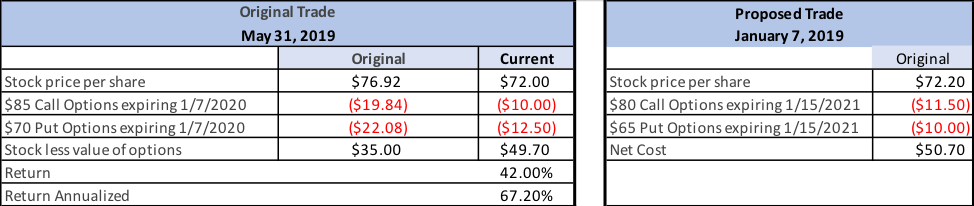
The fly in the ointment was that my valuation technology showed that it was overvalued. However, I came up with a way of “future pricing” the stock. Since I expected revenue to grow by about 150% over the next 7 quarters (at the time it was growing over 100% year over year) “future pricing” would make it an attractive stock. This was possible due to the extremely high premiums for options in the stock. So far that call is working out. Despite the company growing revenue in the 3 quarters subsequent to my post by over 57%, my concern about valuation has proven correct and the stock has declined from $76.92 to $72.20. If I closed out the position today by selling the stock and buying back the options (see Table 1) my return for less than 7.5 months would be a 42% profit. This has occurred despite the stock declining slightly due to shrinkage in the premiums.
Table 1: Previous Zoom trade and proposed trade
I typically prefer using longer term options for doing this type of trade as revenue growth of this magnitude should eventually cause the stock to rise, plus the premiums on options that are further out are much higher, reducing the risk profile, but I will construct this trade so that the options expire on January 15, 2021 to be able to evaluate it in one year. In measuring my performance we’ll use the closing stock price on the option expiration date, January 15, 2021 since premiums in options persist until their expiration date so the extra 2 weeks leads to better optimization of the trade.
So, here is the proposed trade (see table 1):
Buy X shares of the stock at $72.20 (today’s price)
Sell Calls for X shares expiring January 15, 2021 at a strike of $80/share for $11.50 (same as last price it traded)
Sell puts for X shares expiring January 15, 2021 with strike of $65/share for $10.00 (same as last price it traded)
I expect revenue growth of 60% or more 4 quarters out. I also expect the stock to rise some portion of that, as it is now closer to its value than when I did the earlier transaction on May 31, 2019. Check my prior post for further analysis on Zoom, but here are 3 cases that matter at December 31, 2020:
Stock closes over $80/share (up 11% or more) at end of the year: the profit would be 58% of the net cost of the transaction
This would happen because the stock would be called, and you would get $80/share
The put would expire worthless
Since you paid a net cost of $50.70, net profit would be $29.30
Stock closes flat at $72.20: your profit would be $21.50 (42%)
The put and the call would each expire worthless, so you would earn the original premiums you received when you sold them
The stock would be worth the same as what you paid
Stock closes at $57.85 on December 31: you would be at break even. If it closed lower, then losses would accumulate twice as quickly:
The put holder would require you to buy the stock at the put exercise price of $65, $7.15 more than it would be worth
The call would expire worthless
The original stock would have declined from $72.20 to $57.85, a loss of $14.35
The loss on the stock and put together would equal $21.50, the original premiums you received for those options
Outside of my stock picks, I always like to make a few non-stock predictions for the year ahead.
7. The major election year will cause a substantial increase in advertising dollars spent
According to Advertising Analytics political spending has grown an average of 27% per year since 2012. Both the rise of Super PACs and the launch of online donation tools such as ActBlue have substantially contributed to this growth. While much of the spend is targeted at TV, online platforms have seen an increasing share of the dollars, especially Facebook and Google. The spend is primarily in even years, as those are the ones with senate, house and gubernatorial races (except for minor exceptions). Of course, every 4th year this is boosted by the added spend from presidential candidates. The Wall Street Journal projects the 2020 amount will be about $9.9 billion…up nearly 60% from the 2016 election year. It should be noted that the forecast was prior to Bloomberg entering the race and if he remains a viable candidate an additional $2 billion or more could be added to this total.
The portion targeted at the digital world is projected to be about $2.8 billion or about 2.2% of total digital ad spending. Much of these dollars will likely go to Facebook and Google. This spend has a dual impact: first it adds to the revenue of each platform in a direct way, but secondly it can also cause the cost of advertising on those platforms to rise for others as well.
8.Automation of Retail will continue to gain momentum
This will happen in multiple ways, including:
More Brick & Mortar locations will offer some or all the SKUs in the store for online purchase through Kiosks (assisted by clerks/sales personnel). By doing this, merchants will be able to offer a larger variety of items, styles, sizes and colors than can be carried in any one outlet. In addition, the consolidation of inventory achieved in this manner will add efficiency to the business model. In the case of clothing, such stores will carry samples of items so the customer can try them on, partly to optimize fit but also to determine whether he or she likes the way it looks and feels on them. If one observes the massive use of Kiosks at airports it becomes obvious that they reduce the number of employees needed and can speed up checking in. One conclusion is this will be the wave of the future for multiple consumer-based industries.
Many more locations will begin incorporating technology to eliminate the number of employees needed in their stores. Amazon will likely be a leader in this, but others will also provide ways to reduce the cost of ordering, picking goods, checking out and receiving information while at the store.
9. The Warriors will come back strong in the 2020/21 season
Let me begin by saying that this prediction is not being made because I have been so humbled by my miss in the July post where I predicted that the Warriors could edge into the 2020 playoffs and then contend for a title if Klay returned in late February/early March. Rather, it is based on analysis of their opportunity for next season and also an attempt to add a little fun to my Top Ten List! The benefit of this season:
Klay and Curry are getting substantial time off after 5 seasons of heavy stress. They should be refreshed at the start of next season
Russell, assuming he doesn’t keep missing games with injuries, is learning the Warriors style of play
Because of the injuries to Klay, Curry, Looney, and to a lesser extent Green and Russell, several of the younger members of the team are getting experience at a much more rapid rate than would normally be possible and the Warriors are able to have more time to evaluate them as potential long-term assets
If the Warriors continue to lose at their current rate, they will be able to get a high draft choice for the first time since 2012 when they drafted Harrison Barnes with the 7th pick. Since then their highest pick has been between the 28th and 30th player chosen (30 is the lowest pick in the first round)
The Warriors will have more cap space available to sign a quality veteran
Andre Iguodala might re-sign with the team, and while this is not necessary for my prediction it would be great for him and for the team
The veterans should be hungry again after several years of almost being bored during the regular season
I am assuming the Warriors will be relatively healthy next season for this to occur.
10. At least one of the major Unicorns will be acquired by a larger player
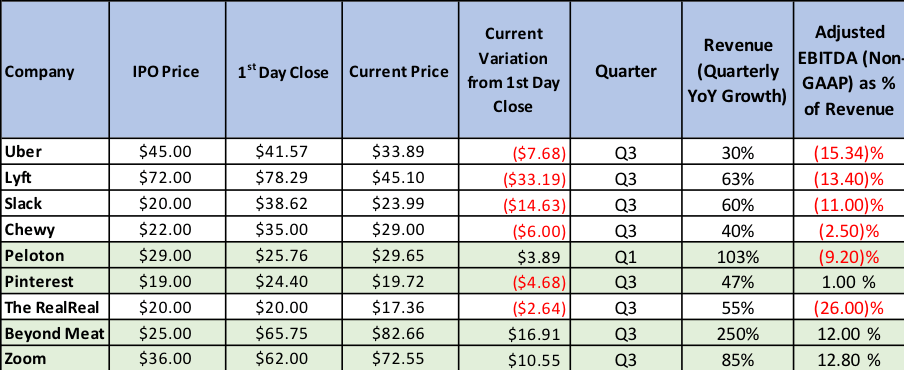
In 2019, there was a change to the investing environment where most companies that did not show a hint of potential profitability had difficulty maintaining their market price. This was particularly true of highly touted Unicorns, which mostly struggled to increase their share price dramatically from the price each closed on the day of their IPO. Table 2 shows the 9 Unicorns whose IPOs we highlighted in our last post. Other than Beyond Meat, Zoom and Pinterest, they all appear some distance from turning a proforma profit. Five of the other six are below their price on the first day’s close. A 6th, Peloton, is slightly above the IPO price (and further above the first days close). Beyond Meat grew revenue 250% in its latest quarter and moved to profitability as well. Its stock jumped on the first day and is even higher today. While Pinterest is showing an ability to be profitable it is still between the price of the IPO and its close on the first day of trading. Zoom, which is one of our recommended buys, was profitable (on a Non-GAAP basis) and grew revenue 85% in its most recent quarter. A 10th player, WeWork, had such substantial losses that it was unable to have a successful IPO.
Something that each of these companies have in common is that they are all growing revenue at 30% or more, are attacking large markets, and are either in the leadership position in that market or are one of two in such a position. Because of this I believe one or more of these (and comparable Unicorns) could be an interesting acquisition for a much larger company who is willing to help make them profitable. For such an acquirer their growth and leadership position could be quite attractive.
I entered 2019 with some trepidation as my favored stocks are high beta and if the bear market of the latter portion of 2018 continued, I wasn’t sure I would once again beat the market…it was a pretty close call last year. However, I felt the companies I liked would continue to grow their revenue and hoped the market would reward their performance. As it turns out, the 5 stocks I included in my top ten list each showed solid company performance and the market returned to the bull side. The average gain for the stocks was 45.7% (versus the S&P gain of 24.3%).
Before reviewing each of my top ten from last year, I would like to once again reveal long term performance of the stock pick portion of my top ten list. For my picks, I assume equal weighting for each stock in each year to come up with my performance and then compound the yearly gains (or losses) to provide my 6-year performance. For the S&P my source is Multpl.com. I’m comparing the S&P index at January 2 of each year to determine annual performance. My compound gain for the 6-year period is 499% which equates to an IRR of 34.8%. The S&P was up 78% during the same 6-year period, an IRR of 10.1%.
The 2019 Top Ten Predictions Recap
One of my New Year’s pledges was to be more humble, so I would like to point out that I wasn’t 10 for 10 on my picks. One of my 5 stocks slightly under-performed the market and one of my non-stock forecasts was a mixed bag. The miss on the non-stock side was the only forecast outside of tech, once again highlighting that I am much better off sticking to the sector I know best (good advice for readers as well). However, I believe I had a pretty solid year in my forecasts as my stock portfolio (5 of the picks) significantly outperformed the market, with two at approximately market performance and three having amazing performance with increases of 51% to 72%. Regarding the 5 non-stock predictions, 4 were right on target and the 5th was very mixed. As a quick reminder, my predictions were:
Stock Portfolio 2019 Picks:
Tesla stock will outpace the market (it closed last year at $333/share and opened this year at $310)
Facebook Stock will outpace the market (it closed last year at $131/share)
Amazon Stock will outpace the market (it opened the year at $1502/share)
Stitch Fix stock appreciation will outpace the market (it closed last year at $17/share)
DocuSign stock will outpace the market in 2019 (it is currently at $43/share and opened the year at $41)
5 Non-Stock Predictions:
Replacing cashiers with technology will be proven out in 2019
Replacing cooks, baristas, and waitstaff with robots will begin to be proven in 2019
Influencers will be increasingly utilized to directly drive commerce
The Cannabis Sector should show substantial gains in 2019
2019 will be the year of the unicorn IPO
In the discussion below, I’ve listed in bold each of my ten predictions and give an evaluation of how I fared on each.
Tesla stock will outpace the market (it closed last year at $333/share and opened this year at $310)
Tesla proved to be a rocky ride through 2019 as detractors of the company created quite a bit of fear towards the middle of the year, driving the stock to a low of $177 in June. A sequence of good news followed, and the stock recovered and reached a high of $379 in front of the truck unveiling. I’m a very simplistic guy when I evaluate success as I use actual success as the measure as opposed to whether I would buy a product. Critics of the truck used Elon’s unsuccessful demonstration of the truck being “bulletproof” and the fact that it was missing mirrors and windshield wipers to criticize it. Since it is not expected to be production ready for about two years this is ridiculous! If the same critics applied a similar level of skepticism to the state of other planned competitive electric vehicles (some of which are two plus years away) one could conclude that none of them will be ready on time. I certainly think the various announced electric vehicles from others will all eventually ship, but do not expect them to match the Tesla battery and software capability given its 3 to 5-year lead. I said I’m a simple guy, so when I evaluate the truck, I look at the 250,000 pre-orders and notice it equates to over $12.5B in incremental revenue for the product! While many of these pre-orders will not convert, others likely will step in. To me that is strong indication that the truck will be an important contributor to Tesla growth once it goes into production.
Tesla stock recovered from the bad press surrounding the truck as orders for it mounted, the Chinese factory launch was on target and back order volume in the U.S. kept factories at maximum production. Given a late year run the stock was up to $418 by year end, up 34.9% from the January opening price. But for continuing recommendations I use the prior year’s close as the benchmark (for measuring my performance) which places the gain at a lower 25.6% year over year as the January opening price was lower than the December 31 close. Either way this was a successful recommendation.
Facebook Stock will outpace the market (it closed last year at $131/share)
Facebook, like Tesla, has many critics regarding its stock. In 2018 this led to a 28% decline in the stock. The problem for the critics is that it keeps turning out very strong financial numbers and eventually the stock price has to recognize that. It appears that 2019 revenue will be up roughly 30% over 2018. After several quarters of extraordinary expenses, the company returned to “normal” earnings levels of about 35% of revenue in the September quarter. I expect Q4 to be at a similar or even stronger profit level as it is the seasonally strongest quarter of the year given the company’s ability to charge high Christmas season advertising rates. As a result, the stock has had a banner year increasing to $205/share at year-end up 57% over the prior year’s close making this pick one of my three major winners.
Amazon Stock will outpace the market (it opened the year at $1502/share)
Amazon had another very solid growth year and the stock kept pace with its growth. Revenue will be up about 20% over 2018 and gross margins remain in the 40% range. For Amazon, Q4 is a wildly seasonal quarter where revenue could jump by close to 30% sequentially. While the incremental revenue tends to have gross margins in the 25% – 30% range as it is heavily driven by ecommerce, the company could post a solid profit increase over Q3. The stock pretty much followed revenue growth, posting a 23% year over year gain closing the year at $1848 per share. I view this as another winner, but it slightly under-performed the S&P index.
Stitch Fix stock appreciation will outpace the market (it closed last year at $17/share)
Stitch Fix, unlike many of the recent IPO companies, has shown an ability to balance growth and earnings. In its fiscal year ending in July, year over year growth increased from 26% in FY 2018 to over 28% in FY 2019 (although without the extra week in Q4 of FY 2019 year over year growth would have been about the same as the prior year). For fiscal 2020, the company guidance is for 23% – 25% revenue growth after adjusting for the extra week in Q4 of FY 2019. On December 9th, Stitch Fix reported Q1 results that exceeded market expectations. The stock reacted well ending the year at $25.66 per share and the year over year gain in calendar 2019 moved to a stellar level of 51% over the 2018 closing price.
DocuSign stock will outpace the market in 2019 (it is currently at $43/share and opened the year at $41)
DocuSign continued to execute well throughout calendar 2019. On December 5th it reported 40% revenue growth in its October quarter, exceeding analyst expectations. Given this momentum, DocuSign stock was the largest gainer among our 5 picks at 72% for the year ending at just over $74 per share (since this was a new recommendation, I used the higher $43 price at the time of the post to measure performance). The company also gave evidence that it is reducing losses and not burning cash. Since ~95% of its revenue is subscription, the company is able to maintain close to 80% gross margin (on a proforma basis) and is well positioned to continue to drive growth. But, remember that growth declines for very high growth companies so I would expect somewhat slower growth than 40% in 2020.
Replacing cashiers with technology will be proven out in 2019
A year ago, I emphasized that Amazon was in the early experimental phase of its Go Stores which are essentially cashierless using technology to record purchases and to bill for them. The company now has opened or announced 21 of these stores. The pace is slower than I expected as Amazon is still optimizing the experience and lowering the cost of the technology. Now, according to Bloomberg, the company appears ready to:
Open larger format supermarkets using the technology
Increase the pace of adding smaller format locations
Begin licensing the technology to other retailers, replicating the strategy it deployed in rolling out Amazon Web Services to others
Replacing cooks, baristas, and waitstaff with robots will begin to be proven in 2019
The rise of the robots for replacing baristas, cooks and waitstaff did indeed accelerate in 2019. In the coffee arena, Briggo now has robots making coffee in 7 locations (soon to be in SFO and already in the Austin Airport), Café X robotic coffee makers are now in 3 locations, and there are even other robots making coffee in Russia (GBL Robotics), Australia (Aabak) and Japan (HIS Co). There is similar expansion of robotic pizza and burger cooks from players like Zume Pizza and Creator and numerous robots now serving food. This emerging trend has been proven to work. As the cost of robots decline and minimum wage rises there will be further expansion of this usage including franchise approaches that might start in 2020.
Influencers will be increasingly utilized to directly drive commerce
The use of influencers to drive commerce accelerated in 2019. Possibly the most important development in the arena was the April 2019 launch by Instagram of social commerce. Instagram now let’s influencers use the app to tag and sell products directly, that is, their posts can be “shoppable”. Part of the series of steps Instagram took was adding “checkout” which lets customers purchase products without leaving the walls of the app.
A second increase in the trend is for major influencers to own a portion of companies that depend on their influence to drive a large volume of traffic. In that way they can capture more of the value of their immense influence. Using this concept, Rihanna has become the wealthiest female musician in the world at an estimated net worth of $600 million. The vast majority of her wealth is from ownership in companies where she uses her influence to drive revenue. The two primary ones are Fenty Beauty and Fenty Maison. Fenty Beauty was launched in late 2017 and appears to be valued at over $3 billion. Rihanna owns 15% – do the math! Fenty Maison is a partnership between LVMH (the largest luxury brand owner) and Rihanna announced in May of 2019. It is targeting fashion products and marks the first time the luxury conglomerate has launched a fashion brand from scratch since 1987. Rihanna has more than 70 million followers on Instagram and this clearly establishes her as someone who can influence commerce.
The Cannabis Sector should show substantial gains in 2019
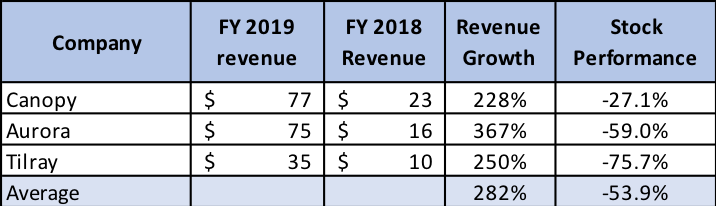
The accuracy of this forecast was a mixed bag as the key companies grew revenue at extremely high rates, but their stock valuations declined resulting in poor performance of the cannabis index (which I had said should be a barometer). A few examples of the performance of the largest public companies in the sector are shown in Table 2.
Table 2: Performance of Largest Public Cannabis Companies
*Note: Canopy last quarter was Sept 2019
In each case, the last reported quarter was calendar Q3. For Tilray, I subtracted the revenue from its acquisition of Manitoba Harvest so that the growth shown is organic growth. I consider this forecast a hit and a miss as I was correct regarding revenue (it was up an average of 282%) but the stocks did not follow suit, even modestly, as the average of the three was a decline of 54%. While my forecast was not for any individual company or stock in the sector, it was wrong regarding the stocks but right regarding company growth. The conclusion is humbling as I’m glad that I exercised constraint in not investing in a sector where I do not have solid knowledge of the way the stocks might perform.
2019 will be the year of the unicorn IPO
This proved true as many of the largest unicorns went public in 2019. Some of the most famous ones included on the list are: Beyond Meat, Chewy, Lyft, Peloton, Pinterest, Slack, The Real Real, Uber and Zoom. Of the 9 shown, four had initial valuations between $8 billion and $12 billion, two over $20 billion and Uber was the highest at an $82 billion valuation. Some unicorns found the public markets not as accepting of losses as the private market, with Lyft and Uber stock coming under considerable pressure and WeWork unable to find public buyers of its stock leading to a failed IPO and shakeup of company management. There is more to come in 2020 including another mega one: Airbnb.
2020 Predictions coming soon
Stay tuned for my top ten predictions for 2020…but please note that all 5 of the stocks recommended for 2019 will remain on the list.
Soundbyte
Before the basketball season began, I had a post predicting that the Warriors still had a reasonable chance to make the playoffs (if Klay returned in late February). Talk about feeling humble! I guess, counting this I had 3 misses on my predictions.