
In the long run, companies should be valued based on future earnings flows. Since this is often nearly impossible to calculate, proxies are often used instead. I find it difficult to competently determine what proxies should be used for cyclical companies, so will ignore them as they are not in my universe in venture or public investing. The focus of this post will be on exploring valuation for high-growth companies.
Companies that are already at or near their long-term model for profitability are often valued based on a multiple of earnings. If they are still in their high growth phase, they are likely to have increasing earnings over time and should therefore command a higher multiple than those that are growing slowly or not at all. Much analysis has been done to compare various such entities based on how their multiple of earnings varies depending on their level of growth. There will be a strong correlation between their multiple of earnings and level of growth, but other factors such as the “dependability of growth and earnings” can lead to wide variations in valuations. For example, a company that has a SaaS business model with greater than 100% revenue retention would usually be viewed as one where growth is “safer” … thus commanding a higher multiple than those with different models.
What about companies that are not near their long-term profit model?
Many of the companies that have recently gone public are a long way from reaching their long-term business model, and so other methods of valuing them must be used. Often, Investment Bankers suggest a multiple of revenue as one method. By considering how “comparable” companies trade based on revenue and growth a suggested valuation can be derived:
Table 1 Valuation of Comparable Companies
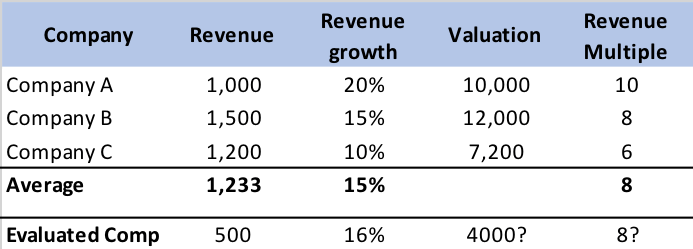
Table 1 shows a sample of what an investment banker might use as one method of determining potential valuation. However, there are many weaknesses to this approach. The biggest of which is: “what makes a company a comparable?” Usually companies selected are in the same sector. But, within a sector, business models can vary widely. For example, a sector like eCommerce has companies that:
- Sell physical goods which are not their own brands
- Sell physical goods that are their own brands
- Are a marketplace in which sellers list their goods and the company facilitates sales, collects the money and pays the seller (e.g., eBay). Such a company’s revenue is not the sales of the goods but instead the marketplace commission.
- Sell virtual goods that are their own
There can be wide variation in gross margin among the four categories, but in general, gross margins are higher as we go from 1 to 2 to 3 to 4. In fact, companies in category 1 often have gross margins in the 20% to 40% range, those in category 2 in the 40% to 70% range, those in category 3 in the 70% to 90% range and those in category 4 in the 85% to 95% range. What this means is that all other things being equal the potential earnings at scale for these will depend more on its business model than on the sector.
To test our theory of whether using a multiple of Gross Margin was a better measure of value than a multiple of revenue, we plotted the relationship between growth and valuation using each of these methods. It turns out there is a correlation between valuation as a multiple of revenue based on revenue growth regardless of industry. We found the correlation coefficient for it to be 0.36, an indication of a moderate relationship. This was still far better than the correlation between slow growth and high growth plays that just happen to be in the same industry. So, I believe (based on evidence) that growth is a better indicator of multiple than industry sector.
In that same post we plotted the relationship between revenue growth and valuation as a multiple of gross margin dollars (GMD). For the remainder of this post I’ll use multiple to mean the multiple of GMD. Since it seemed obvious that GM% is a better indicator of future earnings than revenue, I wasn’t surprised that the correlation coefficient was a much higher 0.62, an indication of a much stronger relationship. While other factors like dependability of revenue, market size, perceived competitive advantage and more will affect the multiple, I decided that this method of assessing valuation was strong enough that I use the resulting least square regression formula as a way of getting a starting approximation for the value of a company that has yet to reach “business model maturity”.
Why Contribution Margin is a better indicator than Gross Margin of future earnings.
The reason the correlation coefficient between GMD multiples and revenue growth is 0.62 rather than a number much closer to 1.0 is that a number of other factors play a role in determining future earnings. For me, the most important one is Contribution Margin, which considers the marketing/sales cost spent each month to help drive revenue (think of it as GMD minus marketing/sales cost). Contribution Margin indicates how quickly the benefits of scaling the business will enable reaching mature earnings. When I look at a company that has low contribution margins it is difficult to see how it can generate substantial profits unless it can improve gross margin and/or reduce marketing spend as a percentage of sales. That is why the bull story on Spotify is that it will get the music labels to substantially reduce their royalty level (from close to 80%), or for Uber is that it will go to self-driving vehicles or why Blue Apron keeps reducing its marketing spend in an effort to increase contribution margin. The argument then becomes a speculation on why the multiple should be of a “theoretically” higher amount. I would like to plot revenue growth versus the multiple of Contribution Margin to obtain a new least square formula, which I am confident would have a higher correlation coefficient. Unfortunately, many companies do not readily identify variable marketing/sales cost so instead I analyze where it is likely to be, and factor that into how I view valuation.
Other Factors to Consider for Understanding a Company’s Valuation
- Recurring revenue models should have a higher multiple: Business to Business SaaS (Software as a Service) companies usually trade at higher multiples than those with other models that are growing at the same rate. The reason is simple: their customers are likely to stay on their platforms for a decade or more and often increase what they spend over time. This creates a situation where a portion of revenue growth can be sustained even before adding the marketing spend to acquire future customers which in turn should lead to higher Contribution Margins.
- Companies that are in markets that are likely to grow at a high rate for 5 years or more should have higher multiples: If the market a company plays in is growing quickly there is more opportunity to sustain high growth levels for a longer time, leading to a likelihood of greater future earnings.
- Companies with substantial competitive advantage should have higher multiples: Any company that has a product that it is difficult to replicate can elevate its margins and earnings for a long period of time. One of the best examples of this is pharmaceutical companies, where their drug patents last for 20 years. Even after the patent expires the original holder will continue to sell the drug at a much higher price than its generic alternatives and still maintain strong market share.
- Companies that are farther away from generating actual earnings should trade at lower multiples than those that are close or already generating some earnings: The reason for this is obvious to me but it is often not the case … especially for newly minted IPOs. I believe there is considerable risk that such companies will take many years to reach profitability (if they do at all) and that when they do it will only be a modest portion of revenue. I started this post by saying that eventually valuations should reflect the present value of future earnings flows. The longer it takes to get to mature earnings, the lower its present value (see table 2). If tangible earnings started 7 years out (vs immediately) the discounted value of the flow would be reduced by more than half – reflecting that the valuation of the company should be half that of a company with a similar earnings flow that started immediately.
Table 2: Present value of future dollars using a 12% discount rate

How I bet on my Valuation Methodology.
Consider the three recommendations in my last post that have had their IPO between November of 2017 and mid-2019: DocuSign, Stitch fix and Zoom. They all are profitable already. Two are B to B SaaS companies with greater than 100% revenue retention (that means that the cohort of customers they had a year ago, including those that churned, are spending more today than when they started). The third has existing customers increasing their year over spend as well. They are all growing at a strong pace.
SoundBytes
- While I did not include it in my recommended stocks for 2020, I recently purchased shares in Pinterest (at $19.50 per share), one of the three 2019 Unicorn IPOs (of the nine I highlighted in my last post) that was already profitable. Based on my valuation methods it is at a reasonable valuation, grew 47% year over year in its last reported quarter, and appears well positioned to grow at a high level for many years. What I find surprising is the comparison to the valuation of Snap. Snap is growing at roughly the same pace (50% in the last reported quarter), had an adjusted EBITDA loss of nearly 10% in Q3 and yet was trading at nearly double the multiple of GMD.
- I can’t help mentioning that we predicted that Tesla was likely to have a great Q4 in our post in November, based on the long wait time for my getting a model 3 I had ordered, coupled with manufacturing cranking out more expensive model S and X versions for most of the quarter, and that the Chinese factory was starting to produce cars. At the time the stock was $333 per share. Now, after it has risen over 200 points a number of analysts are saying the same thing.
