In days of old (pre 2002 or so) public companies did not provide specific guidance on what the next quarter’s revenue and earnings would be, let alone for a full year. Instead, they would point out a variety of points for analysts to think about in updating their models for the company’s performance, like:
- The new version of Product X is due out in 3 months so this may lower near-term purchases
- Our backlog is building, and we now have the ability to increase supply
- Channel inventory is higher than normal
- Recall in the last new chip cycle gross margin increased over time
At the time the expectation was that each analyst would create their own model of the company’s financials and therefore there would be a wide range of forecasts. Additionally, a company CFO could chat with individual analysts pointing out particular public disclosures the analyst might not have considered in their model. As a result, when the company reported, some analyst forecasts of revenue and earnings might be higher than the reported numbers and others might have been lower. This method of how the Street worked tended to reduce the magnitude of how the company’s stock reacted when earnings were announced.
Today, virtually every company we follow gives pretty specific revenue and earnings guidance. For example, here’s the guidance CrowdStrike gave on their Q1 FY 2026 earnings call:
- Revenue Guidance
- Q2: $1,144.7M to $1,151.6M
- FY 26: $4,743.5M to $4,805.5M
- Non-GAAP Income from Operations
- Q2: $226.9M to $233.1M
- FY 26: $970.8M to $1,010.8M
- Non-GAAP net income per share
- Q2: $0.82 to $0.84
- FY 26: $3.44 to $3.56
Notice the revenue guidance range for the quarter is roughly 0.6% and for the full fiscal year is about 1.3%. The guidance for earnings has a range of about 2 ½% for the quarter and 3 ½% for the full year. Currently (nearly 2 months after this guidance was given), the consensus estimate for earnings is $0.83, exactly in the middle of guidance and the high estimate is one cent above the guidance range, the low 2 cents below. For prospective, for the past 4 quarters the company’s reported EPS averaged over 13% above consensus.
Rules that have compelled most companies to offer specific guidance have essentially put the Company in the business of predicting its own results. As is evident with Crwd, analyst Consensus revenue and earnings forecasts are now usually within or close to the range the company has guided to. It also has led to very wide stock fluctuations post the earnings call if the actual number is even slightly outside the range (especially if it is below the range) or if the new guidance for the next quarter is reduced even slightly. The penalty for missing guidance has motivated most companies to be conservative in the guidance they provide. But to be clear, high growth companies that are not subscription based do not have the same degree of clarity regarding future revenue and earnings that Crwd does.
There is also a penalty for being too conservative in providing guidance. Yesterday Amazon reported Q2 earnings. There quarter was a blowout with revenue nearly 4% above consensus expectations (meaning revenue growth was over 13% as opposed to the 9% expected) and earnings a full 28% above consensus. The company also raised revenue guidance from where Analyst consensus was. But Amazon was cautious on earnings as they were unsure of the impact of President Trump’s tariffs. The following day the stock was down nearly 10%.
When I first became a Wall Street sell-side analyst I thought a company should be able to accurately predict its own results. After all they knew more than anyone about what was happening in their company. But I soon learned there are many unpredictable factors every quarter which meant that most companies, especially high growth ones, don’t actually know precisely what will happen in the next quarter, let alone the full year. For example, when I covered Microsoft in the 1990s, I was the first Analyst to understand the impact of selling product upgrades and as a result my initial forecast of Microsoft earnings was over 30% above the Street average even after I made all my assumptions as conservative as I thought possible (my original estimate was over 40% above consensus). At the time I don’t think the company realized the magnitude of the upgrade cycle as it was the first one where the install-base was large enough to meaningfully impact revenue and earnings. Fortunately for me, my forecast not only proved correct and the company actually achieved my original estimate.
Currently, there are many issues that are somewhat unpredictable due to the difficulty in knowing where Tariffs will eventually wind up, if and when The Fed will modify interest rates, the emergence of AI, multiple international wars, potential trade issues, and more. Some questions various companies must address are:
- Will consumer spending start to drop leading to lower sales?
- Will important new products be ready on schedule?
- Will the rush towards AI continue creating enormous demand for associated chips, storage, AI based application software, data center demand and more? Already, Nvidia has seen enormous growth due to its current leadership in GPUs and AI systems.
- Will self-driving cars become the dominant form of transportation, especially for taxi services like Uber, Lyft, Waymo and Tesla?
- Will inflation abate leading to lower interest rates?
- Will the Israeli Hamas war end in a peaceful solution?
- Will the Russian Ukraine war end soon?
- Will the economy go into a recession?
- Will Covid or some other major new virus shut things down again?
The answers to each of these questions can have a major impact on numerous companies.
The Extreme: Impact of Covid
- The impact of Covid in 2020 meant brick and mortar stores either shut down completely or had a dramatic drop in sales. This in turn caused numerous bankruptcies. At the same time online sellers like Amazon and Shopify saw an unheard-of previously unpredictable surge in sales. Shopify grew revenue 47% in 2019 and in “normal times” would have been expected to have lower growth in 2020. Instead, the “Covid Effect” caused growth to soar to almost 88% 2020 and was over 100% in the peak quarter. Amazon saw a similar surge as its growth rate jumped from 20% in 2019 to 38% in 2020.
- Zoom and DocuSign also saw revenue growth soar in 2020.
- Several drug companies became suppliers of vaccines causing well above normal revenue growth for them.
- Should there be another virus issue causing people to shun going to brick and mortar stores there would once again be a shift in revenue towards online sellers.
Other Deus Ex Machina: Russian and Hamas Invasions
While not as extreme as the impact of Covid, each war led to numerous shifts in revenue.
- Most obviously, arms company suppliers saw a substantial revenue benefit.
- Sales of consumer goods in Europe, especially Germany dropped
- Logistics was impacted
- Loss of supply of goods from the Ukraine and Russia effected prices of many commodities which in turn fueled inflation
More ordinary day to day unpredictable issues
There are issues for every company that can impact their results. A few examples for companies we are invested in:
- A new computer virus that is hard to protect against could cause a surge in adoption for next gen Cyber Security companies like CrowdStrike and Sentinel One leading to above guidance revenue gains.
- An unexpected outage can impact revenue and earnings – which occurred for CrowdStrike in 2024.
- A significant increase in import duties for Chinese manufacturers of Electronic cars could help Tesla and Rivian revenue.
- A drop in interest rates by the Fed could spur home sales and also improve earnings for companies with significant debt. An increase in the volume of home sales would likely cause a large increase in furniture sales.
- A drop in interest rates could result in increased consumer spending helping companies like Amazon, Shopify, Walmart, consumer goods suppliers and more exceed expectations,
- Further delay in dropping interest rates could have the opposite effect causing substantial decline in consumer spending.
- An unexpected shortage of parts could cause a company to be unable to produce the number of units it anticipated manufacturing.
As a VC I have been on the boards of private companies and watched them attempt to forecast results by quarter for the current year and the following one. The actual revenue numbers for the next quarter are often off by over 10% and actual EBITDA is often off by 20% or more. When the company exceeds a revenue forecast in a quarter, they are loath to raise their forecast for the following quarter. If we assume a public (growth) company has some of the same problems, then their very specific guidance for revenue will often turn out to err by 10% or more. Yet even a minor miss can cause the stock to drop by 10% or more the next day!
Why Subscription Based Companies have Better Predictability
Subscription-based companies are a relative exception regarding predictability of the next quarter’s revenue and earnings. Using CrowdStrike as our example, the company held its Q1 FY 2026 conference call on June 3 (just over one month into its second quarter). They disclosed that their subscription ARR at the end of Q1 was $4.44 billion or $1.11 billion per quarter. They signed $194 million in new ARR during Q1. Or about $65M per month. Let’s assume they only signed 60M in May 2025 (before they reported Q1) and that they could recognize 2 ½ months of that in Q2 or over $12M. That would mean that without signing any new subscription business later in the current quarter they would already have $1,123M in subscription revenue known to them and would need $22M more in revenue between additional subscription signings and service revenue to reach the low end of their guidance for Q2 ($1,145M). Since the company recognized over $50M in services revenue in Q1, services alone appears likely to provide enough to get them to the high end of the guidance range without booking any more ARR in June or July. Of course, they will sign more customers during June and July (the remainder of their quarter). It’s easy to see that the company guidance was conservative. And not surprising that Crwd has posted earnings that was an average of 13% higher than consensus estimates over the past 4 quarters.
Automated Trading Exacerbates Volatility
While we believe that providing specific guidance is a significant factor in creating volatility, automated trading tends to be another factor. If automated trading programs react in a similar way to market movement, then large volumes of trades get created that increase the directional momentum of the stock. In essence, this can mean stocks tend to over-react to a small revenue or earnings miss. That is why it is often the case that a large drop (or increase) in the stock price one day is followed by a movement in the opposite direction the next one.
Ergo: The Conundrum
When a high-growth company provides guidance for the year it needs to choose how conservative to be. If it is too conservative and provides guidance that doesn’t show a high enough revenue growth rate to please Analysts, its stock can plunge. Our above discussion of Amazon is a good example. Lowering earnings guidance caused havoc with the stock despite exceptional performance in the reported quarter. Amazon has a history of consistently beating earnings numbers so I’m guessing they did this because of the uncertainty regarding tariffs. I expect the company to outperform the current guidance (and even the prior one). But had they not done this, Analysts would have increased estimates and made it harder for the company to beat numbers potentially causing a future problem for their stock.
Soundbytes
- Silly software design bothers me, especially when it wastes my time. There are many examples, but I want to point out a few in Microsoft Office email as I am on it quite a bit and so every area of poor design affects my efficiency.
- When I open an email with an attachment and then open the attachment, the email then goes into an “open” queue. If I delete the email subsequently it still stays in the queue (it should delete it there as well but doesn’t). Then when I’m going through the queue of previously open emails, I ask it to be deleted. I get a message that it already was deleted, and it stays in the queue. I then need to close it to get rid of it. This adds several unnecessary steps to my process.
- Attachments to an email are often in “protected view”. I can open them (which is where I think the most risk lies of it leading to a virus) but can’t save or print it without an extra step to take it out of protected view.
- Google now has an AI statement in response to many searches. But the way they train the AI relies on very recent past and the answer it often provides is incorrect.
- Comments on the Warriors/Kuminga Stalemate
- The Warriors have yet to resign Kuminga but have made a “Qualifying Offer” of $7.9 million dollars for the 2025-2026 season. By extending such an offer the Warriors now have a Right of First Refusal (ROFR) to sign him. What that means is he can go out as a free agent and negotiate a contract with any NBA team. If he does, the Warriors will have the right to match it and retain him on that contract.
- This creates 4 possibilities:
- Kuminga receives an offer from another team as a free agent and the Warriors have the opportunity to match it. So far this has not occurred because teams don’t have the available capacity to make a compelling offer.
- The Warriors retain his services for one year under the qualifying offer and then Kuminga becomes an unrestricted free agent the following year
- The Warriors and Kuminga agree on a new contract
- The Warriors and Kuminga agree to a “sign and trade” where Kuminga is signed to a contract by the Warriors and simultaneously traded to another team.
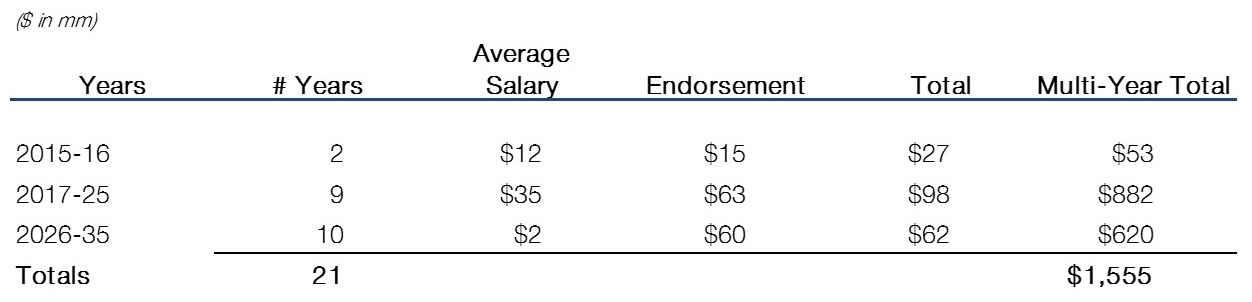
While the sign and trade is Kuminga’s preferred solution, the offers to the Warriors as to what they will receive in such a deal have been insufficient to get them to agree. Instead, they reputedly offered Kuminga a 2-year contract for $45 million. It seems to me that if a sign and trade can’t be worked out this is something Kuminga should sign rather than taking the qualifying offer as it essentially pays him an incremental $37 million (more than he is likely to get per year as a free agent) for agreeing to a second year. Further, it is an amount that will make it easier to make a trade at mid-season if Kuminga is still unhappy.