
After many years of successfully picking public and private companies to invest in, I thought I’d share some of the core fundamentals I use to think about how a company should be valued. Let me start by saying numerous companies defy the logic that I will lay out in this post, often for good reasons, sometimes for poor ones. However, eventually most companies will likely approach this method, so it should at least be used as a sanity check against valuations.
When a company is young, it may not have any earnings at all, or it may be at an earnings level (relative to revenue) that is expected to rise. In this post, I’ll start by considering more mature companies that are approaching their long-term model for earnings to establish a framework, before addressing how this framework applies to less mature companies. The post will be followed by another one where I apply the rules to Tesla and discuss how it carries over into private companies.
Growth and Earnings are the Starting Points for Valuing Mature Companies
When a company is public, the most frequently cited metric for valuation is its price to earnings ratio (PE). This may be done based on either a trailing 12 months or a forward 12 months. In classic finance theory a company should be valued based on the present value of future cash flows. What this leads to is our first rule:
Rule 1: Higher Growth Rates should result in a higher PE ratio.
When I was on Wall Street, I studied hundreds of growth companies (this analysis does not apply to cyclical companies) over the prior 10-year period and found that there was a very strong correlation between a given year’s revenue growth rate and the next year’s revenue growth rate. While the growth rate usually declined year over year if it was over 10%, on average this decline was less than 20% of the prior year’s growth rate. What this means is that if we took a group of companies with a revenue growth rate of 40% this year, the average organic growth for the group would likely be about 33%-38% the next year. Of course, things like recessions, major new product releases, tax changes, and more could impact this, but over a lengthy period of time this tended to be a good sanity test. As of January 2, 2018, the average S&P company had a PE ratio of 25 on trailing earnings and was growing revenue at 5% per year. Rule 1 implies that companies growing faster should have higher PEs and those growing slower, lower PEs than the average.
Graph 1: Growth Rates vs. Price Earnings Ratios
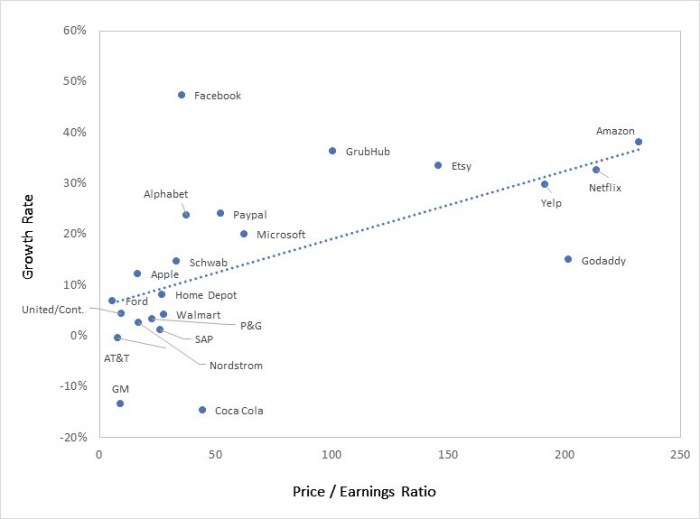
The graph shows the correlation between growth and PE based on the valuations of 21 public companies. Based on Rule 1, those above the line may be relatively under-priced and those below relatively over-priced. I say ‘may be’ as there are many other factors to consider, and the above is only one of several ways to value companies. Notice that most of the theoretically over-priced companies with growth rates of under 5% are traditional companies that have long histories of success and pay a dividend. What may be the case is that it takes several years for the market to adjust to their changed circumstances or they may be valued based on the return from the dividend. For example, is Coca Cola trading on: past glory, its 3.5% dividend, or is there something about current earnings that is deceptive (revenue growth has been a problem for several years as people switch from soda to healthier drinks)? I am not up to speed enough to know the answer. Those above the line may be buys despite appearing to be highly valued by other measures.
Relatively early in my career (in 1993-1995) I applied this theory to make one of my best calls on Wall Street: “Buy Dell sell Kellogg”. At the time Dell was growing revenue over 50% per year and Kellogg was struggling to grow it over 4% annually (its compounded growth from 1992 to 1995, this was partly based on price increases). Yet Dell’s PE was about half that of Kellogg and well below the S&P average. So, the call, while radical at the time, was an obvious consequence of Rule 1. Fortunately for me, Dell’s stock appreciated over 65X from January 1993 to January 2000 (and well over 100X while I had it as a top pick) while Kellogg, despite large appreciation in the overall stock market, saw its stock decline slightly over the same 7-year period (but holders did receive annual dividends).
Rule 2: Predictability of Revenue and Earnings Growth should drive a higher trailing PE
Investors place a great deal of value on predictability of growth and earnings, which is why companies with subscription/SaaS models tend to get higher multiples than those with regular sales models. It is also why companies with large sales backlogs usually get additional value. In both cases, investors can more readily value the companies on forward earnings since they are more predictable.
Rule 3: Market Opportunity should impact the Valuation of Emerging Leaders
When one considers why high growth rates might persist, the size of the market opportunity should be viewed as a major factor. The trick here is to make sure the market being considered is really the appropriate one for that company. In the early 1990s, Dell had a relatively small share of a rapidly growing PC market. Given its competitive advantages, I expected Dell to gain share in this mushrooming market. At the same time, Kellogg had a stable share of a relatively flat cereal market, hardly a formula for growth. In recent times, I have consistently recommended Facebook in this blog for the very same reasons I had recommended Dell: in 2013, Facebook had a modest share of the online advertising, a market expected to grow rapidly. Given the advantages Facebook had (and they were apparent as I saw every Azure ecommerce portfolio company moving a large portion of marketing spend to Facebook), it was relatively easy for me to realize that Facebook would rapidly gain share. During the time I’ve owned it and recommended it, this has worked out well as the share price is up over 8X.
How the rules can be applied to companies that are pre-profit
As a VC, it is important to evaluate what companies should be valued at well before they are profitable. While this is nearly impossible to do when we first invest (and won’t be covered in this post), it is feasible to get a realistic range when an offer comes in to acquire a portfolio company that has started to mature. Since they are not profitable, how can I apply a PE ratio?
What needs to be done is to try to forecast eventual profitability when the company matures. A first step is to see where current gross margins are and to understand whether they can realistically increase. The word realistic is the key one here. For example, if a young ecommerce company currently has one distribution center on the west coast, like our portfolio company Le Tote, the impact on shipping costs of adding a second eastern distribution center can be modeled based on current customer locations and known shipping rates from each distribution center. Such modeling, in the case of Le Tote, shows that gross margins will increase 5%-7% once the second distribution center is fully functional. On the other hand, a company that builds revenue city by city, like food service providers, may have little opportunity to save on shipping.
- Calculating variable Profit Margin
Once the forecast range for “mature” gross margin is estimated, the next step is to identify other costs that will increase in some proportion to revenue. For example, if a company is an ecommerce company that acquires most of its new customers through Facebook, Google and other advertising and has high churn, the spend on customer acquisition may continue to increase in direct proportion to revenue. Similarly, if customer service needs to be labor intensive, this can also be a variable cost. So, the next step in the process is to access where one expects the “variable profit margin” to wind up. While I don’t know the company well, this appears to be a significant issue for Blue Apron: marketing and cost of goods add up to about 90% of revenue. I suspect that customer support probably eats up (no pun intended) 5-10% of what is left, putting variable margins very close to zero. If I assume that the company can eventually generate 10% variable profit margin (which is giving it credit for strong execution), it would need to reach about $4 billion in annual revenue to reach break-even if other costs (product, technology and G&A) do not increase. That means increasing revenue nearly 5-fold. At their current YTD growth rate this would take 9 years and explains why the stock has a low valuation.
- Estimating Long Term Net Margin
Once the variable profit margin is determined, the next step would be to estimate what the long-term ratio of all other operating cost might be as a percent of revenue. Using this estimate I can determine a Theoretic Net Earnings Percent. Applying this percent to current (or next years) revenue yields a Theoretic Earnings and a Theoretic PE (TPE):
TPE= Market Cap/Theoretic Earnings
To give you a sense of how I successfully use this, review my recap of the Top Ten Predictions from 2017 where I correctly predicted that Spotify would not go public last year despite strong top line growth as it was hard to see how its business model could support more than 2% or so positive operating margin, and that required renegotiating royalty deals with record labels. Now that Spotify has successfully negotiated a 3% lower royalty rate from several of the labels, it appears that the 16% gross margins in 2016 could rise to 19% or more by the end of 2018. This means that variable margins (after marketing cost) might be 6%. This would narrow its losses, but still means it might be several years before the company achieves the 2% operating margins discussed in that post. As a result, Spotify appears headed for a non-traditional IPO, clearly fearing that portfolio managers would not be likely to value it at its private valuation price since that would lead to a TPE of over 200. Since Spotify is loved by many consumers, individuals might be willing to overpay relative to my valuation analysis.
Our next post will pick up this theme by walking through why this leads me to believe Tesla continues to have upside, and then discussing how entrepreneurs should view exit opportunities.
SoundBytes
I’ve often written about effective shooting percentage relative to Stephen Curry, and once again he leads the league among players who average 15 points or more per game. What also accounts for the Warriors success is the effective shooting of Klay Thompson, who is 3rd in the league, and Kevin Durant who is 6th. Not surprisingly, Lebron is also in the top 10 (4th). The table below shows the top ten among players averaging 15 points or more per game. Of the top ten scorers in the league, 6 are among the top 10 effective shooters with James Harden only slightly behind at 54.8%. The remaining 3 are Cousins (53.0%), Lillard (52.2%), and Westbrook, the only one below the league average of 52.1% at 47.4%.
Table: Top Ten Effective Shooters in the League
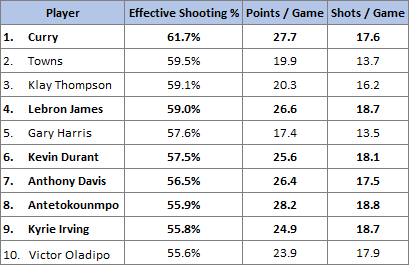
*Note: Bolded players denote those in the top 10 in Points per Game
