2022 was one of the worst years in the past 50 for the stock market in general, and for my stocks in particular. There are multiple ways to look at it. On the one hand I’m mortified that stocks that I selected have declined precipitously not only impacting my personal investment portfolio but also those of you who have acted on my recommendations. On the other hand, I believe this creates a unique opportunity to invest in some great companies at prices I believe are extremely compelling.
What went wrong for my stock picks in 2022? I have always pointed out that I am not amongst the best at forecasting the market as a whole but have been very strong at selecting great companies which over the long term (5 years or more) typically have solid stock appreciation if their operating performance is consistently good. But even great company’s stock performance can be heavily impacted in any given year by market conditions. Two key drivers of negative market conditions in 2022 were the huge spike in inflation coupled by the Fed raising rates to battle it. Inflation peaked at 9.1% in 2022. To put this in perspective, in the 9 years from 2012 to 2020, inflation was between 0.12% and 2.44% with 6 of the years below 2.0%. It began to increase in 2021 (up to 4.7%) but many thought this was temporary due to easing of the pandemic. When the rate kept increasing in the first half of 2022 the Feds began to act aggressively. A primary weapon is increasing the Fed Rate which they did 7 times in 2022 with the total increase of 4.25% being the largest amount in 27 years.
When rates increase the market tends to decline and high growth stocks decline even faster. So, the big question in 2023 is whether the expected additional rate increases projected at just under 1% for the year (which theoretically is built into current share prices) is enough for The Fed. In November, inflation was down to 7.11% and decreased further in December to 6.45%. If inflation continues to ease, The Fed can keep rate hikes in line with or below their stated target and market conditions should improve.
Of course, there is another issue for bears to jump on – the potential for a recession. That is why the December labor report was comforting. Jobs growth remained solid but not overly strong growing at 247,000 for the prior three months. This was substantially lower then where it had been at the end of 2021 (637,000 in Q4). While jobs growth of this amount might lead to wage growth of substance, the growth in December was a fairly normal 0.3%. If this persists, the theory is that inflation will moderate further. Additionally, more and more companies are announcing layoffs, particularly in the Tech sector.
I pointed out above that I am not a great forecaster of economics or of the market as a whole so the above discussion may not mean inflation moderates further, or that Fed Rate hikes stay below a one percent total in 2023, or that we avoid a deep recession – all of which could be further negatives for the market. But given where stocks now sit, I expect strong upside performance from those I recommend below.
I also want to mention that given the deep decline in the market, 2022 was extremely busy for me and the decline in blogs produced has been one of the consequences. I’ll try to be better in 2023! I am going to publish the recap of 2022 picks after the new Top Ten blog is out. Suffice it to say the recap will be of a significant miss for the stocks portion of the forecast, but that means (at least to me) that there is now an opportunity to build a portfolio around great companies at opportune pricing (of course I also thought that a year ago).
Starting in mid-2021 the Tech sector has taken a beating as inflation, potential interest rate spikes, the Russian threat to the Ukraine (followed by an invasion), a Covid jump due to Omicron and supply chain issues all have contributed to fear, especially regarding high multiple stocks. What is interesting is that the company performance of those I like continues to be stellar, but their stocks are not reflecting that.
For 2023, the 6 stocks I’m recommending are Tesla(TSLA), Amazon (AMZN), CrowdStrike (CRWD), Shopify (SHOP), Data Dog (DDOG) and The Trade Desk (TTD). The latter two replace Zoom and DocuSign. While I have removed Zoom and DocuSign from this year’s list, I still expect them to appreciate but their growth rates are substantially below their replacements.
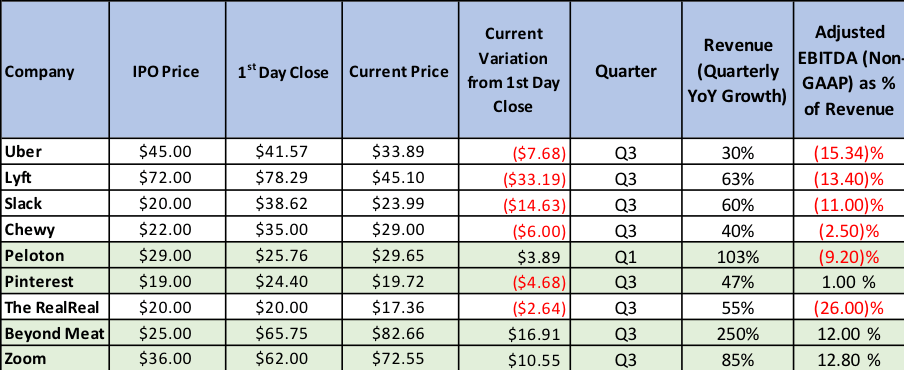
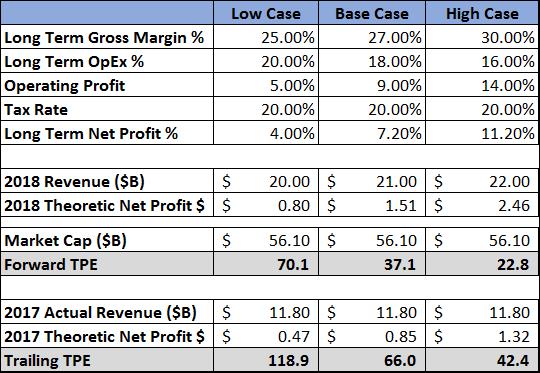
In the introduction to my picks last year, I pointed out that over time share appreciation tends to correlate to revenue growth. This clearly did not occur over in the last 12 months or the last 24 months as illustrated in Table 1.

Note: 2022 for CRWD is actually FY 23 estimated revenue as year end is Jan 31. 2022 revenue uses analyst consensus estimates for Q4 which has on average been lower than actual revenue. Averages are unweighted.
The average revenue gain in 2022 (FY 23 for CRWD) reported by these companies (using analyst estimates for Q4) was nearly 38% while the average stock in the group was down 58%. In 2021 all the stocks except CRWD were up but only Data Dog had higher appreciation than its revenue growth. But in 2022 Data Dog declined significantly despite over 60% revenue growth. If we look at the two-year combined record the average stock in this group had a revenue increase of over 116% with three of the six increasing revenues by over 150%! Yet, on average, share performance for the group was a decline of over 48%. It should also be noted that Amazon’s major profit driver, AWS grew much more quickly than the company as a whole. Another point to highlight is that the strength of the dollar meant that US dollar revenue growth was lower than actual growth on a neutral dollar basis.
While over time I would expect share performance to be highly correlated to revenue growth, clearly that has not been the case for the past 24 months. I look at the revenue multiple as a way of measuring the consistency of valuation. Of course, these multiples should be lower as a company’s growth rate declines but looking at these 6 companies the amount of the decline is well beyond anything usual. Certainly, the pandemic causing wild swings in growth rates is partly responsible in the case of Amazon and Shopify but the other 4 companies have continued to experience fairly usual growth declines for high growth companies and all remain at strong growth levels.
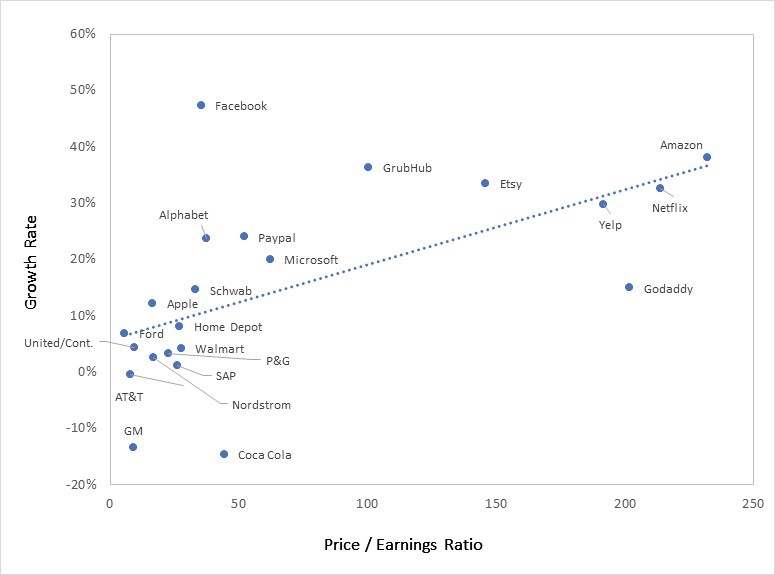
Table 2 shows the change in revenue multiples in 2021 and in 2022 and then shows the 2-year change as well. Over the 2-year period every one of these stocks experienced a multiple decline of at least 60% with three of them declining more than 80%. Even if one assumes that valuations were somewhat inflated at the beginning of 2021 it appears that they all have substantial upside from here especially given that they are all growth companies. Which means if the multiples stabilize at these levels the stocks would appreciate substantially in 2023. If the multiples returned to half of where they were on December 31, 2020, the appreciation would be pretty dramatic.

Notes: 1. CRWD numbers are for fiscal years 2022 and 2023 ending January 31. 2. For Q4 revenue for each company we used Analyst average estimates. 3. All averages are calculated on an unweighted basis.
Given the compression in revenue multiples across the board in tech stocks, the opportunity for investing appears timely to me. Of course, I cannot predict with certainty that the roughly 75% average decline in revenue multiple among these stocks represents the bottom but we never know where the bottom is.
2022 Stock Recommendations
(Note: as has been our method base prices are as of December 31, 2022)
1. Tesla will outperform the market (it closed 2022 at $123.18/share)
Despite revenue growth of over 50%, Tesla was one of the worst stocks in 2022. While Q4 financials have yet to be reported, the company car sales were announced as 405,278 in the quarter up over 31%. For the year, the company shipped over 1.3 million vehicles up 40% over 2021. These volumes are still without Tesla being in the biggest category of vehicles, pickup trucks. Revenue in Q4 is expected to be up more than units with an over 35% increase the analyst consensus (note: Tesla reported last night, and revenue was up 37%).
Earnings have been increasing faster than revenue and consensus earnings estimates for 2022 is over $4 (it came in at $4.07 up 80%), meaning the stock is now trading at about 30 X 2022 earnings. This is a very low level for a high growth company.
One concern for investors is the decrease in the Tesla backlog. At year end it was at about 44 days of production (or roughly ½ of units sold in Q4. While there are many elements to consider there is a concern that it will be difficult for Tesla to maintain an above 30% vehicle growth rate in 2023. But there are several factors that indicate that such a concern is potentially incorrect:
- The US began again offering a $7500 tax credit for electric vehicles starting January 1, 2023. This clearly caused many to postpone their purchase to get the credit. Tesla attempted to offset this by offering a similar discount in the US late in 2022 but it is likely that demand was seriously impacted. In early 2023 Tesla lowered prices to insure more of its units qualified for the credit. While this price decrease lowers average AOV from Q4 it still left most of its units at or above prices one year ago as Tesla had raised prices multiple times in 2022.
- The Tesla CyberTruck has a wait list that exceeds 1.5 million vehicles, which if added to the backlog, would increase it to a full year of vehicles. But, of course, the company needs to get this into production to address these orders. Currently the company is expected to begin production around the middle of this year and get to high volume some time in Q4.
- Tesla has an easy comp in Q2 since China shut down for much of Q2 2022.
- The company now has the manufacturing capacity to increase volumes – the question will be parts supply and whether demand will be strong if the economy goes into a recession.
Since manufacturing capacity increased by the end of Q3, Q4 showed another strong sequential increase in units sold of nearly 18%. Once again demand was not an issue for the company as its order backlog, while lower than at its peak, remained at 6 weeks exiting the quarter. This does not include the estimated 1.5 million units in backlog for the Tesla CyberTruck which would put the total backlog at over one year of current production capacity. The current estimate for this vehicle going into production is roughly mid-year 2023.
Tesla has increased manufacturing capacity with Fremont and China at their highest levels ever exiting Q3, and Berlin and Texas in the early ramp up stage. Despite a reduction of its backlog, demand for its vehicles continues to increase. As you hear of new competition in the electric vehicle market keep in mind that Tesla share of the US market for all cars is still only about 3% and in China and Europe it remains under 2%. As the world transitions to electric vehicles, we expect Tesla’s share of all auto sales to rise substantially, even as it declines in total dominance of the electric vehicle market. It deserves re-emphasis: when the Cybertruck begins shipping, Tesla total backlog could exceed one year of units even assuming higher production. And the Cybertruck current backlog isn’t expected to be fulfilled until late 2027!
As we forecast in prior letters, Tesla gross margins have been rising and in Q3 remained the highest in the industry. While lower vehicle prices and increasing cost of parts will place some pressure on gross margins, we still believe they will continue to remain by far the highest of any auto manufacturer:
- Tesla, like Apple did for phones, is increasing the high margin software and subscription components of sales;
- The full impact of price increases was not yet in the numbers last year, so its price reductions have less impact than their percent of AOV and add-on sales are likely to offset a portion of the decreases;
- As its new factories ramp, they will increase their efficiency; and
- Tesla will have lower shipping cost to European buyers as the new Berlin factory reaches volume production.
In Q4, we believe the Tesla Semi was produced in very small volumes and limited production capacity will mean any deliveries will remain minimal during the next few quarters. However, given its superior cost per mile the Semi is likely to become a major factor in the industry. Despite its price starting at $150,000 its cost per mile should be lower than diesel semis. Given potential of up to $40,000 in US government incentives the competitive advantage over diesels will be even greater. The company is expecting to increase production to about 50,000 per year by some time in 2024 (which would represent potential incremental annual sales in the 8-10 billion range). While this is ambitious, the demand could well be there as it represents a single digit percent of the worldwide market for a product that should have the lowest cost/mile of any in the semi category.
The new version of the roadster is being developed but it’s unclear when it will be ready. Nevertheless, it will become another source of incremental demand at high margins. What this all points to is high revenue growth continuing, strong gross margins in 2023 and beyond, and earnings escalation likely faster than revenue growth. While revenue growth is gated by supply constraints it should still be quite strong. The high backlog helps assure that 2023, 2024 and 2025 will be high growth years. While the company has reduced pricing recently, the ability to sell greater dollars in software should help maintain strong AOV and gross margins
2. Crowdstrike (Crwd) will outperform the market (it closed 2022 at $105.29/share)
The most recently reported quarter for CrowdStrike, Q3 FY23 was another strong one as the pandemic had little impact on its results. Revenue was up 53% and earnings 135%. Existing customers continued to expand use of the company’s products driving Net Revenue Retention to exceed 120% for the 16th consecutive quarter. CrowdStrike now has over 59% of customers using 5 or more of its modules and 20% using at least 7 of its modules. Of course, the more modules’ customers use the bigger the moat that inhibits customer defection.
Older data security technology was focused primarily on protecting on-premises locations. CrowdStrike has replaced antivirus software that consumes significant computing power with a less resource-intensive and more effective “agent” technology. CrowdStrike’s innovation is combining on premise cybersecurity measures with protecting applications in the cloud. Since customers have a cloud presence, the company is able to leverage its network of customers to address new security issues in real time, days faster than was possible with older technology. While the company now has nearly 20 thousand subscription customers it is still relatively early in moving the market to its next gen technology. Given its leadership position in the newest technology coupled with what is still a modest share of its TAM the company remains poised for high growth.
High revenue growth coupled with 79% subscription gross margins, should mean earnings growth is likely to continue to exceed revenue growth for some time. In Q3 earnings grew 135%. While its stock is being penalized along with the rest of the tech market (its multiple of revenue declined by over 66% in 2022 and 80% in the past 2 years), its operational success seems likely to continue. Once pressures on the market ease, we believe CrowdStrike stock could be a substantial beneficiary.
3. Amazon will outperform the market (it closed 2022 at $84.00/share)
Amazon improved revenue growth in Q3 to 15% from 7% in Q2. In constant currency (taking out the impact of the increased strength of the dollar) its growth was 19% versus 10% in Q2. However, the company guidance for Q4 unnerved investors as it guided to Q4 revenue growth of 2-8% year/year and 4.6% higher in constant currency. Because AWS, which grew 27% y/y in Q3 is a smaller part of revenue in Q4 than other parts of the year, the weaker consumer growth can tend to mute overall growth in Q4. As the company heads into 2023 it should benefit from weaker comps and we expect revenue growth to improve from Q4. Of course, the Fed pushing up interest rates is likely to slow the economy and Analysts are currently predicting revenue growth of about 10% in 2023 (which would be higher in constant currency). But it’s important to understand that the profit driver for the company is AWS which generates nearly all the profits for the company. Even in a weaker economy we would expect AWS revenue to grow over 20%.
While Amazon is not the “rocket ship” that other recommendations offer, its revenue multiple has slipped by over 60% in the past 2 years. We believe improved growth coupled with smaller Fed increases should benefit the stock. One important side point is that the fluctuation in Rivian stock impacts Amazon earnings and Rivian was down quite a bit in Q4.
One wild card for the stock is whether its recent 20 for 1 stock split will lead to its being included in the Dow Jones Index. Because the index is weighted based on stock price Amazon could not be included prior to the split as its weight (based on stock price) would have been around 30% of the index. Given its share price post-split it is now a good fit. The Dow Index tries to represent the broad economy so having the most important company in commerce included would seem logical. Changes in the composition of the index are infrequent, occurring about once every 2 years, so even if it gets included it is not predictable when that will occur. However, should it occur, it would create substantial incremental demand for the stock and likely drive up the price of Amazon shares.
4. The Trade Desk (TTD) will outperform the market (it closed 2022 at $44.83/share)
TTD provides a global technology platform for buyers of advertising. In the earlier days of the web, advertisers placed their ads on sites that had a large pool of users that met their demographic requirements. These sites were able to charge premium rates. TTD and others changed this by enabling an advertiser to directly buy the demographic they desired across a number of sites. This led to lower rates for advertisers and better targeting. Now with the rise of Connected TV TTD applies the same method to video. By moving in this direction advertisers can value and price data accurately. Given its strength of relationships, TTD has become the leader in this arena. The company believes that we are early in this wave and that it can maintain high growth for many years as advertisers shift to CTV from other platforms that have been more challenged due to government regulations regarding privacy as well as Apple changes for the iPhone.
In Q3 The Trade Desk grew revenue 39% and earnings 44% as their share of the advertising market continued to increase. We believe TTD can continue to experience strong growth in Q4 and 2023. We also believe after having its revenue multiple contract 70% over the past 2 years the company can also gain back some of that multiple.
5. DataDog will outperform the market (it closed 2022 at $73.50/share)
Datadog is an observability service for cloud-scale applications, providing monitoring of servers, databases, tools, and services, through a SaaS-based data analytics platform. Despite growing revenue close to 60% and earnings about 100% its stock still declined about 59% in 2022 due to the rotation out of tech stocks driven by the large Fed Rate increases. The company remains in a strong position to continue to drive high revenue growth and even higher earnings growth going forward.
6. Shopify (Shop) will outperform the market (it closed at $34.71/share)
Shop, like Amazon, experienced elevated growth in 2020 and the first half of 2021. This was due to Covid keeping people out of stores (many of which weren’t even open) and resulted in revenue escalating 86% in 2020 from 47% in 2019. The rate tapered off to a still elevated 57% in 2021 with Q4 at 41%. The elevated comps resulted in a decline in growth to below normalized levels once consumers returned to Brick & Mortar stores. By Q2, 2022 year over year revenue growth had fallen to 16%. We expected growth to return to over 20% and potentially stabilize there. This occurred in Q3 as revenue growth improved to 22%. We believe Shopify can continue to achieve stable growth in the 20% range or higher in 2023 as long as the economy does not go into a deep recession. Shopify has established a clear leadership position as the enabler of eCommerce sites. Its market share is second to Amazon and well ahead of its closest competitors Walmart, eBay, and Apple. Net revenue retention for the company continues to be over 100% as Shopify has successfully expanded services it provides to its eCommerce business customers. Additionally, because successful eCommerce companies are growing, Shopify also grows its portion of the customer revenue it shares.
Because of the wild swing in growth due to Covid, Shop experienced the most extreme multiple compression of the 6 stocks we’re recommending, 79% last year and 84% over the past two years. This leaves room for the stock to appreciate far beyond its growth rate in 2023 if market conditions improve.
Non-Stock Specific Predictions
While I usually have a wide spectrum of other predictions, this time I wanted to focus on some pressing issues for my 3 predictions that are in addition to the fun one. These issues are Covid, inflation and California’s ongoing drought. They have been dominating many people’s thoughts for the past 3 years or more. The danger in this is that I am venturing out of my comfort zone with 2 of the 3. We’ll start with the fun prediction.
7. The Warriors will improve in the second half of the current season and make the Playoffs
I always like to include at least one fun pick. But unlike a year ago, when I correctly forecast that the Warriors would win the title, I find it hard to make the same pick this year. While I believe they can still win it, they are not as well positioned as they were a year ago. This is partly because a number of teams have gotten considerably better including Memphis, Denver, the Kings and New Orleans in the West (with the Thunder, an extremely young team appearing to be close) and the Celtics, Bucks, Nets and Cavaliers in the East. The Warriors, by giving up Otto Porter and Gary Payton II (GPII), and other experienced players, took a step backwards in the near term. I believe signing Divincenzo gives them a strong replacement for GPII. They will need Klay and Poole to play at their best and Kuminga to continue to progress if they are to have a stronger chance to repeat.
8. Desalination, the key to ending long term drought, will make progress in California
It’s hard to believe that California has not been a major builder of desalination plants given the past 7 years of inadequate rainfall. Despite the recent rainfall, which might bring reservoirs back to a normal state by summer, it appears to be a necessary part of any rational long-term plan. Instead, the state is spending the equivalent of over one desalination plant per mile to build a high-speed railway (HSR) ($200 million per mile and rising vs $80 million for a small and up to $250 million for a very large desalination plant). When voters originally agreed to help fund the HSR the cost was projected at $34 billion dollars. According to the Hoover Institute, the cost has grown to over triple that and is still rapidly rising. If I had my druthers, I would divert at least some of these funds to build multiple desalination plants so we can put the water crisis behind us. Not sure of how many are needed but it seems like 10 miles of track funding 10 larger plants would go a long way towards solving the problem. It is interesting that Israel has built plants and has an abundance of water despite being a desert.
9. Inflation will continue to moderate in 2023
The Fed began raising rates to combat inflation early in 2022, but it didn’t peak until June when it reached 9.1%. One trick in better understanding inflation is that the year over year number is actually the accumulation of sequential increases for the past 12 months. What this means is that it takes time for inflation to moderate even when prices have become relatively stable. Because the sequential inflation rates in the second half of the year have been much lower than in the first half, inflation should keep moderating. As can be seen from Table 3, the full year’s increase in 2022 was 6.26% (which is slightly off from the announced rate as I’ve used rounded sequential numbers). The magnitude of the increase was primarily due to the 5.31% increase from January 1 through June 30.
If the second half of the year had replicated this, we would be at over 11% for the year. However, the Fed actions have taken hold and in the second half of the year (July 1 – December 31) inflation was down to 0.90% or an annualized rate of under 2.0%. And between November 1 and December 31 we had complete flattening of sequential cost. What this indicates to me is that the likelihood of inflation moderating through June 30, 2023 is extremely high (no pun meant). If I were to guess where we would be in June, I’d speculate that the year/year increase will be between 1% and 3%.

10. Covid’s Impact on society in the US will be close to zero by the end of 2023
Covid has reached the point where most (roughly 70%) of Americans are vaccinated and we estimate that over 75% of those that aren’t have already been infected at some point and therefore have some natural immunity. This means about 92% of Americans now have some degree of protection against the virus. Of course, given the ongoing mutation to new forms of Covid (most recently to the Omicron version) these sources of immunity do not completely protect people and many who have been vaccinated eventually get infected and many who already had Covid got reinfected. However, if we study peak periods of infection there appears to be steady moderation of the number of infections.
Covid infections reached their highest peak in the US around January 2022 at a weekly rate of approximately 5 million new cases. It subsequently dropped steadily through May before rising to another peak, fueled by Omicron, in July 2022 at a weekly rate of about 1 million (an 80% peak to peak decrease). Again, it subsequently dropped until rising more recently to a post-holiday/winter peak in early January 2023 to a weekly count of under 500,000 (a peak-to-peak drop of over 50% from July).
While the progress of the disease is hard to forecast the combination of a more highly vaccinated population coupled with a high proportion of unvaccinated people now having some immunity from having contracted the disease seems to be leading to steady lowering of infection rates.
More importantly, death rates have declined even faster as lower infection rates have been coupled with milder cases and better treatments (due to vaccinations and natural immunity increases for the 50% of the population that have contracted the disease over the past 3 years). Despite the recent post-holiday spike, deaths from Covid were under 4,000 across the country (or about 0.001% of the population) in the most recent week reported. If the seasonal pattern follows last year, this will be a peak period. So, using this as being very close to the likely maximum rate per week, we can forecast that the annual death rate from Covid in 2023 will be between 100,000 and 200,000 Americans. This would put it between the 4th and 6th leading causes of death for the year with heart disease and Cancer the leading causes at over 600,000 each.
Given that most people have already significantly reduced use of masks and are visiting restaurants, department stores, theaters, sporting events, concerts and numerous other venues where people are quite close to each other, we believe the impact of Covid on the economy has faded and that 2023 will be a relatively normal year for consumers. Of course, the one wild card, which I believe has a low probability of occurring, is that a new variant causes a surprising massive spike in deaths.