Why spending on branding can be a key to long-term success

A friend called me the other day and inquired as to whether I was ok, as I had not posted in several months. While my goal has been to do about 10 blog posts per year, my frequency has always been erratic, and this year has really been sparse. To make things up, I am going to try for 2 new posts in the next 3 weeks or so that stem from the Azure Marketing Day, held each year for our portfolio companies to gain exposure to advanced techniques across multiple marketing areas. Since the speakers are truly knowledgeable of their arena, using one or two talks as a basis of a post makes me look good!

This post will focus on branding and how to measure whether it is working. The next will delve into direct (snail mail) marketing and how some companies are finding it quite effective.

How to measure the efficacy of brand campaign spend

Spending on branding is quite different than spending for customer acquisition. While many ads serve both purposes, the difference is based on whether there is a direct call for action…usually to buy something. For simplicity, I assume that if there is a call for action, the ad is for customer acquisition, if there is no call for action the ad is for branding.

By improving their brand, a company can experience:

  1. Higher conversion rates on its customer acquisition spend
  2. An increase in the number of people who visit their site
  3. An increase in the LTV (lifetime value) of customers

One method of measuring whether a branding campaign is effective is to determine whether people in the geography where the marketing takes place become more aware of the brand. This is done by measuring the awareness of the brand both before and after the campaign. The most common measure for younger companies is called “Aided Brand Awareness”. Aided brand awareness is determined by conducting a survey of a statistically significant random sample of the population of the geography. In the survey, each person is asked to say which of a list of products/companies they recognize. The percentage that picks the product or company as one they know of is designated as the Aided Brand Awareness.  Most TV ads are for improving brand awareness, whereas a large proportion of online ads are for customer acquisition.

While it may seem surprising now, when I was on Wall Street covering Microsoft (and others), Bob Herbold, Microsoft COO, believed a lack of universal brand awareness was limiting the company. So, Microsoft engaged in a significant spend to raise its brand awareness from well below 50% (as I recall) before the campaign. It was one of the many smart strategies the company used to become what they are today. An improved brand helped drive a massive gain in market share for Microsoft productivity applications.

At the Azure Marketing Day, Chris Bruzzo, EVP Marketing and Commercial at Electronic Arts, provided a session on the importance of branding. He outlined one method of testing the potential effectiveness of a branding campaign without breaking the bank. He suggested, if possible, to start by picking matched geographies for a test. You then conduct the branding campaign in the test location and compare results to the control (the second location). By limiting the test to a few geographies, the cost can be kept reasonable while acquiring information on how much impact a branding campaign could have on your company. EA found advertising to improve its brand was quite effective. While I can’t cite EA data due to a public company’s need for confidentiality, I can say it led to higher customer Life Time Value and an increase in the success of customer acquisition campaigns in the test geographies. I have been given permission to review a similar test conducted by Azure portfolio company Chairish.

Chairish recently conducted a test of whether spending on branding would prove beneficial. They decided to select 3 cities for the test. For confidentiality, I’ll refer to them as Test Cities 1, 2 and 3. Each was measured against a control city where no branding spend was done. The paired cities, control cities 1, 2 and 3, respectively, each had similar population demographics to the test city it was paired with. The first measurement of benefit was the change in Aided Brand Awareness. Pre-campaign the test cities averaged 6% awareness and the control cities 8%. Post campaign the test cities increased to 13% awareness and the control cities to 9%. So, the lift for the test cities was 7% and for the control cities 1%. I believe that the control cities represented the natural gain the company was getting without a branding campaign, while the branding campaign added an additional 6% of the population to those aware of its brand.

Comparing Test Cities to Control Cities for Branding Campaign  

The table shows the average benefit of the marketing campaign across the test cities when compared to their matched control. For example, during the test period the increase in average overall revenue was 23% greater in the test cities than in their paired control locations. A month later, the difference in gain had improved to 25.8%. The reason for such large revenue gains stems from some of the other metrics measured, especially the massive gain in registrations because of the branding campaign.

Given these results, Chairish will be increasing its spend on branding. For those of you who decide to try a branding campaign, it is important to make sure you can measure results. Once the results are in hand, the next step is to compare revenue and gross margin dollar gains to the cost of the campaign. This allows a company conducting a branding campaign to understand the initial incremental cost and the time to recover the investment. Having that in hand allows for a reasonable forecast of the cash flow implications of increasing the spend for branding. One caveat is, while hard to forecast, there is also often the benefit of an increase in customer LTV (life-time value) as greater awareness of the brand also spurs more visits (and spend) from existing customers but this is more difficult to measure in the short run.

While mature companies typically spend a portion of advertising on branding and conduct these types of Aided Brand Awareness measures many younger companies do not consider this. As companies cross the $20-30 million threshold, we believe they should consider experimenting with a brand spend in the manner discussed in this post. Many will find that it is another valuable tool to use as part of marketing spend.

Soundbytes

In our post on September 10, 2020, A Counter Theory to Potential Recession (during week 26 of Shelter in Place), we advocated a counter-theory to widespread predictions that there would be a recession as the pandemic ebbed, stating:

“Much of the public dialogue concerning the economic effect of Covid19 has centered around the large number of people who have lost income, with the conclusion that the US will potentially experience a continued recession going forward. What seems to be lost in the discussion is that the 90% of the labor force that is employed is saving money at an unprecedented rate. This has occurred partly through fear of future loss of income but mostly by a reduction in spending caused by the virus.”

We estimated that consumers would save trillions of incremental dollars if Covid lasted through year end. And that a large portion of it would subsequently be spent on furniture, luxury items, vacations and more. This is now occurring, leading to substantial increased demand for many goods and services and inflationary pressure.

The pressure of this increased spend coupled with continued supply chain issues due to Covid provides the opportunity to keep prices firm (or even increase them) as demand will outstrip supply in many sectors, possibly through year end. 

The Impact of Gen Z on Marketing

Azure Marketing Day

Each year, Azure hosts a marketing day for CMOs and CEOs of its consumer-facing portfolio companies. This year, on February 27th, we had sessions on the following topics:

  • Refreshing Your Brand as the Business Grows
  • Metrics for Evaluating Successful Marketing
  • Leveraging Comedy to Lower Customer Acquisition Cost
  • Know the Next Generation: An introduction to Gen Z
  • The Benefits and Drawbacks of a Multi-Channel Strategy
  • Influencer Strategies
  • Optimizing Pinterest

I presented the one on Metrics, but the other sessions are conducted by a combination of portfolio executives and outside speakers, each a leading thinker on the topic. Since I invariably learn quite a lot from other speakers, it seems only fair to borrow from their talks for a few blog posts so that I can share these benefits.

Much of this post will be based on concepts that I found especially enlightening from the session by Chris Bruzzo, the current CMO of Electronic Arts, on knowing Generation Z. I won’t cite each place I am using something from Chris versus my own thoughts; but you can assume much of the content emanates from Chris. Since Chris is one of the most creative thinkers in marketing, I’m hoping this will make me look good!

Marketers have Defined Generational Characteristics

Marketers often use personas to help understand what they need to do to address different types of customers. A persona may be:

  • A married woman 35 years old with a job and 2 children aged 6 and 9;
  • A 16-year-old male who is a sophomore in high school;
  • A non-working woman aged 50

A great deal of research has been done on the characteristics of particular “personas” to better enable a company to create and market products that meet their needs. One categorization of people is by age, with 5 different generations being profiled. The youngest group to emerge as important is Gen Z, roughly defined as those born between 1995 and 2012. Currently the U.S. population over 12 years old is distributed as follows:

What this means is that Gen Z has become a significant portion of the population to consider when creating and marketing products. With that in mind, let’s compare several characteristics of the youngest three of these groups.

Source: EA Research

Gen Z is the first generation that are digital natives. They are profiled as having cautious optimism, wanting to be connected, seeking community and wanting to create and control things. Earlier generations, including Millennials, watched TV an increasing number of hours, often multi-tasking while they did. Gen Z has replaced much of TV watching with device “screen time”, including visiting YouTube (72% of Gen Z visit it daily). When asked “What device would you pick if you could have only one?”, GenZers chose the TV less than 5% of the time. Prior generations respond well to email marketing while Gen Z needs to be reached through social media. Gen Z has little tolerance for barriers of entry for reaching a site and will just move on (I feel the same way and think many members of other generations do as well).  So, when targeting new customers (especially Gen Z) remove barriers to entry like requiring registration before a user becomes a customer. It is important to demonstrate value to them first.

Gen Z grew up in an era where the Internet was part of life and smart phones were viewed as essential… rather than a luxury. On average they spend 40% of their free time on screens. What is even more eye opening is that 91% go to bed with their devices. Advertisers have responded to these trends by gradually shifting more of their spend online. This has been difficult for newspapers and magazines for quite a while, but now it is also having a major impact on flattening out the use of TV as an advertising medium.

There are several implications from the numbers shown in the above chart. First, it is very clear to see that newspapers and magazines as we know them are not viable. This has led to iconic players like the New York Times and Fortune monetizing their brands through conferences, trips, wine clubs, and more. Lesser known brands have simply disappeared. In 2018, TV revenue continued to grow slightly despite losing share as the smaller share was of a larger pie. But in 2019, TV advertising dollars declined, and the decline is forecast to continue going forward. Several factors can be attributed to this but certainly one is that brands targeting Gen Z are aware that TV is not their medium of choice. One unintended consequence of major brands shifting spend to the Internet is that because they are less price sensitive to cost than eCommerce companies, this has led to higher pricing by Facebook and Google.

Personalization is Becoming “Table Stakes” and Offering Co-Creation is a Major Plus

Consumers, in general, and especially Gen Z, are demanding that brands do more to personalize products to their needs and interests. In fact, Gen Z even wants to participate in product creation. One example involves Azure portfolio company Le Tote. The company, much like Stitch Fix, uses algorithms to personalize the clothing it sends based on specifics about each customer. When the company added the ability for consumers to personalize their box (from the already personalized box suggested by the algorithm) there was a sizeable spike in satisfaction…despite the fact that the items the consumer substituted led to a decline in how well the clothes fit! This example shows that using customer data to select new items is only a first step in personalization. Letting the customer have more of a say (be a co-creator) is even more important. 

Conclusions

  1. Startups need to diversify their marketing spend away from Facebook and Google as the ROI on these channels has contracted. At the Azure marketing day, we highlighted testing whether Pinterest, influencers, brick and mortar distribution and/or comedy might be sources that drive a higher ROI.
  2. If Gen Zers are being targeted, YouTube, Snap, Instagram, and Twitch are likely better places to market
  3. When targeting new customers (especially Gen Z) remove barriers to entry like requiring registration before a user becomes a customer. It is important to demonstrate value to them first.
  4. Build great apps for iPhones and Android phones but what is becoming most important is making sure that smart phones work well on your site without requiring an app, as most Gen Zers will use their phones for access. When they do, the mobile web version needs to be strong so that they don’t need to download your app before discovering the value you offer.
  5. Involve customers as much as possible in the design/selection/creation of your products as this extends personalization to “co-creation” and will increase satisfaction.

Soundbytes

  • Readers are aware that I invest in growth stocks (some of which I suggest to you) to achieve superior performance. What you may not be aware of is that over the past 25 years my strategy for investing has been to put the majority of capital in A or better rated municipal bonds (Munis) to generate income in a relatively safe way (and I believe everyone should diversify how they apportion capital). I use a complex strategy to generate superior returns and in the past 25 years I have earned, on average, between 4% and 5% tax free annually.  But in the current environment new investments in Munis will have much lower yields so I have started to look at “safe” alternatives to generate income. This type of investment is for income generation and involves a different category of stocks than the growth stocks I target for high returns through stock appreciation.
  • Given the recent downturn in the stock market I did my first “bond alternative” investment earlier this week. My goal is to generate income of over 5% on an after-tax basis in stocks that are “safe” investments from the point of view of continuing to deliver dividends at or above current levels.
  • My first set of transactions was in Bristol Myers Squibb:
    • I bought the stock at $56.48 where the dividend is 3.2% per year
    • I sold Jan 21 calls at a strike price of 60 and received $4.95
    • If the stock is not called my cash yield, including $1.80 in dividends, would be $6.75 over less than one year which would equal 12% before taxes
    • I also sold Jan 21 puts at a strike price of $55 and received $6.46. If the stock is not put to me and is not called that would increase my one-year yield to over 23% of the $56.48 stock price and I would repeat the sale of calls and puts next year. Since my net cost was $43.27 the percentage yield would be over 30% of my cash outlay.
    • If the stock was called my net gain would equal the profit on the stock, the dividends for one year plus the premiums on the options and would exceed 30%
    • If the stock went below $55 and was put to me at that price I would be ok with that as the new shares would have a net cost of just over $49 with a dividend yield of close to 4.0% (assuming the company follows past practice of raising dividends each year) and I could sell new puts at a lower strike price.  
  • The second stock I invested in for income is AT&T.
    • I bought the stock at $34.60 where the dividend is 6.0% per year
    • I sold Jan 21 calls at a strike price of $37 and received $2.05 per share
    • If the stock is not called my year 1 cash yield would be $4.13 per share over less than a year or about 12% before taxes
    • I also sold Jan 21 puts with a strike of $32 and received $3.30 per share. If the stock is not put to me and is not called, that would increase my one-year yield to over 20% of the stock price and over 25% of the net cash outlay
    • If the stock was called, I would only have 3 quarters of dividends, but the gain would be over 30% of my net original cash outlay
    • If the stock was put to me my cost of the new shares, after subtracting the put premium would be $28.70 and the dividend alone would provide a 7.2% pre-tax yield and I could sell new puts at a lower price.
  • We shall see how this works out but unless they cut the dividends, I won’t worry if the stock is lower a year from now as that would only increase my yield on new stock purchased due to the puts. The chance of either company cutting dividends seems quite low which is why I view this as a “safe” alternative to generate income as I won’t sell either stock unless they are called at the higher strike price.
  • I also began reserving capital starting about a month ago as I expected the virus to impact the market. These purchases used about 10% of what I had put aside. I put another 15% to work on Friday, March 13 as the market had fallen further and valuations have become quite attractive – remember the secret is to “buy low, sell high”. When the market is low its always scary or it wouldn’t be low! I do confess that I didn’t sell much when it was high as I tend to be a long-term holder of stocks I view as game changers…so I missed the opportunity to sell high and then repurchase low.

Calculating and Acting on the Right KPIs is Critical for Success

Advanced metrics for Customer Acquisition Cost (CAC) and Lifetime Value (LTV)

What is the purpose of CAC, LTV and Payback Period?

Often entrepreneurs we meet have a list of their KPI’s, but as we dig deeper, it becomes clear that they don’t fully comprehend the purpose of the KPI or why we think that they are so critical in helping us understand the health of a business. I’m a believer in thoroughly understanding the economics of your business, and the metrics around Customer Acquisition Cost (CAC), Customer Lifetime Revenue (LTR), Customer Lifetime Value (LTV) and Payback Period are important metrics to work on improving. In this post we use the word customer to mean a ‘buyer’, someone who actually orders product and will use customer and buyer interchangeably.

  • LTR (Customer Lifetime Revenue) is the total revenue from a customer over their estimated lifetime (we prefer using 5 years as representing lifetime)
  • MCA (Marketing Spend for Customer Acquisition) is the marketing cost directed towards new customer acquisition
  • CAC (Customer Acquisition Cost) captures the cost of acquiring a new buyer
  • LTV (Customer Lifetime Value) is the estimated lifetime profits on new customers once they have been acquired
  • Net LTV is the estimated lifetime profits on a new customer taking acquisition cost into account or: LTV – CAC
  • Payback Period is the time for a new customer to generate profits that equals his or her CAC

When LTV is compared to CAC a measure of the future health of the business can be seen. Most VCs will be loath to invest in any company where the ratio of LTV/CAC is less than 3X and enthusiastic when it exceeds 5X. I also favor companies with a short payback period especially if the recovery is from the first transaction as this means almost no cash is consumed when acquiring a customer.

I have previously written about Contribution Margin (gross margin less marketing and sales spend) being one of the most important metrics for companies as it tells me how scaling revenue will help cover G&A and R&D costs. Once Contribution Margin exceeds these costs there is operating profit. A company with low Contribution Margin needs much greater scale to be able to reach profitability than one with high Contribution Margin. Both the LTV/CAC ratio and Payback Period are important predictors of future Contribution Margin levels. Table 1 shows two companies with the same revenue, R&D and G&A cost. Assuming R&D and G&A are fixed for both, at 5% Contribution Margin Company A would need to reach $50 million in revenue to break-even while Company B would be at break-even at under $4 million in revenue given its 65% Contribution Margin.

Break Even Revenue = (R&D + G&A)/ (Contribution Margin %)

For Company A = $2,500,000/ (5%) = $50,000,000

For Company B = $2,500,000/ (65%) = $3,846,154

The problem for Company A stems from the fact that for every $40 spent in acquiring a customer the total LTV (or subsequent profits on the customer) is only $76 making Net LTV $36. With such a low ratio of LTV/CAC, Contribution Margin is also quite low. I’ve chosen two extremes in gross margin to better illustrate the impact of gross margin on Contribution Margin. 

Table 1: Illustrative Example on the Importance of Contribution Margin

In a second example, Table 2, we show the impact of much more efficient marketing and remarketing on a company’s results. We assume gross margin, R&D and G&A are the same for Company C and Company D, but that Company D is much more efficient at acquiring and retaining customers, resulting in a lower CAC and a higher LTR and LTV for Company D. This could be due to higher spending on branding and remarketing, but also because they are very focused on the metrics that help them optimize acquisition and LTR. The result is considerably higher LTV/CAC and significantly higher Contribution Margin. 

Table 2: Impact of Efficient Marketing & Remarketing on a Company’s Results

A few rules regarding Contribution Margin

  1. Higher Gross Margin means greater opportunity for high Contribution Margin – for example, Company A at 20% Gross Margin is severely limited in reaching a reasonable Contribution Margin while Company B at 80% Gross Margin has an opportunity for high Contribution Margin and can reach profitability at lower revenue levels
  2. Companies with many new customers acquired through “free” methods like SEO, viral marketing, etc. have higher Contribution Margins than similar companies with a low proportion of free acquisitions.  Notice Company D can spend less on marketing than Company C because it acquires half of its customers from free sources whereas Company C has none from free sources.
  3. Returning buyers contribute heavily to Contribution Margin since they require little if any marketing cost. A high LTV/CAC ratio usually means customers return more often, which in turn should increase future Contribution Margin. Company D with its very high LTV/CAC likely has much lower churn than Company C and therefore most of its marketing spend is for adding incremental customers rather than just replacing those that churn. If a company simply stopped spending on marketing, its revenue would be from existing customers and new customers acquired from free methods making Contribution Margin roughly equal to Gross Margin. Of course, lack of marketing could have a major impact on future growth
  4. All other things being equal, companies with short Payback Periods tend to have higher Contribution Margin than those with longer Payback Periods

Marketing Spend on Branding versus Customer Acquisition

Branding is the communication of characteristics, values and attributes of an organization and its products. What is the purpose of spending on branding?  To create a strong image of the company and its products so that existing customers want to stay and spending on customer acquisition will be more efficient. Great brands should have a lower CAC and higher LTV than weak brands.

Nike’s “Just Do It” campaign worked well in establishing a brand message that resonated. Their more recent campaign centered around Colin Kaepernick was riskier as it had pictures of the quarterback and the slogan: “Believe in something even if it means sacrificing everything”. While Kaepernick is controversial, he appeals to a large part of the Nike existing and potential buying audience. The campaign helped lift sales by 27% in the first 4 days following the ad launch. Karen McFarlane, founder Kaye Media Partners summed up Nike’s strategy: “Nike’s mission is to bring inspiration and innovation to every athlete in the world. Colin Kaepernick, through his advocacy, conviction, and talent on and off the field, exemplifies those values in the strongest of terms. Couple that with Nike’s commitment to diversity and community, particularly against the backdrop of today’s America where politics have amplified cultural divisions, Nike took the opportunity to lean into their mission and values.”

Marketing campaigns that are for direct customer acquisition differ from branding campaigns as their goal is to directly acquire customers. It is not always clear whether marketing dollars should be classified as acquisition or branding. The key point is that branding is building for the future, whereas acquisition campaigns are measured by how efficiently they deliver current customers. This brings us back to measuring CAC, as the question becomes whether branding campaigns are part of the calculation of CAC. I believe they are not, as CAC should represent the direct cost of acquiring a customer so that increasing that spend will allow us to estimate how many more customers will result. So, I conclude that marketing for branding should be excluded from the calculation of CAC but can be an important strategy to improve efficiency in acquiring customers and maximizing their value. It should be part of the Contribution Margin calculation.

Paid CAC vs Blended CAC

If CAC represents what it costs to acquire a customer, what about those customers that are acquired through SEO, viral marketing, or some other free method? If one simply divides the spend on Marketing for Customer Acquisition (or MCA) by the total number of new customers, the result will be deceptive if it is used to estimate how many more customers will be acquired if MCA spend is increased. Instead companies should calculate CAC in two ways:

Blended CAC = MCA/ (total number of new customers)

Acquisition CAC = MCA/ (number of new customers generated from acquisition marketing only)

Attribution Models and how they help understand CAC by Channel

CAC helps predict the impact of different levels of spending on marketing. Companies also need to know where spending has the best impact, and therefore need to calculate a CAC (and LTV) for each channel of marketing. If a company uses multiple channels like Facebook, Google, and Snap they need to assign credit to each channel for the customers generated from that channel as compared to the spend for that channel to determine the channel CAC. The most simplistic way of doing this is to say, for example, that Google advertising gets credit for the customer if the purchase by the customer occurs after clicking to the site from Google. But what if a consumer sees a Facebook ad, goes to the site to look at products, then a week later comes back to the site from a Snap ad, and then visits the site again because the company sent them an email that they click on, and finally buys something after clicking on a Google ad?  Should Google get the entire credit for the customer?

Attribution models from companies like Amplitude and Hive attempt to appropriately credit each channel touchpoint for the role it played in acquiring a customer. For example, a company might assign 50% of the credit to the last touchpoint and divide the other 50% equally among prior touchpoints or use some other formula that is believed to capture how each channel participated in driving that consumer towards a purchase. Attribution models attempt to help companies understand how scaling spend in each channel will impact customer acquisition. For example:

Google CAC = (Google marketing spend)/ (number of customers attributed to Google ads)

One question that arises when using attribution models to credit each channel is whether “free” areas should share the credit when both paid and free touchpoints occur before converting a consumer into a buyer. The issue is whether the free touchpoints would have occurred had the company not spent on paid marketing. In my prior example the customer would never have received an email from the company had they not first seen the Facebook and Snap ads so eliminating these ads would also eliminate the email which in turn probably means they never would have become a customer. In a similar way, someone who clicked on a Google ad but did not buy, might later do a search for the product, and go to the site from SEO and then buy. So, one method of assigning attribution would be to divide the entire attribution among paid channels if a consumer touched both paid and free ones before becoming a customer. If the consumer only went to free channels, then they would count in blended CAC but not as a customer in calculating paid CAC or CAC by paid channel.

Where does Marketing to an existing customer fit in?

CAC is meant to measure new customer acquisition. So, marketing to an existing customer to get them to buy more should not be part of CAC but rather should be subtracted from MCA. I view it as a cost that reduces Lifetime Value (LTV). Many startups ignore the possibility of “reactivating” churned customers through marketing spend. Several Azure portfolio companies have seen success in deploying a reactivation strategy. I consider this spend as marketing to an existing customer and resulting profits an increase in LTV. Revising the definition of LTV (see Table 1):

LTV = LTR – COGS – Marketing Costs to existing customers

MCA (Marketing Cost for Customer Acquisition) = Marketing Costs – branding costs – marketing to existing customers

In Table 1, remarketing expense is 1% of Lifetime revenue for both Company A and Company B or:

Company A LTV = (GM% – remarketing%) X LTR = (20% – 1%) X $400 = $76

Company B LTV = (80%– 1%) X $400 = $316

What about new customers that return the product?

This is a thorny issue. If a consumer buys their first product from a company and then returns it, is she a customer? I think it would not be wrong with interpreting this either way. But I prefer considering her a customer as she was a buyer, and while the return zeros out the revenue from that purchase, she did become a customer. There is ample opportunity for marketing to her again. Considering her a customer lowers CAC as there are more customers for the spend, but it also lowers LTV for the same reason. So, if the interpretation is applied consistently over both CAC and LTV, I believe it would be correct.

More mature companies should apply the methods shown here to better understand their business

By better understanding acquisition CAC and LTV of each channel of customer acquisition a company can direct more spending to the most efficient ones (those with the highest LTV/CAC). By experimenting with “reactivation” spending a company can determine if this improves LTV/CAC. Companies that improve LTV/CAC will likely generate higher Contribution Margin. Those that increase the proportion of customers acquired for “free” can also improve Contribution Margin. Improving CAC and LTV can be accomplished in several ways as described in prior posts:

Optimizing the cost of customer acquisition modeling metrics to drive startup success (March 2014)

How to improve Contribution Margin (Nov 2018)

Without proper metrics a company is essentially flying blind and will be far less likely to succeed. This post provides a blueprint towards a more sophisticated approach to understanding any business.

Why Contribution Margin is a Strong Predictor of Success for Companies

In the last post I concluded with a brief discussion of Contribution Margin as a key KPI. Recall:

Contribution Margin = Variable Profits – Sales and Marketing Cost

The higher the contribution margin, the more dollars available towards covering G&A. Once contribution margin exceeds G&A, a company reaches operating profits. For simplicity in this post, I’ll use gross margin (GM) as the definition of variable profits even though there may be other costs that vary directly with revenue.

The Drivers of Contribution Margin (CM)

There is an absolute correlation between GM percent and CM. Very high gross margin companies will, in general, get to strong contribution margins and low gross margin companies will struggle to get there. But the sales and marketing needed to drive growth is just as important. There are several underlying factors in how much needs to be spent on sales and marketing to drive growth:

  1. The profits on a new customer relative to the cost of acquiring her (or him). That is, the CAC (customer acquisition cost) for customers derived from paid advertising compared to the profits on those customers’ first purchase
  2. The portion of new traffic that is “free” from SEO (search engine optimization), PR, existing customers recommending your products, etc.
  3. The portion of revenue that comes from repeat customers

The Relationship Between CAC and First Purchase Profits Has a Dramatic Impact on CM

Suppose Company A spends $60 to acquire a customer and has GM of $90 on the initial purchase by that customer. The contribution margin will already be positive $30 without accounting for customers that are organic or those that are repeat customers; in other words, this tends to be extremely positive! Of course, the startups I see in eCommerce are rarely in this situation but those that are can get to profitability fairly quickly if this relationship holds as they scale.

It would be more typical for companies to find that the initial purchase GM only covers a portion of CAC but that subsequent purchases lead to a positive relationship between the LTV (life time value) of the customer and CAC. If I assume the spend to acquire a customer is $60 and the GM is $30 then the CM on the first purchase would be negative (-$30), and it would take a second purchase with the same GM dollars to cover that initial cost. Most startups require several purchases before recovering CAC which in turn means requiring investment dollars to cover the outlay.

Free Traffic and Contribution Margin

If a company can generate a high proportion of free/organic traffic, there is a benefit to contribution margin. CAC is defined as the marketing spend divided by the number of new customers derived from this spend. Blended CAC is defined as the marketing spend divided by all customers who purchased in the period. The more organically generated and return customers, the lower the “blended CAC”. Using the above example, suppose 50% of the new customers for Company A come from organic (free) traffic. Then the “blended CAC“ would be 50% of the paid CAC. In the above example that would be $30 instead of $60 and if the GM was only $30 the initial purchase would cover blended CAC.

Of course, in addition to obtaining customers for free from organic traffic, companies, as they build their customer base, have an increasing opportunity to obtain free traffic by getting existing customers to buy again. So, a company should never forget that maintaining a persistent relationship with customers leads to improved Contribution Margin.

Spending to Drive Higher Growth Can Mean Lower Contribution Margin

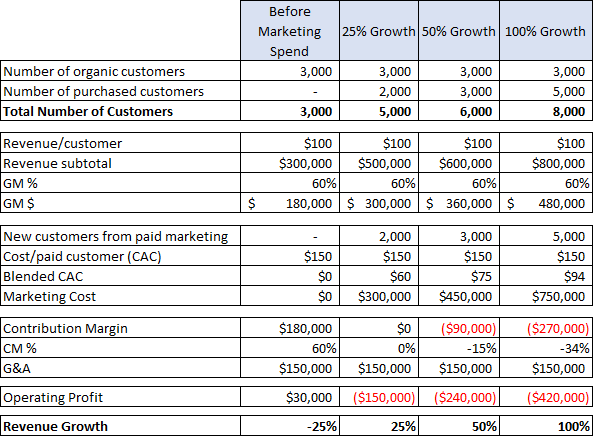
Unless the GM on the first purchase a new customer makes exceeds their CAC, there is an inverse relationship between expanding growth and achieving high contribution margin. Think of it this way: suppose that going into a month the likely organic traffic and repeat buyers are somewhat set. Boosting that month’s growth means increasing the number of new paid customers, which in turn makes paid customers a higher proportion of blended CAC and therefore increases CAC. For an example consider the following assumptions for Company B:

  • The GM is $60 on an average order of $100
  • Paid CAC is $150
  • The company will have 1,000 new customers through organic means and 2,000 repeat buyers or $300,000 in revenue with 60% GM ($180,000) from these customers before spending on paid customers
  • G&A besides marketing for the month will be $150,000
  • Last year Company B had $400,000 in revenue in the same month
  • The company is considering the ramifications of targeting 25%, 50% or 100% year-over-year growth

Table 1: The Relationship Between Contribution Margin & Growth

Since the paid CAC is $150 while Gross Margin is only $60 per new customer, each acquired customer generates negative $90 in contribution margin in the period. As can be seen in Table 1, the company would shrink 25% if there is no acquisition spend but would have $180,000 in contribution margin and positive operating profit. On the other end of the spectrum, driving 100% growth requires spending $750,000 to acquire 5,000 new customers and results in a negative $270,000 in contribution margin and an Operating Loss of $420,000 in the period. Of course, if new customers are expected to make multiple future purchases than the number of repeat customers would rise in future periods.

Subscription Models Create More Consistency but are not a Panacea

When a company’s customers are monthly subscribers, each month starts with the prior month’s base less churn. To put it another way, if churn from the prior month is modest (for example 5%) then that month already has 95% of the prior months revenue from repeat customers. Additionally, if the company increases the average invoice value from these customers, it might even have a starting point where return customers account for as much revenue as the prior month. For B-to-B companies, high revenue retention is the norm, where an average customer will pay them for 10 years or more.

Consumer ecommerce subscriptions typically have much more substantial churn, with an average life of two years being closer to the norm. Additionally, the highest level of churn (which can be as much as 30% or more) occurs in the second month, and the next highest, the third month before tapering off. What this means is that companies trying to drive high sequential growth will have a higher % churn rate than those that target more modest growth. Part of a company’s acquisition spend is needed just to stay even. For example, if we assume all new customers come from paid acquisition, the CAC is $200, and that 15% of 10,000 customers churn then the first $300,000 in marketing spend would just serve to replace the churned customers and additional spend would be needed to drive sequential growth.

Investing in Companies with High Contribution Margin

As a VC, I tend to appreciate strong business models and like to invest after some baseline proof points are in place.  In my last post I outlined a number of metrics that were important ways to track a company’s health with the ratio of LTV (life time value) to CAC being one of the most important. When a company has a high contribution margin they have the time to build that ratio by adding more products or establishing subscriptions without burning through a lot of capital. Further, companies that have a high LTV/CAC ratio should have a high contribution margin as they mature since this usually means customers buy many times – leading to an expansion in repeat business as part of each month’s total revenue.

This thought process also applies to public companies. One of the most extreme is Facebook, which I’ve owned and recommended for five years. Even after the recent pullback its stock price is about 7x what it was five years ago (or has appreciated at a compound rate of nearly 50% per year since I’ve been recommending it). Not a surprise as Facebook’s contribution margin runs over 70% and revenue was up year/year 42% in Q2. These are extraordinary numbers for a company its size.

To give the reader some idea of how this method can be used as one screen for public companies, Table 2 shows gross margin, contribution margin, revenue growth and this year’s stock market performance for seven public companies.

Table 2: Public Company Contribution Margin Analysis

Two of the seven companies shown stand out as having both high Contribution Margin and strong revenue growth: Etsy and Stitch Fix. Each had year/year revenue growth of around 30% in Q2 coupled with 44% and 29% contribution margins, respectively. This likely has been a factor in Stitch Fix stock appreciating 53% and Etsy 135% since the beginning of the year.

Three of the seven have weak models and are struggling to balance revenue growth and contribution margin: Blue Apron, Overstock, and Groupon. Both Blue Apron and Groupon have been attempting to reduce their losses by dropping their marketing spend. While this increased their CM by 10% and 20% respectively, it also meant that they both have negative growth while still losing money. The losses for Blue Apron were over 16% of revenue. This coupled with shrinking revenue feels like a lethal combination. Blue Apron stock is only down a marginal amount year-to-date but is 59% lower than one year ago. Groupon, because of much higher gross margins than Blue Apron (52% vs 35%), still seems to have a chance to turn things around, but does have a lot of work to do. Overstock went in the other direction, increasing marketing spend to drive modest revenue growth of 12%. But this led to a negative CM and substantially increased losses. That strategy did not seem to benefit shareholders as the stock has declined 53% since the beginning of the year.

eBay is a healthy company from a contribution margin point of view but has sub 10% revenue growth. I can’t tell if increasing their market spend by a substantial amount (at the cost of lower CM) would be a better balance for them.

For me, Spotify is the one anomaly in the table as its stock has appreciated 46% since the IPO despite weak contribution margins which was one reason for my negative view expressed in a prior post. I think that is driven by three reasons: its product is an iconic brand; there is not a lot of float in the stock creating some scarcity; and contribution margin has been improving giving bulls on the stock a belief that it can get to profitability eventually. I say it is an anomaly, as comparing it to Facebook, it is hard to justify the relative valuations. Facebook grew 42% in Q2, Spotify 26%; Facebook is trading at a P/E of 24 whereas even if we assume Spotify can eventually get to generating 6% net profit (it currently is at a 7% loss before finance charges and 31% loss after finance charges, so this feels optimistic) Spotify would be trading at 112 times this theoretic future earnings.


SoundBytes

I found the recent controversy over Elon Musk’s sharing his thoughts on taking Tesla private interesting. On the one hand, people want transparency from companies and Elon certainly provides that! On the other hand, it clearly impacted the stock price for a few days and the SEC abhors anything that can be construed as stock manipulation. Of course, Elon may not have been as careful as he should have been when he sent out his tweet regarding whether financing was lined up…but like most entrepreneurs he was optimistic.

How much do you know about SEO?

Search Engine Optimization: A step by step process recommended by experts

Azure just completed its annual ecommerce marketing day. It was attended by 15 of our portfolio companies, two high level executives at major corporations, a very strong SEO consultant and the Azure team. The purpose of the day is to help the CMOs in the Azure portfolio gain a broader perspective on hot marketing topics and share ideas and best practices. This year’s agenda included the following sessions:

  1. Working with QVC/HSN
  2. Brand building
  3. Using TV, radio and/or podcasts for marketing
  4. Techniques to improve email marketing
  5. Measuring and improving email marketing effectiveness
  6. Storytelling to build your brand and drive marketing success
  7. Working with celebrities, brands, popular YouTube personalities, etc.
  8. Optimizing SEO
  9. Product Listing Ads (PLAs) and Search Engine Marketing (SEM)

One pleasant aspect of the day is that it generated quite a few interesting ideas for blog posts! In other words, I learned a lot regarding the topics covered. This post is on an area many of you may believe you know well, Search Engine Optimization (SEO). I thought I knew it well too… before being exposed to a superstar consultant, Allison Lantz, who provided a cutting-edge presentation on the topic. With her permission, this post borrows freely from her content. Of course, I’ve added my own ideas in places and may have introduced some errors in thinking, and a short post can only touch on a few areas and is not a substitute for true expertise.

SEO is Not Free if You Want to Optimize

I have sometimes labeled SEO as a free source of visitors to a site, but Allison correctly points out that if you want to focus on Optimization (the O in SEO) with the search engines, then it isn’t free, but rather an ongoing process (and investment) that should be part of company culture. The good news is that SEO likely will generate high quality traffic that lasts for years and leads to a high ROI against the cost of striving to optimize. All content creators should be trained to write in a manner that optimizes generating traffic by using targeted key words in their content and ensuring these words appear in the places that are optimal for search. To be clear, it’s also best if the content is relevant, well written and user-friendly. If you were planning to create the content anyway, then the cost of doing this is relatively minor. However, if the content is incremental to achieve higher SEO rankings, then the cost will be greater. But I’m getting ahead of myself and need to review the step by step process Allison recommends to move towards optimization.

Keyword Research

The first thing to know when developing an SEO Strategy is what you are targeting to optimize. Anyone doing a search enters a word or phrase they are searching for. Each such word or phrase is called a ‘keyword’. If you want to gain more users through SEO, it’s critical to identify thousands, tens of thousands or even hundreds of thousands of keywords that are relevant to your site. For a fashion site, these could be brands, styles, and designers. For an educational site like Education.com (an Azure portfolio company that is quite strong in SEO and ranks on over 600,000 keywords) keywords might be math, english, multiplication, etc. The broader the keywords, the greater the likelihood of higher volume.  But along with that comes more competition for search rankings and a higher cost per keyword. The first step in the process is spending time brainstorming what combinations of words are relevant to your site – in other words if someone searched for that specific combination would your site be very relevant to them? To give you an idea of why the number gets very high, consider again Education.com. Going beyond searching on “math”, one can divide math into arithmetic, algebra, geometry, calculus, etc. Each of these can then be divided further. For example, arithmetic can include multiplication, addition, division, subtraction, exponentiation, fractions and more.  Each of these can be subdivided further with multiplication covering multiplication games, multiplication lesson plans, multiplication worksheets, multiplication quizzes and more.

Ranking Keywords

Once keywords are identified the next step is deciding which ones to focus on. The concept leads to ranking keywords based upon the likely number of clicks to your site that could be generated from each one and the expected value of potential users obtained through these clicks. Doing this requires determining for each keyword:

  • Monthly searches
  • Competition for the keyword
  • Conversion potential
  • Effort (and possible cost) required to achieve a certain ranking

Existing tools report the monthly volume of searches for each keyword (remember to add searches on Bing to those on Google). Estimating the strength of competition requires doing a search using the keyword and learning who the top-ranking sites are currently (given the volume of keywords to analyze, this is very labor intensive). If Amazon is a top site they may be difficult to surpass but if the competition includes relatively minor players, they would be easier to outrank.

The next question to answer for each keyword is: “What is the likelihood of converting someone who is searching on the keyword if they do come to my site”. For example, for Education.com, someone searching on ‘sesame street math games’ might not convert well since they don’t have the license to use Sesame Street characters in their math games. But someone searching on ‘1st grade multiplication worksheets’ would have a high probability of converting since the company is world-class in that area. The other consideration mentioned above is the effort required to achieve a degree of success. If you already have a lot of content relevant to a keyword, then search optimizing that content for the keyword might not be very costly. But, if you currently don’t have any content that is relevant or the keyword is very broad, then a great deal more work might be required.

Example of Keyword Ranking Analysis

Source: Education.com

Comparing Effort Required to Estimated Value of Keywords

Once you have produced the first table, you can make a very educated guess on your possible ranking after about 12 months (the time it may take Google/Bing to recognize your new status for that keyword).

There are known statistics on what the likely click-through rates (share of searches against the keyword) will be if you rank 1st, 2nd, 3rd, etc. Multiplying that by the average search volume for that keyword gives a reasonable estimate of the monthly traffic that this would generate to your site. The next step is to estimate the rate at which you will convert that traffic to members (where they register so you get their email) and/or customers (I’ll assume customers for the rest of this post but the same method would apply to members). Since you already know your existing conversion rate, in general, this could be your estimate. But, if you have been buying clicks on that keyword from Google or Bing, you may already have a better estimate of conversion. Multiplying the number of customers obtained by the LTV (Life Time Value) of a customer yields the $ value generated if the keyword obtains the estimated rank. Subtract from this the current value being obtained from the keyword (based on its current ranking) to see the incremental benefit.

Content Optimization

One important step to improve rankings is to use keywords in titles of articles. While the words to use may seem intuitive, it’s important to test variations to see how each may improve results. Will “free online multiplication games” outperform “free times table games”. The way to test this is by trying each for a different 2-week (or month) time period and see which gives a higher CTR (Click Through Rate). As discussed earlier, it’s also important to optimize the body copy against keywords. Many of our companies create a guide for writing copy that provides rules that result in better CTR.

The Importance of Links

Google views links from other sites to yours as an indication of your level of authority. The more important the site linking to you, the more it impacts Google’s view. Having a larger number of sites linking to you can drive up your Domain Authority (a search engine ranking score) which in turn will benefit rankings across all keywords. However, it’s important to be restrained in acquiring links as those from “Black Hats” (sites Google regards as somewhat bogus) can actually result in getting penalized. While getting another site to link to you will typically require some motivation for them, Allison warns that paying cash for a link is likely to result in obtaining some of them from black hat sites. Instead, motivation can be your featuring an article from the other site, selling goods from a partner, etc.

Other Issues

I won’t review it here but site architecture is also a relevant factor in optimizing SEO benefits. For a product company with tens of thousands of products, it can be extremely important to have the right titles and structure in how you list products. If you have duplicative content on your site, removing it may help your rankings, even if there was a valid reason to have such duplication. Changing the wording of content on a regular basis will help you maintain rankings.

Summary

SEO requires a well-thought-out strategy and consistent, continued execution to produce results. This is not a short-term fix, as an SEO investment will likely only start to show improvements four to six months after implementation with ongoing management. But as many of our portfolio companies can attest, it’s well worth the effort.


SoundBytes

  • It’s a new basketball season so I can’t resist a few comments. First, as much as I am a fan of the Warriors, it’s pretty foolish to view them as a lock to win as winning is very tenuous. For example, in game 5 of the finals last year, had Durant missed his late game three point shot the Warriors may have been facing the threat of a repeat of the 2016 finals – going back to Cleveland for a potential tying game.
  • Now that Russell Westbrook has two star players to accompany him we can see if I am correct that he is less valuable than Curry, who has repeatedly shown the ability to elevate all teammates. This is why I believe that, despite his two MVPs, Curry is under-rated!
  • With Stitchfix filing for an IPO, we are seeing the first of several next generation fashion companies emerging. In the filing, I noted the emphasis they place on SEO as a key component of their success. I believe new fashion startups will continue to exert pressure on traditional players. One Azure company moving towards scale in this domain is Le Tote – keep an eye on them!

When and How to Create a Valuable Marketing Event

Azure CEO Summit
Snapshots from Azure’s 11th Annual CEO Summit

A key marketing tool for companies is to hold an event like a user’s conference or a topical forum to build relationships with their customers and partners, drive additional revenue and/or generate business development opportunities. Azure held its 11th annual CEO Summit last week, and as we’re getting great feedback on the success of the conference, I thought it might be helpful to dig deeply into what makes a conference effective. I will use the Azure event as the example but try to abstract rules and lessons to be learned, as I have been asked for my advice on this topic by other firms and companies.

Step 1. Have a clear set of objectives

For the Azure CEO Summit, our primary objectives are to help our portfolio companies connect with:

  1. Corporate and Business Development executives from relevant companies
  2. Potential investors (VCs and Family Offices)
  3. Investment banks so the companies are on the radar and can get invited to their conferences
  4. Debt providers for those that can use debt as part of their capital structure

A secondary objective of the conference is to build Azure’s brand thereby increasing our deal flow and helping existing and potential investors in Azure understand some of the value we bring to the table.

When I created a Wall Street tech conference in the late 90’s, the objectives were quite different. They still included brand building, but I also wanted our firm to own trading in tech stocks for that week, have our sell side analysts gain reputation and following, help our bankers expand their influence among public companies, and generate a profit for the firm at the same time. We didn’t charge directly for attending but monetized through attendees increasing use of our trading desk and more companies using our firm for investment banking.

When Fortune began creating conferences, their primary objective was to monetize their brand in a new way. This meant charging a hefty price for attending. If people were being asked to pay, the program had to be very strong, which they market quite effectively.

Conferences that have clear objectives, and focus the activities on those objectives, are the most successful.

Step 2. Determine invitees based on who will help achieve those objectives

For our Summit, most of the invitees are a direct fallout from the objectives listed above. If we want to help our portfolio companies connect with the above-mentioned constituencies, we need to invite both our portfolio CEOs and the right players from corporations, VCs, family offices, investment banks and debt providers. To help our brand, inviting our LPs and potential LPs is important. To insure the Summit is at the quality level needed to attract the right attendees we also target getting great speakers.  As suggested by my partners and Andrea Drager, Azure VP (and my collaborator on Soundbytes) we invited several non-Azure Canadian startups. In advance of the summit, we asked Canadian VCs to nominate candidates they thought would be interesting for us and we picked the best 6 to participate in the summit. This led to over 70 interesting companies nominated and added to our deal flow pipeline.

Step 3. Create a program that will attract target attendees to come

This is especially true in the first few years of a conference while you build its reputation. It’s important to realize that your target attendees have many conflicting pulls on their time. You won’t get them to attend just because you want them there! Driving attendance from the right people is a marketing exercise. The first step is understanding what would be attractive to them. In Azure’s case, they might not understand the benefit of meeting our portfolio companies, but they could be very attracted by the right keynotes.

Azure’s 2017 Summit Keynote Speakers: Mark Lavelle, CEO of Magento Commerce & Co-founder of Bill Me Later. Cameron Lester, Managing Director and Co-Head of Global Technology Investment Banking, Jeffries. Nagraj Kashyap, Corporate VP & Global Head, Microsoft Ventures.

Over the years we have had the heads of technology investment banking from Qatalyst, Morgan Stanley, Goldman, JP Morgan and Jeffries as one of our keynote speakers. From the corporate world, we also typically have a CEO, former CEO or chairman of notable companies like Microsoft, Veritas, Citrix, Concur and Audible as a second keynote. Added to these were CEOs of important startups like Stance and Magento and terrific technologists like the head of Microsoft Labs.

Finding the right balance of content, interaction and engagement is challenging, but it should be explicitly tied to meeting the core objectives of the conference.

Step 4. Make sure the program facilitates meeting your objectives

Since Azure’s primary objective is creating connections between our portfolio (and this year, the 6 Canadian companies) with the various other constituencies we invite, we start the day with speed dating one-on-ones of 10 minutes each. Each attendee participating in one-on-ones can be scheduled to meet up to 10 entities between 8:00AM and 9:40. Following that time, we schedule our first keynote.

In addition to participating in the one-on-ones, which start the day, 26 of our portfolio companies had speaking slots at the Summit, intermixed with three compelling keynote speakers. Company slots are scheduled between keynotes to maximize continued participation. This schedule takes us to about 5:00pm. We then invite the participants and additional VCs, lawyers and other important network connections to join us for dinner. The dinner increases everyone’s networking opportunity in a very relaxed environment.

These diverse types of interaction phases throughout the conference (one-on-ones, presentations, discussions, and networking) all facilitate a different type of connection between attendees, focused on maximizing the opportunity for our portfolio companies to build strong connections.

Azure Company Presentations
Azure Portfolio Company CEO Presentations: Chairish, Megabots & Atacama

Step 5. Market the program you create to the target attendees

I get invited to about 30 conferences each year plus another 20-30 events. It’s safe to assume that most of the invitees to the Azure conference get a similar (or greater) number of invitations. What this means is that it’s unlikely that people will attend if you send an invitation but then don’t effectively market the event (especially in the first few years). It is important to make sure every key invitee gets a personal call, email, or other message from an executive walking them through the agenda and highlighting the value to them (link to fortune could also go here). For the Azure event, we highlight the great speakers but also the value of meeting selected portfolio companies. Additionally, one of my partners or I connect with every attendee we want to do one-on-ones with portfolio companies to stress why this benefits them and to give them the chance to alter their one-on-one schedule. This year we managed over 320 such meetings.

When I created the first “Quattrone team” conference on Wall Street, we marketed it as an exclusive event to portfolio managers. While the information exchanged was all public, the portfolio managers still felt they would have an investment edge by being at a smaller event (and we knew the first year’s attendance would be relatively small) where all the important tech companies spoke and did one-on-one meetings. For user conferences, it can help to land a great speaker from one of your customers or from the industry. For example, if General Electric, Google, Microsoft or some similar important entity is a customer, getting them to speak will likely increase attendance. It also may help to have an industry guru as a speaker. If you have the budget, adding an entertainer or other star personality can also add to the attraction, as long as the core agenda is relevant to attendees.

Step 6. Decide on the metrics you will use to measure success

It is important to set targets for what you want to accomplish and then to measure whether you’ve achieved those targets. For Azure, the number of entities that attend (besides our portfolio), the number of one-on-one meetings and the number of follow-ups post the conference that emanate from one-on-one are three of the metrics we measure. One week after the conference, I already know that we had over 320 one-on-ones which, so far, has led to about 50 follow ups that we are aware of including three investments in our portfolio. We expect to learn of additional follow up meetings but this has already exceeded our targets.

Step 7. Make sure the value obtained from the conference exceeds its cost

It is easy to spend money but harder to make sure the benefit of that spend exceeds its cost. On one end of the spectrum, some conferences have profits as one of the objectives. But in many cases, the determination of success is not based on profits, but rather on meeting objectives at a reasonable cost. I’ve already discussed Azure’s objectives but most of you are not VCs. For those of you dealing with customers, your objectives can include:

  1. Signing new customers
  2. Reducing churn of existing customers
  3. Developing a better understanding of how to evolve your product
  4. Strong press pickup / PR opportunity

Spending money on a conference should always be compared to other uses of those marketing dollars. To the degree you can be efficient in managing it, the conference can become a solid way to utilize marketing dollars. Some of the things we do for the Azure conference to control cost which may apply to you include:

  1. Partnering with a technology company to host our conference instead of holding it at a hotel. This only works if there is value to your partner. Cost savings is about 60-70%.
  2. Making sure our keynotes are very relevant but are at no cost. You can succeed at this with keynotes from your customers and/or the industry. Cost savings is whatever you might have paid someone.
  3. Having the dinner for 150 people at my house. This has two benefits: it is a much better experience for those attending and the cost is about 70% less than having it at a venue.

Summary

I have focused on using the Azure CEO Summit as the primary example but the rules laid out apply in general. They not only will help you create a successful conference but following them means only holding it if its value to you exceeds its cost.


SoundBytes

The warriors…

Last June I wrote about why Kevin Durant should join the Warriors

If you look at that post, you’ll see that my logic appears to have been born out, as my main reason was that Durant was likely to win a championship and this would be very instrumental in helping his reputation/legacy.

Not mentioned in that post was the fact that he would also increase his enjoyment of playing, because playing with Curry, Thompson, Green and the rest of the Warriors is optimizing how the game should be played

Now it’s up to both Durant and Curry to agree to less than cap salaries so the core of the team can be kept intact for many years. If they do, and win multiple championships, they’ll probably increase endorsement revenue. But even without that offset my question is “How much is enough?” I believe one can survive nicely on $30-$32 million a year (Why not both agree to identical deals for 4 years, not two?). Trying for the maximum is an illusion that can be self-defeating. The difference will have zero impact on their lives, but will keep players like Iguodala and Livingston with the Warriors, which could have a very positive impact. I’m hoping they can also keep West, Pachulia and McGee as well.

It would also be nice if Durant and Curry got Thompson and Green to provide a handshake agreement that they would follow the Durant/Curry lead on this and sign for the same amount per year when their contracts came up. Or, if Thompson and Green can extend now, to do the extension at equal pay to what Curry and Durant make in the extension years. By having all four at the same salary at the end of the period, the Warriors would be making a powerful statement of how they feel about each other.

Amazon & Whole Foods…

Amazon’s announced acquisition of Whole Foods is very interesting. In a previous post, we predicted that Amazon would open physical stores. Our reasoning was that over 90% of retail revenue still occurs offline and Amazon would want to attack that. I had expected these to be Guide Stores (not carrying inventory but having samples of products). Clearly this acquisition shows that, at least in food, Amazon wants to go even further. I will discuss this in more detail in a future post.

Lessons Learned from Anti-Consumer Practices/Technologies in Tech and eCommerce

One example of the anti-consumer practices by airline loyalty programs.

As more and more of our life consists of interacting with technology, it is easier and easier to have our time on an iPhone, computer or game device become all consuming. The good news is that it is so easy for each of us to interact with colleagues, friends and relatives; to shop from anywhere; to access transportation on demand; and to find information on just about anything anytime. The bad news is that anyone can interact with us: marketers can more easily bombard us, scammers can find new and better ways to defraud us, and identity thieves can access our financials and more. When friends email us or post something on Facebook, there is an expectation that we will respond.  This leads to one of the less obvious negatives: marketers and friends may not consider whether what they send is relevant to us and can make us inefficient.

In this post, I want to focus on lessons entrepreneurs can learn from products and technologies that many of us use regularly but that have glaring inefficiencies in their design, or those that employ business practices that are anti-consumer. One of the overriding themes is that companies should try to adjust to each consumer’s preferences rather than force customers to do unwanted things. Some of our examples may sound like minor quibbles but customers have such high expectations that even small offenses can result in lost customers.

Lesson 1: Getting email marketing right

Frequency of email 

The question: “How often should I be emailing existing and prospective customers?” has an easy answer. It is: “As often as they want you to.”  If you email them too frequently the recipients may be turned off. If you send too few, you may be leaving money on the table. Today’s email marketing is still in a rudimentary stage but there are many products that will automatically adjust the frequency of emails based on open rates. Every company should use these. I have several companies that send me too many emails and I have either opted out of receiving them or only open them on rare occasions. In either case the marketer has not optimized their sales opportunity.

Relevance of email

Given the amount of data that companies have on each of us one would think that emails would be highly personalized around a customer’s preferences and product applicability. One thing to realize is that part of product applicability is understanding frequency of purchase of certain products and not sending a marketing email too soon for a product that your customer would be unlikely to be ready to buy. One Azure portfolio company, Filter Easy, offers a service for providing air filters. Filter Easy gives each customer a recommended replacement time from the manufacturer of their air conditioner. They then let the customer decide replacement frequency and the company only attempts to sell units based on this time table. Because of this attention to detail, Filter Easy has one of the lowest customer churn rates of any B to C company. In contrast to this, I receive marketing emails from the company I purchase my running shoes from within a week of buying new ones even though they should know my replacement cycle is about every 6 months unless there is a good sale (where I may buy ahead). I rarely open their emails now, but would open more and be a candidate for other products from them if they sent me fewer emails and thought more about which of their products was most relevant to me given what I buy and my purchase frequency. Even the vaunted Amazon has sent me emails to purchase a new Kindle within a week or so of my buying one, when the replacement cycle of a Kindle is about 3 years.

In an idea world, each customer or potential customer would receive emails uniquely crafted for them. An offer to a customer would be ranked by likely value based on the customer profile and item profile. For example, customers who only buy when items are on sale should be profiled that way and only sent emails when there is a sale. Open Road, another Azure company, has created a daily email of deeply discounted e-books and gets a very high open rate due to the relevance of their emails (but cuts frequency for subscribers whose open rates start declining).

Lesson 2: Learning from Best Practices of Others

I find it surprising when a company launches a new version of a software application without attempting to incorporate best practices of existing products. Remember Lotus 123? They refused to create a Windows version of their spreadsheet for a few years and instead developed one for OS/2 despite seeing Excel’s considerable functionality and ease of use sparking rapid adoption. By the time they created a Windows version, it was too late and they eventually saw their market share erode from a dominant position to a minimal level.  In more modern times, Apple helped Blackberry survive well past it’s expected funeral by failing to incorporate many of Blackberry’s strong email features into the iPhone. Even today, after many updates to mail, Apple still is missing such simple features like being able to hit a “B” to go to the bottom of my email stack on the iPhone. Instead, one needs to scroll down through hundreds of emails to get to the bottom if you want to process older emails first. This wastes lots of time. But Microsoft Outlook in some ways is even worse as it has failed to incorporate lookup technology from Blackberry (and now from Apple) that always allows finding an email address from a person’s name. When one has not received a recent email from a person in your contact list, and the person’s email address is not their name, outlook requires an exact email address. When this happens, I wind up looking it the person’s contact information on my phone!

Best practices extends beyond software products to marketing, packaging, upselling and more. For example, every ecommerce company should study Apple packaging to understand how a best in class branding company packages its products. Companies also have learned that in many cases they need to replicate Amazon by providing free shipping.

Lesson 3: The Customer is Usually Right

Make sure customer loyalty programs are positive for customers but affordable for the company

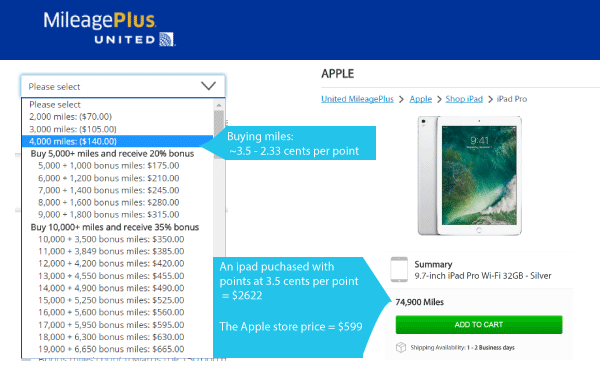
With few exceptions, companies should adopt a philosophy that is very customer-centric. Failing to do so has negative consequences. For example, the airline industry has moved towards giving customers little consideration and this results in many customers no longer having a preferred airline, instead looking for best price and/or most convenient scheduling. Whereas the mileage programs from airlines were once a very attractive way of retaining customers, the value of miles has eroded to such a degree that travelers have lost much of the benefit. This may have been necessary for the airlines as the liability associated with outstanding points reached billions of dollars. But, in addition, airlines began using points as a profit center by selling miles to credit cards at 1.5 cents per mile. Then, to make this a profitable sale, moved average redemption value to what I estimate to be about 1 cent per point. This leads to a concern of mine for consumers. Airlines are selling points at Kiosks and online for 3 cents per point, in effect charging 3 times their cash redemption value.

The lesson here is that if you decide to initiate a loyalty points program, make sure the benefits to the customer increase retention, driving additional revenue. But also make sure that the cost of the program does not exceed the additional revenue. (This may not have been the case for airlines when their mileage points were worth 3-4 cents per mile).  It is important to recognize the future cost associated with loyalty points at the time they are given out (based on their exchange value) as this lowers the gross margin of the transaction. We know of a company that failed to understand that the value of points awarded for a transaction so severely reduced the associated gross margin that it was nearly impossible for them to be profitable.

Make sure that customer service is very customer centric

During the Thanksgiving weekend I was buying a gift online and found that Best Buy had what I was looking for on sale. I filled out all the information to purchase the item, but when I went to the last step in the process, my order didn’t seem to be confirmed. I repeated the process and again had the same experience. So, I waited a few days to try again, but by then the sale was no longer valid. My assistant engaged in a chat session with their customer service to try to get them to honor the sale price, and this was refused (we think she was dealing with a bot but we’re not positive). After multiple chats, she was told that I could try going to one of their physical stores to see if they had it on sale (extremely unlikely). Instead I went to Amazon and bought a similar product at full price and decided to never buy from Best Buy’s online store again. I know from experience that Amazon would not behave that way and Azure tries to make sure none of our portfolio companies would either. Turning down what would still have been a profitable transaction and in the process losing a customer is not a formula for success! While there may be some lost revenue in satisfying a reasonable customer request the long term consequence of failing to do so usually will far outweigh this cost.


Soundbytes

My friend, Adam Lashinsky, from Fortune has just reported that an insurance company is now offering lower rates for drivers of Teslas who deploy Autopilot driver-assistance. Recall that Tesla was one of our stock picks for 2017 and this only reinforces our belief that the stock will continue to outperform.