The Impact of Gen Z on Marketing

Azure Marketing Day

Each year, Azure hosts a marketing day for CMOs and CEOs of its consumer-facing portfolio companies. This year, on February 27th, we had sessions on the following topics:

  • Refreshing Your Brand as the Business Grows
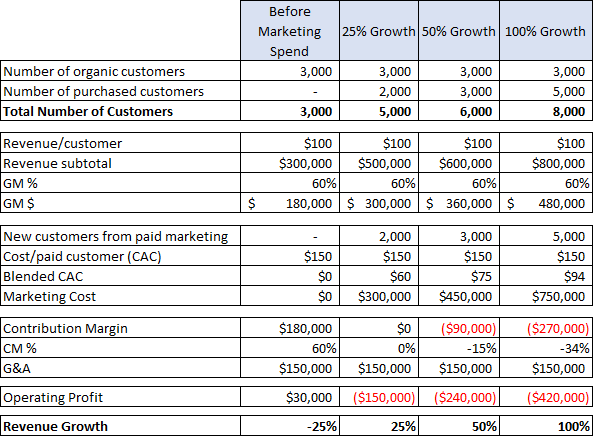
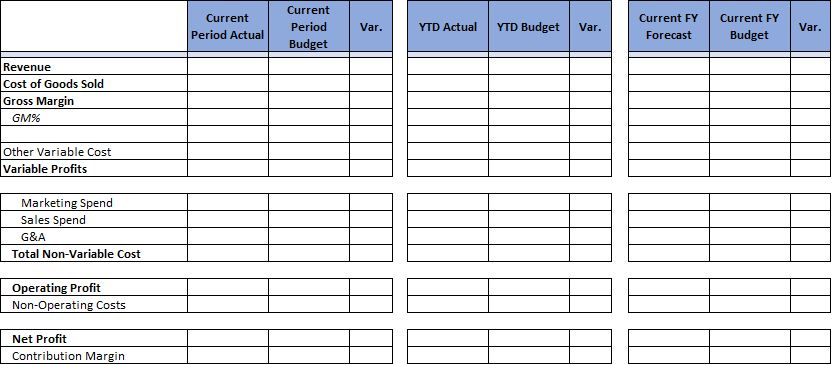
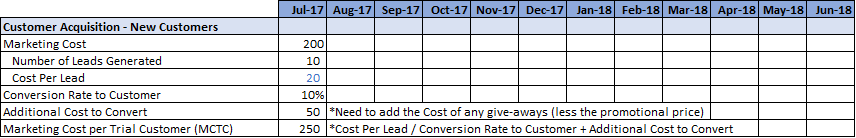
  • Metrics for Evaluating Successful Marketing
  • Leveraging Comedy to Lower Customer Acquisition Cost
  • Know the Next Generation: An introduction to Gen Z
  • The Benefits and Drawbacks of a Multi-Channel Strategy
  • Influencer Strategies
  • Optimizing Pinterest

I presented the one on Metrics, but the other sessions are conducted by a combination of portfolio executives and outside speakers, each a leading thinker on the topic. Since I invariably learn quite a lot from other speakers, it seems only fair to borrow from their talks for a few blog posts so that I can share these benefits.

Much of this post will be based on concepts that I found especially enlightening from the session by Chris Bruzzo, the current CMO of Electronic Arts, on knowing Generation Z. I won’t cite each place I am using something from Chris versus my own thoughts; but you can assume much of the content emanates from Chris. Since Chris is one of the most creative thinkers in marketing, I’m hoping this will make me look good!

Marketers have Defined Generational Characteristics

Marketers often use personas to help understand what they need to do to address different types of customers. A persona may be:

  • A married woman 35 years old with a job and 2 children aged 6 and 9;
  • A 16-year-old male who is a sophomore in high school;
  • A non-working woman aged 50

A great deal of research has been done on the characteristics of particular “personas” to better enable a company to create and market products that meet their needs. One categorization of people is by age, with 5 different generations being profiled. The youngest group to emerge as important is Gen Z, roughly defined as those born between 1995 and 2012. Currently the U.S. population over 12 years old is distributed as follows:

What this means is that Gen Z has become a significant portion of the population to consider when creating and marketing products. With that in mind, let’s compare several characteristics of the youngest three of these groups.

Source: EA Research

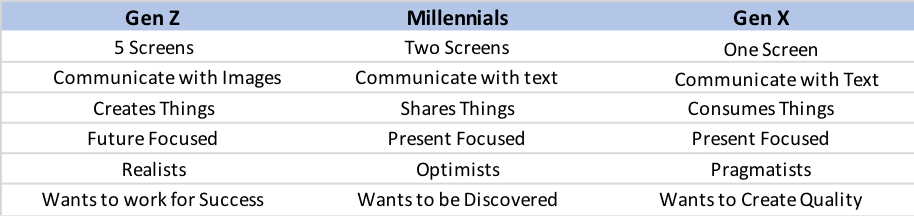
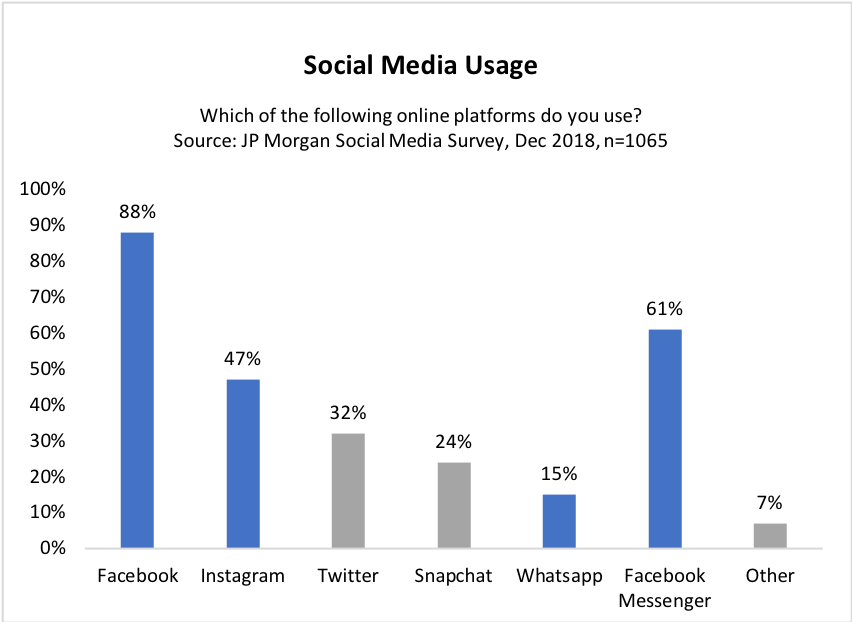
Gen Z is the first generation that are digital natives. They are profiled as having cautious optimism, wanting to be connected, seeking community and wanting to create and control things. Earlier generations, including Millennials, watched TV an increasing number of hours, often multi-tasking while they did. Gen Z has replaced much of TV watching with device “screen time”, including visiting YouTube (72% of Gen Z visit it daily). When asked “What device would you pick if you could have only one?”, GenZers chose the TV less than 5% of the time. Prior generations respond well to email marketing while Gen Z needs to be reached through social media. Gen Z has little tolerance for barriers of entry for reaching a site and will just move on (I feel the same way and think many members of other generations do as well).  So, when targeting new customers (especially Gen Z) remove barriers to entry like requiring registration before a user becomes a customer. It is important to demonstrate value to them first.

Gen Z grew up in an era where the Internet was part of life and smart phones were viewed as essential… rather than a luxury. On average they spend 40% of their free time on screens. What is even more eye opening is that 91% go to bed with their devices. Advertisers have responded to these trends by gradually shifting more of their spend online. This has been difficult for newspapers and magazines for quite a while, but now it is also having a major impact on flattening out the use of TV as an advertising medium.

There are several implications from the numbers shown in the above chart. First, it is very clear to see that newspapers and magazines as we know them are not viable. This has led to iconic players like the New York Times and Fortune monetizing their brands through conferences, trips, wine clubs, and more. Lesser known brands have simply disappeared. In 2018, TV revenue continued to grow slightly despite losing share as the smaller share was of a larger pie. But in 2019, TV advertising dollars declined, and the decline is forecast to continue going forward. Several factors can be attributed to this but certainly one is that brands targeting Gen Z are aware that TV is not their medium of choice. One unintended consequence of major brands shifting spend to the Internet is that because they are less price sensitive to cost than eCommerce companies, this has led to higher pricing by Facebook and Google.

Personalization is Becoming “Table Stakes” and Offering Co-Creation is a Major Plus

Consumers, in general, and especially Gen Z, are demanding that brands do more to personalize products to their needs and interests. In fact, Gen Z even wants to participate in product creation. One example involves Azure portfolio company Le Tote. The company, much like Stitch Fix, uses algorithms to personalize the clothing it sends based on specifics about each customer. When the company added the ability for consumers to personalize their box (from the already personalized box suggested by the algorithm) there was a sizeable spike in satisfaction…despite the fact that the items the consumer substituted led to a decline in how well the clothes fit! This example shows that using customer data to select new items is only a first step in personalization. Letting the customer have more of a say (be a co-creator) is even more important. 

Conclusions

  1. Startups need to diversify their marketing spend away from Facebook and Google as the ROI on these channels has contracted. At the Azure marketing day, we highlighted testing whether Pinterest, influencers, brick and mortar distribution and/or comedy might be sources that drive a higher ROI.
  2. If Gen Zers are being targeted, YouTube, Snap, Instagram, and Twitch are likely better places to market
  3. When targeting new customers (especially Gen Z) remove barriers to entry like requiring registration before a user becomes a customer. It is important to demonstrate value to them first.
  4. Build great apps for iPhones and Android phones but what is becoming most important is making sure that smart phones work well on your site without requiring an app, as most Gen Zers will use their phones for access. When they do, the mobile web version needs to be strong so that they don’t need to download your app before discovering the value you offer.
  5. Involve customers as much as possible in the design/selection/creation of your products as this extends personalization to “co-creation” and will increase satisfaction.

Soundbytes

  • Readers are aware that I invest in growth stocks (some of which I suggest to you) to achieve superior performance. What you may not be aware of is that over the past 25 years my strategy for investing has been to put the majority of capital in A or better rated municipal bonds (Munis) to generate income in a relatively safe way (and I believe everyone should diversify how they apportion capital). I use a complex strategy to generate superior returns and in the past 25 years I have earned, on average, between 4% and 5% tax free annually.  But in the current environment new investments in Munis will have much lower yields so I have started to look at “safe” alternatives to generate income. This type of investment is for income generation and involves a different category of stocks than the growth stocks I target for high returns through stock appreciation.
  • Given the recent downturn in the stock market I did my first “bond alternative” investment earlier this week. My goal is to generate income of over 5% on an after-tax basis in stocks that are “safe” investments from the point of view of continuing to deliver dividends at or above current levels.
  • My first set of transactions was in Bristol Myers Squibb:
    • I bought the stock at $56.48 where the dividend is 3.2% per year
    • I sold Jan 21 calls at a strike price of 60 and received $4.95
    • If the stock is not called my cash yield, including $1.80 in dividends, would be $6.75 over less than one year which would equal 12% before taxes
    • I also sold Jan 21 puts at a strike price of $55 and received $6.46. If the stock is not put to me and is not called that would increase my one-year yield to over 23% of the $56.48 stock price and I would repeat the sale of calls and puts next year. Since my net cost was $43.27 the percentage yield would be over 30% of my cash outlay.
    • If the stock was called my net gain would equal the profit on the stock, the dividends for one year plus the premiums on the options and would exceed 30%
    • If the stock went below $55 and was put to me at that price I would be ok with that as the new shares would have a net cost of just over $49 with a dividend yield of close to 4.0% (assuming the company follows past practice of raising dividends each year) and I could sell new puts at a lower strike price.  
  • The second stock I invested in for income is AT&T.
    • I bought the stock at $34.60 where the dividend is 6.0% per year
    • I sold Jan 21 calls at a strike price of $37 and received $2.05 per share
    • If the stock is not called my year 1 cash yield would be $4.13 per share over less than a year or about 12% before taxes
    • I also sold Jan 21 puts with a strike of $32 and received $3.30 per share. If the stock is not put to me and is not called, that would increase my one-year yield to over 20% of the stock price and over 25% of the net cash outlay
    • If the stock was called, I would only have 3 quarters of dividends, but the gain would be over 30% of my net original cash outlay
    • If the stock was put to me my cost of the new shares, after subtracting the put premium would be $28.70 and the dividend alone would provide a 7.2% pre-tax yield and I could sell new puts at a lower price.
  • We shall see how this works out but unless they cut the dividends, I won’t worry if the stock is lower a year from now as that would only increase my yield on new stock purchased due to the puts. The chance of either company cutting dividends seems quite low which is why I view this as a “safe” alternative to generate income as I won’t sell either stock unless they are called at the higher strike price.
  • I also began reserving capital starting about a month ago as I expected the virus to impact the market. These purchases used about 10% of what I had put aside. I put another 15% to work on Friday, March 13 as the market had fallen further and valuations have become quite attractive – remember the secret is to “buy low, sell high”. When the market is low its always scary or it wouldn’t be low! I do confess that I didn’t sell much when it was high as I tend to be a long-term holder of stocks I view as game changers…so I missed the opportunity to sell high and then repurchase low.

2019 Top Ten Predictions

Opportunity Knocks!

The 2018 December selloff provides buying opportunity

One person’s loss is another’s gain. The market contraction in the last quarter of the year means that most stocks are at much lower prices than they were in Q3 of 2018. The 5 stocks that I’m recommending (and already own) were down considerably from their Q3 2018 highs. While this may be wishful thinking, returning to those highs by the end of 2019 would provide an average gain of 78%. Each of the 5 had revenue growth of 25% or more last year (and 3 were over 35%) and each is poised for another strong year in 2019.

For the 4 continued recommendations (all of which I mentioned I would recommend again in my last post), I’ll compare closing price on December 31, 2019 to the close on December 31, 2018 for calculating performance. For the new add to my list, I’ll use the stock price as I write this post. I won’t attempt to predict the overall market again (I’m just not that good at it) but feel that the 14% drop in Q4 means there is a better chance that it won’t take a nosedive. However, since stock picks are always relative to the market, success is based on whether my picks, on average, outperform the market.

I’ll start the post with stock picks and then follow with the remaining 5 predictions.

 2019 Stocks  

Tesla stock will outpace the market (it closed last year at $333/share and is essentially the same as I write this)

In Q3, 2018 the Tesla model 3 was the bestselling car in the U.S. in terms of revenue and 5th highest by volume. This drove a 129% revenue increase versus a year earlier and $1.75 in earnings per share versus a loss of $4.22 in the prior quarter. I expect Q4 revenue to increase sequentially and growth year/year to exceed 100%. In Q3, Tesla reported that nearly half of vehicles traded in for the Model 3 were originally priced below $35,000. As Tesla begins offering sub-$40,000 versions of it, demand should include many buyers from this high-volume price range. Since the backlog for the Model 3 is about 300,000 units I expect 2019 sales to remain supply constrained if Tesla can offer lower price points (it already has announced a $2,000 price reduction). The important caveat to demand is that tax credits will be cut in H1 2019, from $7500 to $3750 and then cut again to $1875 in the second half of the year. Part of Tesla’s rationale for a $2000 price drop is to substantially offset the initial reduction of these tax credits.

Tesla began taking orders for its Q1 launch in Europe where demand over time could replicate that in the U.S. The average price of a Model 3 will initially be about $10,000 higher than in the U.S. Tesla is also building a major manufacturing facility in China (where Model 3 prices are currently over $20,000 higher than the U.S.). This Giga-Factory is expected to begin production in the latter half of 2019. While moving production to China for vehicles sold there should eliminate trade war issues, Tesla still expects to begin delivering Model 3s to Chinese customers in March.

The combination of a large backlog, reducing prices within the U.S. and launches in Europe and China should generate strong growth in 2019. Some investors fear price reductions might lead to lower gross margins. When I followed PC stocks on Wall Street, this was a constant question. My answer is the same as what proved true there: strong opportunity for continuous cost reduction should enable gross margins to remain in the 20-25% range in any location that is at volume production. So, perhaps the Chinese Giga-Factory and a future European factory will start at lower margins while volume ramps but expect margins in the U.S. (the bulk of revenue in 2019) to remain in the targeted range. Higher prices in Europe and China due to massive initial demand allows premium pricing which may keep margins close to 20%+ in each.

Facebook stock will outpace the market (it closed last year at $131/share).

Facebook underperformed in 2018, closing the year down 28% despite revenue growth that should be 35% to 40% and EPS tracking to about 36% growth (despite a massive increase in SG&A to spur future results).  The stock reacted to the plethora of criticism regarding privacy of user information coupled with the continuing charges of Russian use of Facebook to impact the election. Before the wave of negative publicity, Facebook reached a high of $218/share in July. Facebook is likely to continue to increase its spending to address privacy issues and to burnish its image. However, scaling revenue could mean it keeps operating margins at a comparable level to 2018 rather than increasing them. Rumors of Facebook’s demise seem highly exaggerated!  According to a December 2018 JP Morgan survey of U.S. Internet users, the three most used social media products were Facebook (88% of participants), Facebook Messenger (61%) and Instagram (47%). Also, 82% of those surveyed picked a Facebook-owned platform as being the most important to them. Finally, the average Facebook user reported checking Facebook roughly 5 times per day with 56% of users spending 15 minutes to an hour or more on the platform on an average day. While Facebook has experienced a minor decrease in overall usage, Instagram usage has increased dramatically. Facebook, Instagram, and WhatsApp together give the company a growing and dominant position.

At the beginning of 2018 Facebook stock was trading at 34 times trailing EPS. By the end of the year the multiple of trailing EPS was below 18. If I assume EPS can grow 20%+ in 2019 (which is below my expectation but higher than the consensus forecast) than a multiple of 20 would put the stock at about $180/share by December 31. If it grew EPS, more in line with revenue and/or returned to a multiple closer to 34 it could reach well over 200.

Two key factors:

  1. A 20% increase in revenue (I expect the increase to be about 30%) adds over $11 billion in revenue. A comparable 20% increase in SG&A would provide over $4 billion in additional money to spend, affording the company ample dollars to devote to incremental marketing without impacting operating margins.
  2. Given the “low” stock price, Facebook increased its buyback program by $9 billion to $15 billion. Since it generates $6B – $7B in cash per quarter from operations (before capex) and has roughly $40 billion in cash and equivalents it could easily increase this further if the stock remains weak. The $15 billion could reduce the share count by as much as 3% in turn increasing EPS by a similar amount.

Amazon stock will outpace the market (it closed last year at $1502/share).

While its stock dropped from its September high of $2050, Amazon remained one of the best market performers in 2018 closing the year at $1502/share. At its 2018 high of $2050, It may have gotten ahead of itself, but at year end it was up less than 2018 revenue growth. Leveraging increased scale meant net income grew faster than revenue and is likely to triple from 2017. Growth will be lower in Q4 then Q3 as Q4 2017 was the first quarter that included all revenue from Whole Foods. Still, I would not be surprised if Amazon beat expectations in Q4 since this is already factored into analyst forecasts. Amazon trades on revenue coupled with the prospect of increasingly mining the revenue into higher profits. But the company will always prioritize making long term investments over maximizing near term earnings. Growth in the core ecommerce business is likely to gradually slow, but Amazon has created numerous revenue streams like its cloud and echo/Alexa businesses that I expect to result in maintaining revenue growth in the 20% plus range in 2019. The prospect of competing with an efficient new brick and mortar offering (see prediction 6 in this post) could drive new excitement around the stock.

Profitability in 2019 could be reduced by: announced salary increases to low end workers; increasing the number of physical store locations; and greater marketing incentives for customers. Offsets to this include higher growth in stronger margin businesses like AWS and subscription services. The stock may gyrate a bit, but I expect it to continue to outperform.

Stitch Fix stock will outpace the market (it closed last year at $17/share).

In my 2018 forecast I called this my riskiest pick and it was the most volatile which is saying a lot given the turbulence experience by Facebook, Tesla, and Amazon. I was feeling pretty smug when the stock reached a high of $52/share in September! I’m not sure how much of the subsequent drop was due to VCs and other early investors reducing their positions but this can have an impact on newly minted public companies. Whatever the case, the stock dropped from September’s high to a low point of $17.09 by year’s end. The drop was despite the company doing a good job balancing growth and profitability with October quarter revenue up 24% and earnings at $10.7 million up from $1.3 million in the prior year. Both beat analyst expectations. The stock was impacted because the number of users grew 22% (1-2% less than expected) despite revenue exceeding expectations at 24% growth. I’m not sure why this was an issue.

Stitch Fix continues to add higher-end brands and to increase its reach into men, plus sizes and kids. Its algorithms to personalize each box of clothes it ships keeps improving. Therefore, the company can spend less on acquiring new customers as it has increased its ability to get existing customers to spend more and come back more often. I believe the company can grow by roughly 20% or more in 2019. If it does and achieves anything close to the revenue multiple that it started with in 2018 (before the multiple doubled in mid-year), there would be a sizeable stock gain this year. But it is a thinly traded stock and likely to be quite volatile.

Docusign Stock will outpace the market in 2019 (it is currently at $43/share).

Docusign is a new recommendation. Like Stitch Fix, it is a recent IPO and could be volatile. Docusign is the runaway leader in e-signatures, facilitating multiple parties signing documents in a secure, reliable way on board resolutions, mortgages, investment documents, etc. Strong positives include:

  • A high value for a reasonable price – I am increasingly annoyed when I need to deal with manual signatures for documents.
  • As of October 31, 2018, Docusign had over 450,000 customers up from 350,000 customers one year earlier. Of which 50,000 are Enterprise/Commercial accounts;
  • There are hundreds of millions of users whose e-signatures are stored by the company making the network effect quite large;
  • Roughly 95% of revenue is from its SaaS product which has 80% gross margin with the rest from services where margins have improved and are now positive;
  • As a SaaS company with a stable revenue base growth is more predictable. The company exceeded revenue guidance each quarter with the October 31, 2018 quarter revenue up 37%;
  • Most customers pay annually in advance. This means cash flow from operations is positive despite the company recording an operating loss;
  • Customers expand their use resulting in retained customers growing revenue faster than decreases from churned customers making net revenue retention over 100%;
  • International expansion remains a large opportunity as international is only 18% of revenue.

Picks 6 – 10: Major Trends that will surface in 2019

I developed my primary method of stock picking at my first Wall Street firm, Stanford Bernstein. The head of research there, Chuck Cahn, emphasized that you could get small wins by correctly determining that a stock would trade up on certain news like a new product, a big customer win, and beating consensus forecasts. But larger and more predictable wins of 5X or more were possible if one identified a long-term winner riding a major trend and stuck with it for multiple years. All 5 of my stock picks fall into the latter category. I’ve been recommending Facebook, Tesla, and Amazon for 4 years or more. All 3 are now over 5X from when I first targeted them as I bought Tesla at $46 and Facebook at $24 in 2013 (before this blog) and they have been in my top 10 since. Amazon was first included in 2015 when it was at $288/share. Stitch Fix and DocuSign are riskier but if successful have substantial upside since both are early in their run of leveraging their key trends.

The next 4 picks are in early stages of trends that could lead to current and next generation companies experiencing benefits for many years. The first two go hand in hand as each describes transformation of physical retail/restaurants, namely, replacing staff with technology in a way that improves the customer experience. This is possible because we are getting closer to the tipping point where the front-end investment in technology can have a solid ROI from subsequent cost savings.

Replacing Cashiers with technology will be proven out in 2019

In October 2015 I predicted that Amazon (and others like Warby Parker) would move into physical retail between then and 2020. This has occurred with Amazon first opening bookstores and then buying Whole Foods, and Warby Parker expanding its number of physical locations to about 100 by the end of 2018. My reasoning then was simple: over 92% of purchases in the U.S. were made offline. Since Amazon had substantial share of e-commerce it would begin to have its growth limited if it didn’t create an off-line presence.

Now, for Amazon to maintain a 20% or greater revenue growth rate it’s even more important for it to increase its attack on offline commerce (now about 90% of U.S. retail) I’m not saying it won’t continue to try to increase its 50% share of online but at its current size offline offers a greater opportunity for growth.

A key to Amazon’s success has been its ability to attack new markets in ways that give it a competitive advantage. Examples of this are numerous but three of the most striking are Amazon Cloud Services (where it is the industry leader), the Kindle (allowing it to own 70% share of eBook sales) and Prime (converting millions of customers to a subscription which in turn incentivized buying more from Amazon due to free shipping).

Now the company is testing an effort to transform brick and mortar retail by replacing staff with technology and in doing so improving the buying experience. The format is called Go stores and there are currently 5 test locations. Downloading the Amazon Go App enables the user to use it to open the automated doors. The store is stocked (I think by actual people) with many of the same categories of products as a 7-Eleven, in a more modern way. Food items include La Boulangerie pastries, sushi, salads, an assortment of sandwiches and even meal kits. Like a 7-Eleven, it also has convenience items like cold medicine, aspirins, etc. The store uses cameras and sensors to track your movements, items you remove from the shelves and even whether you put an item back. When you leave, the app provides you with a digital receipt. Not only does the removal of cashiers save Amazon money but the system improves customer service by eliminating any need to wait in line. I expect Amazon to open thousands of these stores over the next 3-5 years as it perfects the concept. In the future I believe it will have locations that offer different types of inventory. While Amazon may be an early experimenter here, there is opportunity for others to offer similar locations relying on third party technology.

Replacing Cooks, Baristas and Waitstaff with robots will begin to be proven in 2019

The second step in reducing physical location staff will accelerate in 2019. There are already:

  1. Robotic coffee bars:  CafeX opened in San Francisco last year, and in them one orders drip coffee, cappuccino, latte, or hot chocolate using an app on your phone or an iPad available at a kiosk. The coffee is made and served by a robot “barista” with the charge automatically put on your credit card. Ordering, billing, and preparation are automatic, but there is still one staff member in the shop to make sure things go smoothly.
  2. The first robotic burger restaurant: Creator opened in San Francisco last June. It was in beta mode through September before opening to the general public. While a “robot” makes the burgers, Creator is not as automated as CafeX as humans prepare the sauces and prep the items that go into the machine. Creator also hasn’t automated ordering/payment. Startup Momentum Machines expects to open a robotic burger restaurant and has gotten substantial backing from well-known VCs.
  3. Robots replacing waitstaff: For example, at Robo Sushi in Toronto, a “Butlertron” escorts you to your table, you order via an iPad and a second robot delivers your meal. Unlike the robots in the coffee bar and burger restaurant these are made into cute characters rather than a machine. Several Japanese companies are investing in robotic machines that make several of the items offered at a sushi restaurant.
  4. Robotic Pizza restaurants: The furthest along in automation is the Pizza industry. Zume Pizza, a startup that uses robots to make pizzas, has recently received a $375 million investment from Softbank. Zume currently uses a mix of humans and robots to create and deliver their pizzas and is operational in the Bay Area. Pizza Hut and Dominos are working on drones and/or self-driving vehicles to deliver pizzas. And Little Caesars was just issued a patent for a robotic arm and other automated mechanisms used to create a pizza.

At CES, a robot that makes breads was announced. What all these have in common is replacing low end high turnover employees with technology for repetitive tasks. The cost of labor continues to rise while the cost of technology shrinks a la Moore’s Law. It is just a matter of time before these early experiments turn into a flood of change. I expect many of these experiments will turn into “proof points” in 2019. Successful experiments will generate substantial adoption in subsequent years. Opportunities exist to invest in both suppliers and users of many robotic technologies.

“Influencers” will be increasingly utilized to directly drive Commerce

Companies have long employed Influencers as spokespersons for products and in some cases even as brands (a la Michael Jordon and Stephan Curry basketball shoes or George Forman Grills). They appear on TV ads for products and sometimes used their social reach to tout them. Blogger, a prior Azure investment, understood how to use popular bloggers in advertising campaigns. But Blogger ads, like most TV ads did not directly offer the products to potential customers. Now we are on the verge of two major changes: tech players creating structured ways to enable fans of major influencers (with millions of followers) to use one-click to directly buy products; and technology companies that can economically harness the cumulative power of hundreds of micro-influencers (tens of thousands of fans) to replicate the reach of a major influencer. I expect to see strong growth in this method of Social Commerce this year.

The Cannabis Sector should show substantial gains in 2019

In my last post I said about the Cannabis Sector: “The industry remains at a very early stage, but numerous companies are now public, and the recent market correction has the shares of most of these at more reasonable levels. While I urge great care in stock selection, it appears that the industry has emerged as one to consider investing in.” Earlier in this post, I mentioned that riding a multi-year wave with a winning company in that segment is a way to have strong returns. I’m not knowledgeable enough regarding public Cannabis companies, so I haven’t included any among my stock recommendations. However, I expect industry wide revenue to grow exponentially. The 12 largest public Cannabis companies by descending market cap are: Canopy Growth Corp (the largest at over $11B), Tilray, Aurora Cannabis, GW Pharmaceuticals, Curealeaf Holdings, Aphria, Green Thumb Industries, Cronos Group, Medmen Enterprises, Acreage Holdings, Charlotte’s Web Holdings and Trulieve Cannabis.

I believe one or more of these will deliver major returns over the next 5 years. Last year I felt we would see good fundamentals from the industry but that stocks were inflated. Given that the North American Cannabis Index opened this year at 208 well down from its 2018 high of 386 investing now seems timely. I’ll use this index as the measure of performance of this pick.

2019 will be the Year of the Unicorn IPO

Many Unicorns went public in 2018, but this year is poised to be considerably larger and could drive the largest IPO market fund raising in at least 5 years.  Disbelievers will say: “the market is way down so companies should wait longer.” The reality is the Nasdaq is off from its all-time high in August by about 15% but is higher than its highest level at any time before 2018. Investment funds are looking for new high growth companies to invest in. It appears very likely that as many as 5 mega-players will go public this year if the market doesn’t trade off from here. Each of them is a huge brand that should have very strong individual support. Institutional investors may not be as optimistic if they are priced too high due to the prices private investors have previously paid. They are: Uber, Lyft, Airbnb, Pinterest, and Slack. Each is one of the dominant participants in a major wave, foreshadowing substantial future revenue growth. Because information has been relatively private, I have less knowledge of their business models so can’t comment on whether I would be a buyer. Assuming several of these have successful IPOs many of the other 300 or so Unicorns may rush to follow.

It will be an interesting year!

Why Contribution Margin is a Strong Predictor of Success for Companies

In the last post I concluded with a brief discussion of Contribution Margin as a key KPI. Recall:

Contribution Margin = Variable Profits – Sales and Marketing Cost

The higher the contribution margin, the more dollars available towards covering G&A. Once contribution margin exceeds G&A, a company reaches operating profits. For simplicity in this post, I’ll use gross margin (GM) as the definition of variable profits even though there may be other costs that vary directly with revenue.

The Drivers of Contribution Margin (CM)

There is an absolute correlation between GM percent and CM. Very high gross margin companies will, in general, get to strong contribution margins and low gross margin companies will struggle to get there. But the sales and marketing needed to drive growth is just as important. There are several underlying factors in how much needs to be spent on sales and marketing to drive growth:

  1. The profits on a new customer relative to the cost of acquiring her (or him). That is, the CAC (customer acquisition cost) for customers derived from paid advertising compared to the profits on those customers’ first purchase
  2. The portion of new traffic that is “free” from SEO (search engine optimization), PR, existing customers recommending your products, etc.
  3. The portion of revenue that comes from repeat customers

The Relationship Between CAC and First Purchase Profits Has a Dramatic Impact on CM

Suppose Company A spends $60 to acquire a customer and has GM of $90 on the initial purchase by that customer. The contribution margin will already be positive $30 without accounting for customers that are organic or those that are repeat customers; in other words, this tends to be extremely positive! Of course, the startups I see in eCommerce are rarely in this situation but those that are can get to profitability fairly quickly if this relationship holds as they scale.

It would be more typical for companies to find that the initial purchase GM only covers a portion of CAC but that subsequent purchases lead to a positive relationship between the LTV (life time value) of the customer and CAC. If I assume the spend to acquire a customer is $60 and the GM is $30 then the CM on the first purchase would be negative (-$30), and it would take a second purchase with the same GM dollars to cover that initial cost. Most startups require several purchases before recovering CAC which in turn means requiring investment dollars to cover the outlay.

Free Traffic and Contribution Margin

If a company can generate a high proportion of free/organic traffic, there is a benefit to contribution margin. CAC is defined as the marketing spend divided by the number of new customers derived from this spend. Blended CAC is defined as the marketing spend divided by all customers who purchased in the period. The more organically generated and return customers, the lower the “blended CAC”. Using the above example, suppose 50% of the new customers for Company A come from organic (free) traffic. Then the “blended CAC“ would be 50% of the paid CAC. In the above example that would be $30 instead of $60 and if the GM was only $30 the initial purchase would cover blended CAC.

Of course, in addition to obtaining customers for free from organic traffic, companies, as they build their customer base, have an increasing opportunity to obtain free traffic by getting existing customers to buy again. So, a company should never forget that maintaining a persistent relationship with customers leads to improved Contribution Margin.

Spending to Drive Higher Growth Can Mean Lower Contribution Margin

Unless the GM on the first purchase a new customer makes exceeds their CAC, there is an inverse relationship between expanding growth and achieving high contribution margin. Think of it this way: suppose that going into a month the likely organic traffic and repeat buyers are somewhat set. Boosting that month’s growth means increasing the number of new paid customers, which in turn makes paid customers a higher proportion of blended CAC and therefore increases CAC. For an example consider the following assumptions for Company B:

  • The GM is $60 on an average order of $100
  • Paid CAC is $150
  • The company will have 1,000 new customers through organic means and 2,000 repeat buyers or $300,000 in revenue with 60% GM ($180,000) from these customers before spending on paid customers
  • G&A besides marketing for the month will be $150,000
  • Last year Company B had $400,000 in revenue in the same month
  • The company is considering the ramifications of targeting 25%, 50% or 100% year-over-year growth

Table 1: The Relationship Between Contribution Margin & Growth

Since the paid CAC is $150 while Gross Margin is only $60 per new customer, each acquired customer generates negative $90 in contribution margin in the period. As can be seen in Table 1, the company would shrink 25% if there is no acquisition spend but would have $180,000 in contribution margin and positive operating profit. On the other end of the spectrum, driving 100% growth requires spending $750,000 to acquire 5,000 new customers and results in a negative $270,000 in contribution margin and an Operating Loss of $420,000 in the period. Of course, if new customers are expected to make multiple future purchases than the number of repeat customers would rise in future periods.

Subscription Models Create More Consistency but are not a Panacea

When a company’s customers are monthly subscribers, each month starts with the prior month’s base less churn. To put it another way, if churn from the prior month is modest (for example 5%) then that month already has 95% of the prior months revenue from repeat customers. Additionally, if the company increases the average invoice value from these customers, it might even have a starting point where return customers account for as much revenue as the prior month. For B-to-B companies, high revenue retention is the norm, where an average customer will pay them for 10 years or more.

Consumer ecommerce subscriptions typically have much more substantial churn, with an average life of two years being closer to the norm. Additionally, the highest level of churn (which can be as much as 30% or more) occurs in the second month, and the next highest, the third month before tapering off. What this means is that companies trying to drive high sequential growth will have a higher % churn rate than those that target more modest growth. Part of a company’s acquisition spend is needed just to stay even. For example, if we assume all new customers come from paid acquisition, the CAC is $200, and that 15% of 10,000 customers churn then the first $300,000 in marketing spend would just serve to replace the churned customers and additional spend would be needed to drive sequential growth.

Investing in Companies with High Contribution Margin

As a VC, I tend to appreciate strong business models and like to invest after some baseline proof points are in place.  In my last post I outlined a number of metrics that were important ways to track a company’s health with the ratio of LTV (life time value) to CAC being one of the most important. When a company has a high contribution margin they have the time to build that ratio by adding more products or establishing subscriptions without burning through a lot of capital. Further, companies that have a high LTV/CAC ratio should have a high contribution margin as they mature since this usually means customers buy many times – leading to an expansion in repeat business as part of each month’s total revenue.

This thought process also applies to public companies. One of the most extreme is Facebook, which I’ve owned and recommended for five years. Even after the recent pullback its stock price is about 7x what it was five years ago (or has appreciated at a compound rate of nearly 50% per year since I’ve been recommending it). Not a surprise as Facebook’s contribution margin runs over 70% and revenue was up year/year 42% in Q2. These are extraordinary numbers for a company its size.

To give the reader some idea of how this method can be used as one screen for public companies, Table 2 shows gross margin, contribution margin, revenue growth and this year’s stock market performance for seven public companies.

Table 2: Public Company Contribution Margin Analysis

Two of the seven companies shown stand out as having both high Contribution Margin and strong revenue growth: Etsy and Stitch Fix. Each had year/year revenue growth of around 30% in Q2 coupled with 44% and 29% contribution margins, respectively. This likely has been a factor in Stitch Fix stock appreciating 53% and Etsy 135% since the beginning of the year.

Three of the seven have weak models and are struggling to balance revenue growth and contribution margin: Blue Apron, Overstock, and Groupon. Both Blue Apron and Groupon have been attempting to reduce their losses by dropping their marketing spend. While this increased their CM by 10% and 20% respectively, it also meant that they both have negative growth while still losing money. The losses for Blue Apron were over 16% of revenue. This coupled with shrinking revenue feels like a lethal combination. Blue Apron stock is only down a marginal amount year-to-date but is 59% lower than one year ago. Groupon, because of much higher gross margins than Blue Apron (52% vs 35%), still seems to have a chance to turn things around, but does have a lot of work to do. Overstock went in the other direction, increasing marketing spend to drive modest revenue growth of 12%. But this led to a negative CM and substantially increased losses. That strategy did not seem to benefit shareholders as the stock has declined 53% since the beginning of the year.

eBay is a healthy company from a contribution margin point of view but has sub 10% revenue growth. I can’t tell if increasing their market spend by a substantial amount (at the cost of lower CM) would be a better balance for them.

For me, Spotify is the one anomaly in the table as its stock has appreciated 46% since the IPO despite weak contribution margins which was one reason for my negative view expressed in a prior post. I think that is driven by three reasons: its product is an iconic brand; there is not a lot of float in the stock creating some scarcity; and contribution margin has been improving giving bulls on the stock a belief that it can get to profitability eventually. I say it is an anomaly, as comparing it to Facebook, it is hard to justify the relative valuations. Facebook grew 42% in Q2, Spotify 26%; Facebook is trading at a P/E of 24 whereas even if we assume Spotify can eventually get to generating 6% net profit (it currently is at a 7% loss before finance charges and 31% loss after finance charges, so this feels optimistic) Spotify would be trading at 112 times this theoretic future earnings.


SoundBytes

I found the recent controversy over Elon Musk’s sharing his thoughts on taking Tesla private interesting. On the one hand, people want transparency from companies and Elon certainly provides that! On the other hand, it clearly impacted the stock price for a few days and the SEC abhors anything that can be construed as stock manipulation. Of course, Elon may not have been as careful as he should have been when he sent out his tweet regarding whether financing was lined up…but like most entrepreneurs he was optimistic.

Interesting KPIs (Key Performance Indicators) for a Subscription Company

what-are-key-performance-indicators-kpis

In working with early stage businesses, I often get the question as to what metrics should management and the board use to help understand a company’s progress. It is important for every company to establish a set of consistent KPIs that are used to objectively track progress. While these need to be a part of each board package, it is even more important for the executive team to utilize this for managing their company. While this post focuses on SaaS/Subscription companies, the majority of it applies to most other types of businesses.

Areas KPIs Should Cover

  1. P&L Trends
  2. MRR (Monthly Recurring Revenue) and LTR (Lifetime Revenue)
  3. CAC (Cost of Customer Acquisition)
    1. Marketing to create leads
    2. Customers acquired electronically
    3. Customers acquired using sales professionals
  4. Gross Margin and LTV (Life Time Value of a customer)
  5. Marketing Efficiency

Many companies will also need KPIs regarding inventory in addition to the ones above.

While there may be very complex analysis behind some of these numbers, it’s important to try to keep KPIs to 2-5 pages of a board package. Use of the right KPIs will give a solid, objective, consistent top-down view of the company’s progress. The P&L portion of the package is obviously critical, but I have a possibly unique view on how this should be included in the body of a board package.

P&L Trends: Less is More

One mistake many companies make is confusing detail with better analysis. I often see models that have 50-100 line items for expenses and show this by month for 3 or more years out… but show one or no years of history. What this does is waste a great deal of time on predicting things that are inconsequential and controllable (by month), while eliminating all perspective. Things like seasonality are lost if one is unable to view 3 years of revenue at a time without scrolling from page to page. Of course, for the current year’s budget it is appropriate for management to establish monthly expectations in detail, but for any long-term planning, success revolves around revenue, gross margins, marketing/sales spend and the number of employees. For some companies that are deep technology players there may be significant costs in R&D other than payroll, but this is the exception. By using a simple formula for G&A based on the number of employees, the board can apply a sanity check on whether cost estimates in the long-term model will be on target assuming revenue is on target. So why spend excessive time on nits? Aggregating cost frees up time for better understanding how and why revenue will ramp, the relationship between revenue types and gross margin, the cost of acquiring a customer, the lifetime value of a customer and the average spend per employee.

In a similar way, the board is well served by viewing a simple P&L by quarter for 2 prior years plus the current one (with a forecast of remaining quarters). The lines could be:

Table1: P&L by Quarter

A second version of the P&L should be produced for budget comparison purposes. It should have the same rows but have the columns be current period actual, current period budget, year to date (YTD) actual, year to date budget, current full year forecast, budget for the full year.

Table 2: P&L Actual / Budget Comparison

Tracking MRR and LTR

For any SaaS/Subscription company (I’ll simply refer to this as SaaS going forward) MRR growth is the lifeblood of the company with two caveats: excessive churn makes MRR less valuable and excessive cost in growing MRR also leads to deceptive prosperity. More about that further on. MRR should be viewed on a rolling basis. It can be done by quarter for the board but by month for the management team. Doing it by quarter for the board enables seeing a 3-year trend on one page and gives the board sufficient perspective for oversight. Management needs to track this monthly to better manage the business. A relatively simple set of KPIs for each of 12 quarterly periods would be:

Table 3: MRR and Retention

Calculating Life Time Revenue through Cohort Analysis

The detailed method of calculating LTR does not need to be shown in every board package but should be included at least once per year, but calculated monthly for management.

The LTR calculation uses a grid where the columns would be the various Quarterly cohorts, that is all customers that first purchased that quarter (management might also do this using monthly instead of quarterly). This analysis can be applied to non-SaaS companies as well as SaaS entities. The first row would be the number of customers in the cohort. The next row would be the first month’s revenue for the cohort, the next the second months revenue, and so on until reaching 36 months (or whatever number the board prefers for B2B…I prefer 60 months). The next row would be the total for the full period and the final row would be the average Lifetime Revenue, LTR, per member of the cohort.

Table 4: Customer Lifetime Revenue

A second table would replicate the grid but show average per member of the cohort for each month (row). That table allows comparisons of cohorts to see if the average revenue of a newer cohort is getting better or worse than older ones for month 2 or month 6 or month 36, etc.

Table 5: Average Revenue per Cohort

Cohorts that have a full 36 months of data need to be at least 36 months old. What this means is that more recent cohorts will not have a full set of information but still can be used to see what trends have occurred. For example, is the second months average revenue for a current cohort much less than it was for a cohort one year ago? While newer cohorts do not have full sets of monthly revenue data, they still are very relevant in calculating more recent LTR. This can be done by using average monthly declines in sequential months and applying them to cohorts with fewer months of data.

Customer Acquisition Cost (CAC)

Calculating CAC is done in a variety of ways and is quite different for customers acquired electronically versus those obtained by a sales force.  Many companies I’ve seen have a combination of the two.

Marketing used to generate leads should always be considered part of CAC. The marketing cost in a month first is divided by the number of leads to generate a cost/lead. The next step is to estimate the conversion rate of leads to customers. A simple table would be as follows:

Table 6: Customer Acquisition Costs

table 6.1

For an eCommerce company, the additional cost to convert might be one free month of product or a heavily subsidized price for the first month. If the customer is getting the item before becoming a regular paying customer than the CAC would be:

CAC = MCTC / the percent that converts from the promotional trial to a paying customer.

CAC when a Sales Force is Involved

For many eCommerce companies and B2B companies that sell electronically, marketing is the primary cost involved in acquiring a paying customer. For those utilizing a sales force, the marketing expense plus the sales expense must be accumulated to determine CAC.

Typically, what this means is steps 1 through 3 above would still be used to determine CPL, but step 1 above might include marketing personnel used to generate leads plus external marketing spend:

  1. CPL (cost per lead) as above
  2. Sales Cost = current month’s cost of the sales force including T&E
  3. New Customers in the month = NC
  4. Conversion Rate to Customer = NC/number of leads= Y%
  5. CAC = CPL/Y% + (Sales Cost)/NC

There are many nuances ignored in the simple method shown. For example, some leads may take many months to close. Some may go through a pilot before closing. Therefore, there are more sophisticated methods of calculating CAC but using this method would begin the process of understanding an important indicator of efficiency of customer acquisition.

Gross Margin (GM) is a Critical Part of the Equation

While revenue is obviously an important measure of success, not all revenue is the same. Revenue that generates 90% gross margin is a lot more valuable per dollar than revenue that generates 15% gross margin. When measuring a company’s potential for future success it’s important to understand what level of revenue is required to reach profitability. A first step is understanding how gross margin may evolve. When a business scales there are many opportunities to improve margins:

  • Larger volumes may lead to larger discounts from suppliers
  • Larger volumes for products that are software/content may lower the hosting cost as a percent of revenue
  • Shipping to a larger number of customers may allow opening additional distribution centers (DCs) to facilitate serving customers from a DC closer to their location lowering shipping cost
  • Larger volumes may mean improved efficiency in the warehouse. For example, it may make more automation cost effective

When forecasting gross margin, it is important to be cautious in predicting some of these savings. The board should question radical changes in GM in the forecast. Certain efficiencies should be seen in a quarterly trend, and a marked improvement from the trend needs to be justified. The more significant jump in GM from a second DC can be calculated by looking at the change in shipping rates for customers that will be serviced from the new DC vs what rates are for these customers from the existing one.

Calculating LTV (Lifetime Value)

Gross Margin, by itself may be off as a measure of variable profits of a customer. If payment is by credit card, then the credit card cost per customer is part of variable costs. Some companies do not include shipping charges as part of cost of goods, but they should always be part of variable cost. Customer service cost is typically another cost that rises in proportion to the number of customers. So:

Variable cost = Cost of Goods sold plus any cost that varies directly with sales

Variable Profit = Revenue – Variable Cost

Variable Profit% (VP%) = (Variable Profit)/Revenue

LTV = LTR x VP%

The calculation of VP% should be based on current numbers as they will apply going forward. Determining a company’s marketing efficiency requires comparing LTV to the cost of customer acquisition. As mentioned earlier in the post, if the CAC is too large a proportion of LTV, a company may be showing deceptive (profitless) growth. So, the next set of KPIs address marketing efficiency.

Marketing Efficiency

It does not make sense to invest in an inefficient company as they will burn through capital at a rapid rate and will find it difficult to become profitable. A key measure of efficiency is the relationship between LTV and CAC or LTV/CAC. Essentially this is how many dollars of variable profit the company will make for every dollar it spends on marketing and sales. A ratio of 5 or more usually means the company is efficient. The period used for calculating LTR will influence this number. Since churn tends to be much lower for B2B companies, 5 years is often used to calculate LTR and LTV. But, using 5 years means waiting longer to receive resulting profits and can obscure cash flow implications of slower recovery of CAC. So, a second metric important to understand burn is how long it takes to recover CAC:

CAC Recovery Time = number of months until variable profit equals the CAC

The longer the CAC recovery time, the more capital required to finance growth. Of course, existing customers are also contributing to the month’s revenue alongside new customers. So, another interesting KPI is contribution margin which measures the current state of balance between marketing/sales and Variable Profits:

Contribution Margin = Variable Profits – Sales and Marketing Cost

Early on this number will be negative as there aren’t enough older customers to cover the investment in new ones. But eventually the contribution margin in a month needs to turn positive. To reach profitability it needs to exceed all other costs of the business (G&A, R&D, etc.). By reducing a month’s marketing cost, a company can improve contribution margin that month at the expense of sequential growth… which is why this is a balancing act.

I realize this post is long but wanted to include a substantial portion of KPIs in one post. However, I’ll leave more detailed measurement of sales force productivity and deeper analysis of several of the KPIs discussed here for one or more future posts.

Soundbytes

I’ll begin by apologizing for a midyear brag, but I always tell others to enjoy success and therefore am about to do that myself. In my top ten predictions for 2018 I included a market prediction and 4 stock predictions. I was feeling pretty good that they were all working well when I started to create this post. However, the stock prices for high growth stocks can experience serious shifts in very short periods. Facebook and Tesla both had (what I consider) minor shortfalls against expectations in the 10 days since and have subsequently declined quite a bit in that period. But given the strength of my other two recommendations, Amazon and Stitchfix, the four still have an average gain of 15% as of July 27. Since I’ve only felt comfortable predicting the market when it was easy (after 9/11 and after the 2008 mortgage blowup), I was nervous about predicting the S&P would be up this year as it was a closer call and was somewhat controversial given the length of the bull market prior to this year. But it seemed obvious that the new tax law would be very positive for corporate earnings. So, I thought the S&P would be up despite the likelihood of rising interest rates. So far, it is ahead 4.4% year to date driven by stronger earnings. Since I always fear that my record of annual wins can’t continue I wanted to take a midyear victory lap just in case everything collapses in the second half of the year (which I don’t expect but always fear). So I continue to hold all 4 stocks and in fact bought a bit more Facebook today.

Company Valuations Implied by my Valuations Bible: Are Snap, Netflix, Square and Twitter Grossly Overvalued?

Applying the Gross Margin Multiple Method to Public Company Valuation

In my last two posts I’ve laid out a method to value companies not yet at their mature business models. The method provides a way to value unprofitable growth companies and those that are profitable but not yet at what could be their mature business model. This often occurs when a company is heavily investing in growth at the expense of near-term profits. In the last post, I showed how I would estimate what I believed the long-term model would be for Tesla, calling the result “Potential Earnings” or “PE”. Since this method requires multiple assumptions, some of which might not find agreement among investors, I provided a second, simplified method that only involved gross margin and revenue growth.

The first step was taking about 20 public companies and calculating how they were valued as a multiple of gross margin (GM) dollars. The second step was to determine a “least square line” and formula based on revenue growth and the gross margin multiple for these companies. The coefficient of 0.62 shows that there is a good correlation between Gross Margin and Revenue Growth, and one significantly better than the one between Revenue Growth and a company’s Revenue Multiple (that had a coefficient of 0.36 which is considered very modest).

Where’s the Beef?

The least square formula derived in my post for relating revenue growth to an implied multiple of Gross Margin dollars is:

GM Multiple = (24.773 x Revenue growth percent) + 4.1083

Implied Company Market Value = GM Multiple x GM Dollars

Now comes the controversial part. I am going to apply this formula to 10 companies using their data (with small adjustments) and compare the Implied Market Value (Implied MKT Cap) to their existing market Cap as of several days ago. I’ll than calculate the Implied Over (under) Valuation based on the comparison. If the two values are within 20% I view it as normal statistical variation.

Table 1: Valuation Analysis of 10 Tech Companies

  • * Includes net cash included in expected market cap
  • ** Uses adjusted GM%
  • *** Uses 1/31/18 year end
  • **** Growth rate used in the model is q4 2017 vs q4 2016.  See text

This method suggests that 5 companies are over-valued by 100% or more and a fifth, Workday, by 25%. Since Workday is close to a normal variation, I won’t discuss it further. I have added net cash for Facebook, Snap, Workday and Twitter to the implied market cap as it was material in each case but did not do so for the six others as the impact was not as material.

I decided to include the four companies I recommended, in this year’s top ten list, Amazon, Facebook, Tesla and Stitchfix, in the analysis. To my relief, they all show as under-valued with Stitchfix, (the only one below the Jan 2 price) having an implied valuation more than 100% above where it currently trades. The other three are up year to date, and while trading below what is suggested by this method, are within a normal range. For additional discussion of these four see our 2018 top Ten List.


Digging into the “Overvalued” Five

Why is there such a large discrepancy between actual market cap and that implied by this method for 5 companies? There are three possibilities:

  1. The method is inaccurate
  2. The method is a valid screen but I’m missing some adjustment for these companies
  3. The companies are over-valued and at some point, will adjust, making them risky investments

While the method is a good screen on valuation, it can be off for any given company for three reasons:  the revenue growth rate I’m using will radically change; a particular company has an ability to dramatically increase gross margins, and/or a particular company can generate much higher profit margins than their gross margin suggests. Each of these may be reflected in the company’s actual valuation but isn’t captured by this method.

To help understand what might make the stock attractive to an advocate, I’ll go into a lot of detail in analyzing Snap. Since similar arguments apply to the other 4, I’ll go into less detail for each but still point out what is implicit in their valuations.

Snap

Snap’s gross margin (GM) is well below its peers and hurts its potential profitability and implied valuation. Last year, GM was about 15%, excluding depreciation and amortization, but it was much higher in the seasonally strong Q4. It’s most direct competitor, Facebook, has a gross margin of 87%.  The difference is that Facebook monetizes its users at a much higher level and has invested billions of dollars and executed quite well in creating its own low-cost infrastructure, while Snap has outsourced its backend to cloud providers Google and Amazon. Snap has recently signed 5-year contracts with each of them to extend the relationships. Committing to lengthy contracts will likely lower the cost of goods sold.  Additionally, increasing revenue per user should also improve GM.  But, continuing to outsource puts a cap on how high margins can reach. Using our model, Snap would need 79% gross margin to justify its current valuation. If I assume that scale and the longer-term contracts will enable Snap to double its gross margins to 30%, the model still shows it as being over-valued by 128% (as opposed to the 276% shown in our table). The other reason bulls on Snap may justify its high valuation is that they expect it to continue to grow revenue at 100% or more in 2018 and beyond. What is built into most forecasts is an assumed decline in revenue growth rates over time… as that is what typically occurs. The model shows that growing revenue 100% a year for two more years without burning cash would leave it only 32% over-valued in 2 years. But as a company scales, keeping revenue growth at that high a level is a daunting task. In fact, Snap already saw revenue growth decline to 75% in Q4 of 2017.

Twitter

Twitter is not profitable.  Revenue declined in 2017 after growing a modest 15% in 2016, and yet it trades at a valuation that implies that it is a growth company of about 50%. While it has achieved such levels in the past, it may be difficult to even get back to 15% growth in the future given increased competition for advertising.

Netflix

I recommended Netflix in January 2015 as one of my stock picks for the year, and it proved a strong recommendation as the stock went up about 140% that year. However, between January 2015 and January 2018, the stock was up over 550% while trailing revenue only increased 112%.  I continue to like the fundamentals of Netflix, but my GM model indicates that the stock may have gotten ahead of itself by a fair amount, and it is unlikely to dramatically increase revenue growth rates from last year’s 32%.

Square

Square has followed what I believe to be the average pattern of revenue growth rate decline as it went from 49% growth in 2015, down to 35% growth in 2016, to under 30% growth in 2017. There is no reason to think this will radically change, but the stock is trading as if its revenue is expected to grow at a nearly 90% rate. On the GM side, Square has been improving GM each year and advocates will point out that it could go higher than the 38% it was in 2017. But, even if I use 45% for GM, assuming it can reach that, the model still implies it is 90% over-valued.

Blue Apron

I don’t want to beat up on a struggling Blue Apron and thought it might have reached its nadir, but the model still implies it is considerably over-valued. One problem that the company is facing is that investors are negative when a company has slow growth and keeps losing money. Such companies find it difficult to raise additional capital. So, before running out of cash, Blue Apron began cutting expenses to try to reach profitability. Unfortunately, given their customer churn, cutting marketing spend resulted in shrinking revenue in each sequential quarter of 2017. In Q4 the burn was down to $30 million but the company was now at a 13% decline in revenue versus Q4 of 2016 (which is what we used in our model). I assume the solution probably needs to be a sale of the company. There could be buyers who would like to acquire the customer base, supplier relationships and Blue Apron’s understanding of process. But given that it has very thin technology, considerable churn and strong competition, I’m not sure if a buyer would be willing to pay a substantial premium to its market cap.


An Alternative Theory on the Over Valued Five

I have to emphasize that I am no longer a Wall Street analyst and don’t have detailed knowledge of the companies discussed in this post, so I easily could be missing some important factors that drive their valuation.  However, if the GM multiple model is an accurate way of determining valuation, then why are they trading at such lofty premiums to implied value? One very noticeable common characteristic of all 5 companies in question is that they are well known brands used by millions (or even tens of millions) of people. Years ago, one of the most successful fund managers ever wrote a book where he told readers to rely on their judgement of what products they thought were great in deciding what stocks to own. I believe there is some large subset of personal and professional investors who do exactly that. So, the stories go:

  • “The younger generation is using Snap instead of Facebook and my son or daughter loves it”
  • “I use Twitter every day and really depend on it”
  • “Netflix is my go-to provider for video content and I’m even thinking of getting rid of my cable subscription”

Once investors substitute such inclinations for hard analysis, valuations can vary widely from those suggested by analytics. I’m not saying that such thoughts can’t prove correct, but I believe that investors need to be very wary of relying on such intuition in the face of evidence that contradicts it.

The Valuation Bible

Facebook valuation image

After many years of successfully picking public and private companies to invest in, I thought I’d share some of the core fundamentals I use to think about how a company should be valued. Let me start by saying numerous companies defy the logic that I will lay out in this post, often for good reasons, sometimes for poor ones. However, eventually most companies will likely approach this method, so it should at least be used as a sanity check against valuations.

When a company is young, it may not have any earnings at all, or it may be at an earnings level (relative to revenue) that is expected to rise. In this post, I’ll start by considering more mature companies that are approaching their long-term model for earnings to establish a framework, before addressing how this framework applies to less mature companies. The post will be followed by another one where I apply the rules to Tesla and discuss how it carries over into private companies.

Growth and Earnings are the Starting Points for Valuing Mature Companies

When a company is public, the most frequently cited metric for valuation is its price to earnings ratio (PE). This may be done based on either a trailing 12 months or a forward 12 months. In classic finance theory a company should be valued based on the present value of future cash flows. What this leads to is our first rule:

Rule 1: Higher Growth Rates should result in a higher PE ratio.

When I was on Wall Street, I studied hundreds of growth companies (this analysis does not apply to cyclical companies) over the prior 10-year period and found that there was a very strong correlation between a given year’s revenue growth rate and the next year’s revenue growth rate. While the growth rate usually declined year over year if it was over 10%, on average this decline was less than 20% of the prior year’s growth rate. What this means is that if we took a group of companies with a revenue growth rate of 40% this year, the average organic growth for the group would likely be about 33%-38% the next year. Of course, things like recessions, major new product releases, tax changes, and more could impact this, but over a lengthy period of time this tended to be a good sanity test. As of January 2, 2018, the average S&P company had a PE ratio of 25 on trailing earnings and was growing revenue at 5% per year. Rule 1 implies that companies growing faster should have higher PEs and those growing slower, lower PEs than the average.

Graph 1: Growth Rates vs. Price Earnings Ratios

graph

The graph shows the correlation between growth and PE based on the valuations of 21 public companies. Based on Rule 1, those above the line may be relatively under-priced and those below relatively over-priced. I say ‘may be’ as there are many other factors to consider, and the above is only one of several ways to value companies. Notice that most of the theoretically over-priced companies with growth rates of under 5% are traditional companies that have long histories of success and pay a dividend. What may be the case is that it takes several years for the market to adjust to their changed circumstances or they may be valued based on the return from the dividend. For example, is Coca Cola trading on: past glory, its 3.5% dividend, or is there something about current earnings that is deceptive (revenue growth has been a problem for several years as people switch from soda to healthier drinks)? I am not up to speed enough to know the answer. Those above the line may be buys despite appearing to be highly valued by other measures.

Relatively early in my career (in 1993-1995) I applied this theory to make one of my best calls on Wall Street: “Buy Dell sell Kellogg”. At the time Dell was growing revenue over 50% per year and Kellogg was struggling to grow it over 4% annually (its compounded growth from 1992 to 1995, this was partly based on price increases). Yet Dell’s PE was about half that of Kellogg and well below the S&P average. So, the call, while radical at the time, was an obvious consequence of Rule 1. Fortunately for me, Dell’s stock appreciated over 65X from January 1993 to January 2000 (and well over 100X while I had it as a top pick) while Kellogg, despite large appreciation in the overall stock market, saw its stock decline slightly over the same 7-year period (but holders did receive annual dividends).

Rule 2: Predictability of Revenue and Earnings Growth should drive a higher trailing PE

Investors place a great deal of value on predictability of growth and earnings, which is why companies with subscription/SaaS models tend to get higher multiples than those with regular sales models. It is also why companies with large sales backlogs usually get additional value. In both cases, investors can more readily value the companies on forward earnings since they are more predictable.

Rule 3: Market Opportunity should impact the Valuation of Emerging Leaders

When one considers why high growth rates might persist, the size of the market opportunity should be viewed as a major factor. The trick here is to make sure the market being considered is really the appropriate one for that company. In the early 1990s, Dell had a relatively small share of a rapidly growing PC market. Given its competitive advantages, I expected Dell to gain share in this mushrooming market. At the same time, Kellogg had a stable share of a relatively flat cereal market, hardly a formula for growth. In recent times, I have consistently recommended Facebook in this blog for the very same reasons I had recommended Dell: in 2013, Facebook had a modest share of the online advertising, a market expected to grow rapidly. Given the advantages Facebook had (and they were apparent as I saw every Azure ecommerce portfolio company moving a large portion of marketing spend to Facebook), it was relatively easy for me to realize that Facebook would rapidly gain share. During the time I’ve owned it and recommended it, this has worked out well as the share price is up over 8X.

How the rules can be applied to companies that are pre-profit

As a VC, it is important to evaluate what companies should be valued at well before they are profitable. While this is nearly impossible to do when we first invest (and won’t be covered in this post), it is feasible to get a realistic range when an offer comes in to acquire a portfolio company that has started to mature. Since they are not profitable, how can I apply a PE ratio?

What needs to be done is to try to forecast eventual profitability when the company matures. A first step is to see where current gross margins are and to understand whether they can realistically increase. The word realistic is the key one here. For example, if a young ecommerce company currently has one distribution center on the west coast, like our portfolio company Le Tote, the impact on shipping costs of adding a second eastern distribution center can be modeled based on current customer locations and known shipping rates from each distribution center. Such modeling, in the case of Le Tote, shows that gross margins will increase 5%-7% once the second distribution center is fully functional. On the other hand, a company that builds revenue city by city, like food service providers, may have little opportunity to save on shipping.

  • Calculating variable Profit Margin

Once the forecast range for “mature” gross margin is estimated, the next step is to identify other costs that will increase in some proportion to revenue. For example, if a company is an ecommerce company that acquires most of its new customers through Facebook, Google and other advertising and has high churn, the spend on customer acquisition may continue to increase in direct proportion to revenue. Similarly, if customer service needs to be labor intensive, this can also be a variable cost. So, the next step in the process is to access where one expects the “variable profit margin” to wind up. While I don’t know the company well, this appears to be a significant issue for Blue Apron: marketing and cost of goods add up to about 90% of revenue. I suspect that customer support probably eats up (no pun intended) 5-10% of what is left, putting variable margins very close to zero. If I assume that the company can eventually generate 10% variable profit margin (which is giving it credit for strong execution), it would need to reach about $4 billion in annual revenue to reach break-even if other costs (product, technology and G&A) do not increase. That means increasing revenue nearly 5-fold. At their current YTD growth rate this would take 9 years and explains why the stock has a low valuation.

  • Estimating Long Term Net Margin

Once the variable profit margin is determined, the next step would be to estimate what the long-term ratio of all other operating cost might be as a percent of revenue. Using this estimate I can determine a Theoretic Net Earnings Percent. Applying this percent to current (or next years) revenue yields a Theoretic Earnings and a Theoretic PE (TPE):

TPE= Market Cap/Theoretic Earnings     

To give you a sense of how I successfully use this, review my recap of the Top Ten Predictions from 2017 where I correctly predicted that Spotify would not go public last year despite strong top line growth as it was hard to see how its business model could support more than 2% or so positive operating margin, and that required renegotiating royalty deals with record labels.  Now that Spotify has successfully negotiated a 3% lower royalty rate from several of the labels, it appears that the 16% gross margins in 2016 could rise to 19% or more by the end of 2018. This means that variable margins (after marketing cost) might be 6%. This would narrow its losses, but still means it might be several years before the company achieves the 2% operating margins discussed in that post. As a result, Spotify appears headed for a non-traditional IPO, clearly fearing that portfolio managers would not be likely to value it at its private valuation price since that would lead to a TPE of over 200. Since Spotify is loved by many consumers, individuals might be willing to overpay relative to my valuation analysis.

Our next post will pick up this theme by walking through why this leads me to believe Tesla continues to have upside, and then discussing how entrepreneurs should view exit opportunities.


SoundBytes

I’ve often written about effective shooting percentage relative to Stephen Curry, and once again he leads the league among players who average 15 points or more per game. What also accounts for the Warriors success is the effective shooting of Klay Thompson, who is 3rd in the league, and Kevin Durant who is 6th. Not surprisingly, Lebron is also in the top 10 (4th). The table below shows the top ten among players averaging 15 points or more per game.  Of the top ten scorers in the league, 6 are among the top 10 effective shooters with James Harden only slightly behind at 54.8%. The remaining 3 are Cousins (53.0%), Lillard (52.2%), and Westbrook, the only one below the league average of 52.1% at 47.4%.

Table: Top Ten Effective Shooters in the League

table

*Note: Bolded players denote those in the top 10 in Points per Game

Using Technology to Revolutionize Urban Transit

Winter Traffic Photo

Worsening traffic requires new solutions

As our population increases, the traffic congestion in cities continues to worsen. In the Bay Area my commute into the city now takes about 20% longer than it did 10 years ago, and driving outside of typical rush hours is now often a major problem. In New York, the subway system helps quite a bit, but most of Manhattan is gridlocked for much of the day.

The two key ways of relieving cities from traffic snarl are:

  1. Reduce the number of vehicles on city streets
  2. Increase the speed at which vehicles move through city streets

Metro areas have been experimenting with different measures to improve car speed, such as:

  1. Encouraging carpooling and implementing high occupancy vehicle lanes on arteries that lead to urban centers
  2. Converting more streets to one-way with longer periods of green lights
  3. Prohibiting turns onto many streets as turning cars often cause congestion

No matter what a city does, traffic will continue to get worse unless compelling and effective urban transportation systems are created and/or enhanced. With that in mind, this post will review current alternatives and discuss various ways of attacking this problem.

Ride sharing services have increased congestion

Uber and Lyft have not helped relieve congestion. They have probably even led to increasing it, as so many rideshare vehicles are cruising the streets while awaiting their next ride. While the escalation of ridesharing services like Uber and Lyft may have reduced the number of people who commute using their own car to work, they have merely substituted an Uber driver for a personal driver. Commuters parked their cars when arriving at work while ridesharing drivers continue to cruise after dropping off a passenger, so the real benefit here has been in reducing demand for parking, not improving traffic congestion.

A simple way to think about this is that the total cars on the street at any point in time consists of those with someone going to a destination plus those cruising awaiting picking up a passenger. Uber does not reduce the number of people going to a destination by car (and probably increases it as some Uber riders would have taken public transportation if not for Uber).

The use of optimal traffic-aware routing GPS apps like Waze doesn’t reduce traffic but spreads it more evenly among alternate routes, therefore providing a modest increase in the speed that vehicles move through city streets. The thought that automating these vehicles will relieve pressure is unrealistic, as automated vehicles will still be subject to the same movement as those with drivers (who use Waze). Automating ridesharing cars can modestly reduce the number of cruising vehicles, as Uber and Lyft can optimize the number that remain in cruise mode. However, this will not reduce the number of cars transporting someone to a destination. So, it is clear to me that ridesharing services increase rather than reduce the number of vehicles on city streets and will continue to do so even when they are driverless.

Metro rail systems effectively reduce traffic but are expensive and can take decades to implement

Realistically, improving traffic flow requires cities to enhance their urban transport system, thereby reducing the number of vehicles on their streets. There are several historic alternatives but the only one that can move significant numbers of passengers from point A to point B without impacting other traffic is a rail system. However, construction of a rail system is costly, highly disruptive, and can take decades to go from concept to completion. For example, the New York City Second Avenue Line was tentatively approved in 1919. It is educational to read the history of reasons for delays, but the actual project didn’t begin until 2005 despite many millions of dollars being spent on planning, well before that date. The first construction commenced in April 2007. The first phase of the construction cost $4.5 billion and included 3 stations and 2 miles of tunnels. This phase was complete, and the line opened in January 2017. By May daily ridership was approximately 176,000 passengers. A second phase is projected to cost an additional $6 billion, add 1.5 more miles to the line and be completed 10-12 years from now (assuming no delays). Phase 1 and 2 together from actual start to hopeful finish will be over two decades from the 2005 start date…and about a century from when the line was first considered!

Dedicated bus rapid transit, less costly and less effective

Most urban transportation networks include bus lines through city streets. While buses do reduce the number of vehicles on the roads, they have several challenges that keep them from being the most efficient method of urban transport:

  1. They need to stop at traffic lights, slowing down passenger movement
  2. When they stop to let one passenger on or off, all other passengers are delayed
  3. They are very large and often cause other street traffic to be forced to slow down

One way of improving bus efficiency is a Dedicated Bus Rapid Transit System (BRT). Such a system creates a dedicated corridor for buses to use. A key to increasing the number of passengers such a system can transport is to remove them from normal traffic (thus the dedicated lanes) and to reduce or eliminate the need to stop for traffic lights by either altering the timing to automatically accommodate minimal stoppage of the buses or by creating overpasses and/or underpasses. If traffic lights are altered, the bus doesn’t stop for a traffic light but that can mean cross traffic stops longer, thus increasing cross traffic congestion. Elimination of interference using underpasses and/or overpasses at each intersection can be quite costly given the substantial size of buses. San Francisco has adopted the first, less optimal, less costly, approach along a two-mile corridor of Van Ness Avenue. The cost will still be over $200 million (excluding new buses) and it is expected to increase ridership from about 16,000 passengers per day to as much as 22,000 (which I’m estimating translates to 2,000-3,000 passengers per hour in each direction during peak hours). Given the increased time cross traffic will need to wait, it isn’t clear how much actual benefit will occur.

Will Automated Car Rapid Transit (ACRT) be the most cost effective solution?

I recently met with a company that expects to create a new alternative using very small automated car rapid transit (ACRT) that costs a fraction of and has more than double the capacity of a BRT.  The basic concept is to create a corridor similar to that of a BRT, utilizing underpasses under some streets and bridges over other streets. Therefore, cross traffic would not be affected by longer traffic light stoppages. Since the size of an underpass (tunnel) to accommodate a very small car is a fraction of that of a very large bus, so is the cost. The cars would be specially designed driverless automated cars that have no trunk, no back seats and hold one or two passengers. The same 3.5 to 4.0-meter-wide lane needed for a BRT would be sufficient for more than two lanes of such cars. Since the cars would be autonomous, speed and distance between cars could be controlled so that all cars in the corridor move at 30 miles per hour unless they exited. Since there would be overpasses and underpasses across each cross street, the cars would not stop for lights. Each vehicle would hold one or two passengers going to the same stop, so the car would not slow until it reached that destination. When it did, it would pull off the road without reducing speed until it was on the exit ramp.

The company claims that it will have the capacity to transport 10,000 passengers per hour per lane with the same setup as the Van Ness corridor if underpasses and overpasses were added. Since a capacity of 10,000 passengers per hour in each direction would provide significant excess capacity compared to likely usage, 2 lanes (3 meters in total width instead of 7-8 meters) is all that such a system would require. The reduced width would reduce construction cost while still providing excess capacity. Passengers would arrive at destinations much sooner than by bus as the autos would get there at 30 miles per hour without stopping even once. This translates to a 2-mile trip taking 4 minutes! Compare that to any experience you have had taking a bus.  The speed of movement also helps make each vehicle available to many more passengers during a day. While it is still unproven, this technology appears to offer significant cost/benefit vs other alternatives.

Conclusion

The population expansion within urban areas will continue to drive increased traffic unless additional solutions are implemented. If it works as well in practice as it does in theory, an ACRT like the one described above offers one potential way of improving transport efficiency. However, this is only one of many potential approaches to solving the problem of increased congestion. Regardless of the technology used, this is a space where innovation must happen if cities are to remain livable. While investment in underground rail is also a potential way of mitigating the problem, it will remain an extremely costly alternative unless innovation occurs in that domain.

The Business of Theater

Earnest Shackleton

I have become quite interested in analyzing theater, in particular, Broadway and Off-Broadway shows for two reasons:

  1. I’m struck by the fact that revenue for the show Hamilton is shaping up like a Unicorn tech company
  2. My son Matthew is producing a show that is now launching at a NYC theater, and as I have been able to closely observe the 10-year process of it getting to New York, I see many attributes that are consistent with a startup in tech.

Incubation

It is fitting that Matthew’s show, Ernest Shackleton Loves Me, was first incubated at Theatreworks, San Francisco, as it is the primary theater of Silicon Valley. Each year the company hosts a “writer’s retreat” to help incubate new shows. Teams go there for a week to work on the shows, all expenses paid. Theatreworks supplies actors, musicians, and support so the creators can see how songs and scenes seem to work (or not) when performed. Show creators exchange ideas much like what happens at a tech incubator. At the culmination of the week, a part of each show is performed before a live audience to get feedback.

Creation of the Beta Version

After attending the writer’s retreat the creators of Shackleton needed to do two things: find a producer (like a VC, a Producer is a backer of the show that recruits others to help finance the project); and add other key players to the team – a book writer, director, actors, etc. Recruiting strong players for each of these positions doesn’t guarantee success but certainly increases the probability. In the case of Shackleton, Matthew came on as lead producer and he and the team did quite well in getting a Tony winning book writer, an Obie winning director and very successful actors on board. Once this team was together an early (beta version) of the show was created and it was performed to an audience of potential investors (the pitch). Early investors in the show are like angel investors as risk is higher at this point.

Beta Testing

The next step was to run a beta test of the product – called the “out of town tryout”. In general, out of town is anyplace other than New York City. It is used to do continuous improvement of the show much like beta testing is used to iterate a technology product based on user feedback. Theater critics also review shows in each city where they are performed. Ernest Shackleton Loves Me (Shackleton) had three runs outside of NYC: Seattle, New Jersey and Boston. During each, the show was improved based on audience and critic reaction. While it received rave reviews in each location, critics and the live audience can be helpful as they usually still can suggest ways that a show can be improved. Responding to that feedback helps prepare a show for a New York run.

Completing the Funding

Like a tech startup, it becomes easier to raise money in theater once the product is complete. In theater, a great deal of funding is required for the steps mentioned above, but it is difficult to obtain the bulk of funding to bring a show to New York for most shows without having actual performances. An average musical that goes to Off-Broadway will require $1.0 – $2.0 million in capitalization. And an average one that goes to Broadway tends to capitalize between $8 – $17 million. Hamilton cost roughly $12.5 million to produce, while Shackleton will capitalize at the lower end of the Off-Broadway range due to having a small cast and relatively efficient management. For many shows the completion of funding goes through the early days of the NYC run. It is not unusual for a show to announce it will open at a certain theater on a certain date and then be unable to raise the incremental money needed to do so. Like a tech startup, some shows, like Shackleton, may run a crowdfunding campaign to help top off its funding.

You can see what a campaign for a theater production looks like by clicking on this link and perhaps support the arts, or by buying tickets on the website (since the producer is my son, I had to include that small ask)!

The Product Launch

Assuming funding is sufficient and a theater has been secured (there currently is a shortage of Broadway theaters), the New York run then begins.  This is the true “product launch”. Part of a shows capitalization may be needed to fund a shortfall in revenue versus weekly cost during the first few weeks of the show as reviews plus word of mouth are often needed to help drive revenue above weekly break-even. Part of the reason so many Broadway shows employ famous Hollywood stars or are revivals of shows that had prior success and/or are based on a movie, TV show, or other well-known property is to insure substantial initial audiences. Some examples of this currently on Broadway are Hamilton (bestselling book), Aladdin (movie), Beautiful (Carole King story), Chicago (revival of successful show), Groundhog Day (movie), Hello Dolly (revival plus Bette Midler as star) and Sunset Boulevard (revival plus Glenn Close as star).

Crossing Weekly Break Even

Gross weekly burn for shows have a wide range (just like startups), with Broadway musicals having weekly costs from $500,000 to about $800,000 and Off-Broadway musicals in the $50,000 to $200,000 range. In addition, there are royalties of roughly 10% of revenue that go to a variety of players like the composer, book writer, etc. Hamilton has about $650,000 in weekly cost and roughly a $740,000 breakeven level when royalties are factored in.  Shackleton weekly costs are about $53,000, at the low end of the range for an off-Broadway musical, at under 10% of Hamilton’s weekly cost.

Is Hamilton the Facebook of Broadway?

Successful Broadway shows have multiple sources of revenue and can return significant multiples to investors.

Chart 1: A ‘Hits’ Business Example Capital Account

Since Shackleton just had its first performance on April 14, it’s too early to predict what the profit (or loss) picture will be for investors. On the other hand, Hamilton already has a track record that can be analyzed. In its first months on Broadway the show was grossing about $2 million per week which I estimate drove about $ 1 million per week in profits. Financial investors, like preferred shareholders of a startup, are entitled to the equivalent of “liquidation preferences”. This meant that investors recouped their money in a very short period, perhaps as little as 13 weeks. Once they recouped 110%, the producer began splitting profits with financial investors. This reduced the financial investors to roughly 42% of profits. In the early days of the Hamilton run, scalpers were reselling tickets at enormous profits. When my wife and I went to see the show in New York (March 2016) we paid $165 per ticket for great orchestra seats which we could have resold for $2500 per seat! Instead, we went and enjoyed the show. But if a scalper owned those tickets they could have made 15 times their money. Subsequently, the company decided to capture a portion of this revenue by adjusting seat prices for the better seats and as a result the show now grosses nearly $3 million per week. Since fixed weekly costs probably did not change, I estimate weekly profits are now about $1.8 million. At 42% of this, investors would be accruing roughly $750,000 per week. At this run rate, investors would receive over 3X their investment dollars annually from this revenue source alone if prices held up.

Multiple Companies Amplify Revenue and Profits

Currently Hamilton has a second permanent show in Chicago, a national touring company in San Francisco (until August when it’s supposed to move to LA) and has announced a second touring company that will begin the tour in Seattle in early 2018 before moving to Las Vegas and Cleveland and other stops. I believe it will also have a fifth company in London and a sixth in Asia by late 2018 or early 2019. Surprisingly, the touring companies can, in some cities, generate more weekly revenue than the Broadway company due to larger venues. Table 1 shows an estimate of the revenue per performance in the sold out San Francisco venue, the Orpheum Theater which has a capacity 2203 versus the Broadway capacity (Richard Rogers Theater) of 1319.

Table 1: Hamilton San Francisco Revenue Estimates

While one would expect Broadway prices to be higher, this has not been the case. I estimate the average ticket price in San Francisco to be $339 whereas the average on Broadway is now $282. The combination of 67% higher seating capacity and 20% higher average ticket prices means the revenue per week in San Francisco is now close to $6 million. Since it was lower in the first 4 weeks of the 21 plus week run, I estimate the total revenue for the run to be about $120 million. Given the explosive revenue, I wouldn’t be surprised if the run in San Francisco was extended again. While it has not been disclosed what share of this revenue goes to the production company, normally the production company is compensated as a base guarantee level plus a share of the profits (overage) after the venue covers its labor and marketing costs. Given these high weekly grosses, I assume the production company’s share is close to 50% of the grosses given the enormous profits versus an average show at the San Francisco venue (this would include both guarantee and overage). At 50% of revenue, there would still be almost $3 million per week to go towards paying the production company expenses (guarantee) and the local theater’s labor and marketing costs. If I use a lower $2 million of company share per week as profits to the production company that annualizes at over $100 million in additional profits or $42 million more per year for financial investors. The Chicago company is generating lower revenue than in San Francisco as the theater is smaller (1800 seats) and average ticket prices appear to be closer to $200. This would make revenue roughly $2.8 million per week. When the show ramps to 6 companies (I think by early 2019) the show could be generating aggregate revenue of $18-20 million per week or more should demand hold up. So, it would not be surprising if annual ticket revenue exceeded $1 billion per year at that time.

Merchandise adds to the mix

I’m not sure what amount of income each item of merchandise generates to the production company. Items like the cast album and music downloads could generate over $25 million in revenue, but in general only 40% of the net income from this comes to the company. On the other hand, T-shirts ($50 each) and the high-end program ($20 each) have extremely large margin which I think would accrue to the production company. If an average attendee of the show across the 6 (future) or more production companies spent $15 this could mean $1.2 million in merchandise sales per week across the 6 companies or another $60 million per year in revenue. At 60% gross margin this would add another $36 million in profits.

I expect Total Revenue for Hamilton to exceed $10 billion

In addition to the sources of revenue outlined above Hamilton will also have the opportunity for licensing to schools and others to perform the show, a movie, additional touring companies and more.  It seems likely to easily surpass the $6 billion that Lion King and Phantom are reported to have grossed to date, or the $4 billion so far for Wicked. In fact, I believe it eventually will gross over a $10 billion total. How this gets divided between the various players is more difficult to fully access but investors appear likely to receive over 100x their investment, Lin-Manuel Miranda could net as much as $ 1 billion (before taxes) and many other participants should become millionaires.

Surprisingly Hamilton may not generate the Highest Multiple for Theater Investors!

Believe it or not, a very modest musical with 2 actors appears to be the winner as far as return on investment. It is The Fantasticks which because of its low budget and excellent financial performance sustained over decades is now over a 250X return on invested capital. Obviously, my son, an optimistic entrepreneur, hopes his 2 actor musical, Ernest Shackleton Loves Me, will match this record.