Recap of 2019 Top Ten Predictions

Bull Markets have Tended to Favor My Stock Picks

I entered 2019 with some trepidation as my favored stocks are high beta and if the bear market of the latter portion of 2018 continued, I wasn’t sure I would once again beat the market…it was a pretty close call last year. However, I felt the companies I liked would continue to grow their revenue and hoped the market would reward their performance. As it turns out, the 5 stocks I included in my top ten list each showed solid company performance and the market returned to the bull side. The average gain for the stocks was 45.7% (versus the S&P gain of 24.3%).

Before reviewing each of my top ten from last year, I would like to once again reveal long term performance of the stock pick portion of my top ten list. For my picks, I assume equal weighting for each stock in each year to come up with my performance and then compound the yearly gains (or losses) to provide my 6-year performance. For the S&P my source is Multpl.com.  I’m comparing the S&P index at January 2 of each year to determine annual performance.  My compound gain for the 6-year period is 499% which equates to an IRR of 34.8%. The S&P was up 78% during the same 6-year period, an IRR of 10.1%.

The 2019 Top Ten Predictions Recap

One of my New Year’s pledges was to be more humble, so I would like to point out that I wasn’t 10 for 10 on my picks. One of my 5 stocks slightly under-performed the market and one of my non-stock forecasts was a mixed bag. The miss on the non-stock side was the only forecast outside of tech, once again highlighting that I am much better off sticking to the sector I know best (good advice for readers as well). However, I believe I had a pretty solid year in my forecasts as my stock portfolio (5 of the picks) significantly outperformed the market, with two at approximately market performance and three having amazing performance with increases of 51% to 72%. Regarding the 5 non-stock predictions, 4 were right on target and the 5th was very mixed. As a quick reminder, my predictions were:

Stock Portfolio 2019 Picks:

  • Tesla stock will outpace the market (it closed last year at $333/share and opened this year at $310)
  • Facebook Stock will outpace the market (it closed last year at $131/share)
  • Amazon Stock will outpace the market (it opened the year at $1502/share)
  • Stitch Fix stock appreciation will outpace the market (it closed last year at $17/share)
  • DocuSign stock will outpace the market in 2019 (it is currently at $43/share and opened the year at $41)

5 Non-Stock Predictions:

  • Replacing cashiers with technology will be proven out in 2019
  • Replacing cooks, baristas, and waitstaff with robots will begin to be proven in 2019
  • Influencers will be increasingly utilized to directly drive commerce
  • The Cannabis Sector should show substantial gains in 2019
  • 2019 will be the year of the unicorn IPO

In the discussion below, I’ve listed in bold each of my ten predictions and give an evaluation of how I fared on each.

Tesla stock will outpace the market (it closed last year at $333/share and opened this year at $310)

Tesla proved to be a rocky ride through 2019 as detractors of the company created quite a bit of fear towards the middle of the year, driving the stock to a low of $177 in June. A sequence of good news followed, and the stock recovered and reached a high of $379 in front of the truck unveiling. I’m a very simplistic guy when I evaluate success as I use actual success as the measure as opposed to whether I would buy a product. Critics of the truck used Elon’s unsuccessful demonstration of the truck being “bulletproof” and the fact that it was missing mirrors and windshield wipers to criticize it. Since it is not expected to be production ready for about two years this is ridiculous! If the same critics applied a similar level of skepticism to the state of other planned competitive electric vehicles (some of which are two plus years away) one could conclude that none of them will be ready on time. I certainly think the various announced electric vehicles from others will all eventually ship, but do not expect them to match the Tesla battery and software capability given its 3 to 5-year lead. I said I’m a simple guy, so when I evaluate the truck, I look at the 250,000 pre-orders and notice it equates to over $12.5B in incremental revenue for the product! While many of these pre-orders will not convert, others likely will step in. To me that is strong indication that the truck will be an important contributor to Tesla growth once it goes into production.

Tesla stock recovered from the bad press surrounding the truck as orders for it mounted, the Chinese factory launch was on target and back order volume in the U.S. kept factories at maximum production.  Given a late year run the stock was up to $418 by year end, up 34.9% from the January opening price. But for continuing recommendations I use the prior year’s close as the benchmark (for measuring my performance) which places the gain at a lower 25.6% year over year as the January opening price was lower than the December 31 close. Either way this was a successful recommendation.

Facebook Stock will outpace the market (it closed last year at $131/share)

Facebook, like Tesla, has many critics regarding its stock. In 2018 this led to a 28% decline in the stock. The problem for the critics is that it keeps turning out very strong financial numbers and eventually the stock price has to recognize that. It appears that 2019 revenue will be up roughly 30% over 2018. After several quarters of extraordinary expenses, the company returned to “normal” earnings levels of about 35% of revenue in the September quarter. I expect Q4 to be at a similar or even stronger profit level as it is the seasonally strongest quarter of the year given the company’s ability to charge high Christmas season advertising rates. As a result, the stock has had a banner year increasing to $205/share at year-end up 57% over the prior year’s close making this pick one of my three major winners.

Amazon Stock will outpace the market (it opened the year at $1502/share)

Amazon had another very solid growth year and the stock kept pace with its growth. Revenue will be up about 20% over 2018 and gross margins remain in the 40% range. For Amazon, Q4 is a wildly seasonal quarter where revenue could jump by close to 30% sequentially. While the incremental revenue tends to have gross margins in the 25% – 30% range as it is heavily driven by ecommerce, the company could post a solid profit increase over Q3. The stock pretty much followed revenue growth, posting a 23% year over year gain closing the year at $1848 per share. I view this as another winner, but it slightly under-performed the S&P index.

Stitch Fix stock appreciation will outpace the market (it closed last year at $17/share)

Stitch Fix, unlike many of the recent IPO companies, has shown an ability to balance growth and earnings. In its fiscal year ending in July, year over year growth increased from 26% in FY 2018 to over 28% in FY 2019 (although without the extra week in Q4 of FY 2019 year over year growth would have been about the same as the prior year). For fiscal 2020, the company guidance is for 23% – 25% revenue growth after adjusting for the extra week in Q4 of FY 2019. On December 9th, Stitch Fix reported Q1 results that exceeded market expectations. The stock reacted well ending the year at $25.66 per share and the year over year gain in calendar 2019 moved to a stellar level of 51% over the 2018 closing price.

DocuSign stock will outpace the market in 2019 (it is currently at $43/share and opened the year at $41)

DocuSign continued to execute well throughout calendar 2019. On December 5th it reported 40% revenue growth in its October quarter, exceeding analyst expectations. Given this momentum, DocuSign stock was the largest gainer among our 5 picks at 72% for the year ending at just over $74 per share (since this was a new recommendation, I used the higher $43 price at the time of the post to measure performance). The company also gave evidence that it is reducing losses and not burning cash. Since ~95% of its revenue is subscription, the company is able to maintain close to 80% gross margin (on a proforma basis) and is well positioned to continue to drive growth. But, remember that growth declines for very high growth companies so I would expect somewhat slower growth than 40% in 2020.

Replacing cashiers with technology will be proven out in 2019

A year ago, I emphasized that Amazon was in the early experimental phase of its Go Stores which are essentially cashierless using technology to record purchases and to bill for them. The company now has opened or announced 21 of these stores. The pace is slower than I expected as Amazon is still optimizing the experience and lowering the cost of the technology. Now, according to Bloomberg, the company appears ready to:

  • Open larger format supermarkets using the technology
  • Increase the pace of adding smaller format locations
  • Begin licensing the technology to other retailers, replicating the strategy it deployed in rolling out Amazon Web Services to others

Replacing cooks, baristas, and waitstaff with robots will begin to be proven in 2019

The rise of the robots for replacing baristas, cooks and waitstaff did indeed accelerate in 2019. In the coffee arena, Briggo now has robots making coffee in 7 locations (soon to be in SFO and already in the Austin Airport), Café X robotic coffee makers are now in 3 locations, and there are even other robots making coffee in Russia (GBL Robotics), Australia (Aabak) and Japan (HIS Co). There is similar expansion of robotic pizza and burger cooks from players like Zume Pizza and Creator and numerous robots now serving food. This emerging trend has been proven to work. As the cost of robots decline and minimum wage rises there will be further expansion of this usage including franchise approaches that might start in 2020.

Influencers will be increasingly utilized to directly drive commerce

The use of influencers to drive commerce accelerated in 2019. Possibly the most important development in the arena was the April 2019 launch by Instagram of social commerce. Instagram now let’s influencers use the app to tag and sell products directly, that is, their posts can be “shoppable”. Part of the series of steps Instagram took was adding “checkout” which lets customers purchase products without leaving the walls of the app.

A second increase in the trend is for major influencers to own a portion of companies that depend on their influence to drive a large volume of traffic. In that way they can capture more of the value of their immense influence. Using this concept, Rihanna has become the wealthiest female musician in the world at an estimated net worth of $600 million. The vast majority of her wealth is from ownership in companies where she uses her influence to drive revenue. The two primary ones are Fenty Beauty and Fenty Maison. Fenty Beauty was launched in late 2017 and appears to be valued at over $3 billion. Rihanna owns 15% – do the math! Fenty Maison is a partnership between LVMH (the largest luxury brand owner) and Rihanna announced in May of 2019. It is targeting fashion products and marks the first time the luxury conglomerate has launched a fashion brand from scratch since 1987. Rihanna has more than 70 million followers on Instagram and this clearly establishes her as someone who can influence commerce.

The Cannabis Sector should show substantial gains in 2019

The accuracy of this forecast was a mixed bag as the key companies grew revenue at extremely high rates, but their stock valuations declined resulting in poor performance of the cannabis index (which I had said should be a barometer). A few examples of the performance of the largest public companies in the sector are shown in Table 2.

Table 2: Performance of Largest Public Cannabis Companies

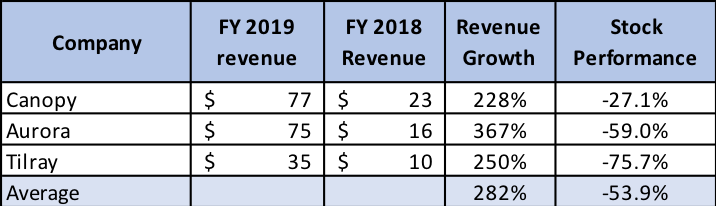
*Note: Canopy last quarter was Sept 2019

In each case, the last reported quarter was calendar Q3. For Tilray, I subtracted the revenue from its acquisition of Manitoba Harvest so that the growth shown is organic growth. I consider this forecast a hit and a miss as I was correct regarding revenue (it was up an average of 282%) but the stocks did not follow suit, even modestly, as the average of the three was a decline of 54%. While my forecast was not for any individual company or stock in the sector, it was wrong regarding the stocks but right regarding company growth. The conclusion is humbling as I’m glad that I exercised constraint in not investing in a sector where I do not have solid knowledge of the way the stocks might perform.

2019 will be the year of the unicorn IPO

This proved true as many of the largest unicorns went public in 2019. Some of the most famous ones included on the list are: Beyond Meat, Chewy, Lyft, Peloton, Pinterest, Slack, The Real Real, Uber and Zoom. Of the 9 shown, four had initial valuations between $8 billion and $12 billion, two over $20 billion and Uber was the highest at an $82 billion valuation. Some unicorns found the public markets not as accepting of losses as the private market, with Lyft and Uber stock coming under considerable pressure and WeWork unable to find public buyers of its stock leading to a failed IPO and shakeup of company management. There is more to come in 2020 including another mega one: Airbnb.

2020 Predictions coming soon

Stay tuned for my top ten predictions for 2020…but please note that all 5 of the stocks recommended for 2019 will remain on the list.

Soundbyte

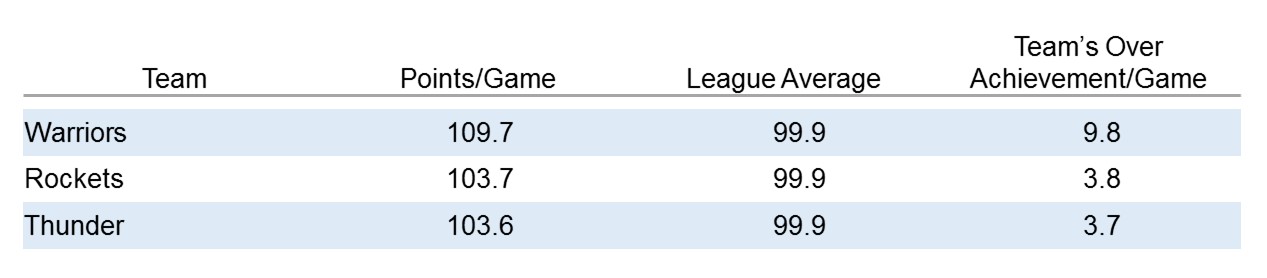
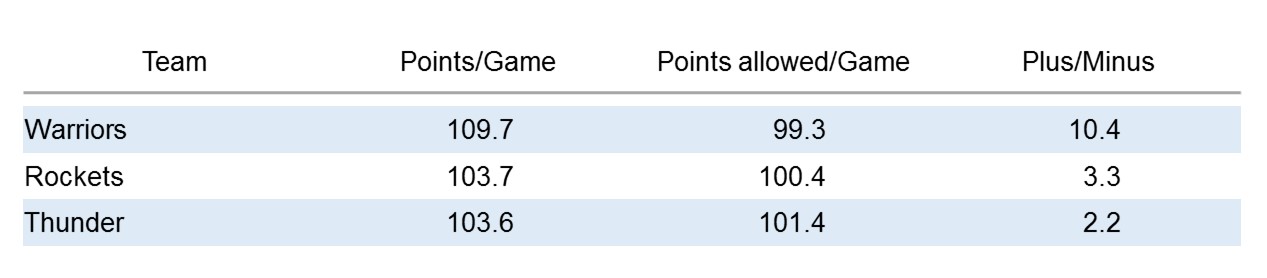
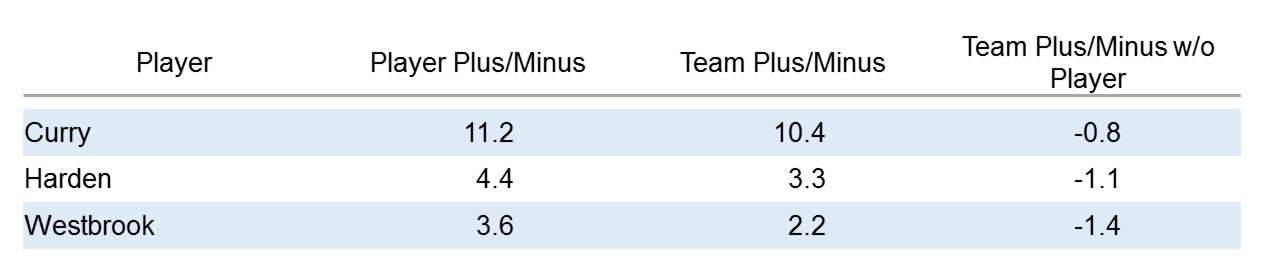
  • Before the basketball season began, I had a post predicting that the Warriors still had a reasonable chance to make the playoffs (if Klay returned in late February). Talk about feeling humble! I guess, counting this I had 3 misses on my predictions.

2019 Top Ten Predictions

Opportunity Knocks!

The 2018 December selloff provides buying opportunity

One person’s loss is another’s gain. The market contraction in the last quarter of the year means that most stocks are at much lower prices than they were in Q3 of 2018. The 5 stocks that I’m recommending (and already own) were down considerably from their Q3 2018 highs. While this may be wishful thinking, returning to those highs by the end of 2019 would provide an average gain of 78%. Each of the 5 had revenue growth of 25% or more last year (and 3 were over 35%) and each is poised for another strong year in 2019.

For the 4 continued recommendations (all of which I mentioned I would recommend again in my last post), I’ll compare closing price on December 31, 2019 to the close on December 31, 2018 for calculating performance. For the new add to my list, I’ll use the stock price as I write this post. I won’t attempt to predict the overall market again (I’m just not that good at it) but feel that the 14% drop in Q4 means there is a better chance that it won’t take a nosedive. However, since stock picks are always relative to the market, success is based on whether my picks, on average, outperform the market.

I’ll start the post with stock picks and then follow with the remaining 5 predictions.

 2019 Stocks  

Tesla stock will outpace the market (it closed last year at $333/share and is essentially the same as I write this)

In Q3, 2018 the Tesla model 3 was the bestselling car in the U.S. in terms of revenue and 5th highest by volume. This drove a 129% revenue increase versus a year earlier and $1.75 in earnings per share versus a loss of $4.22 in the prior quarter. I expect Q4 revenue to increase sequentially and growth year/year to exceed 100%. In Q3, Tesla reported that nearly half of vehicles traded in for the Model 3 were originally priced below $35,000. As Tesla begins offering sub-$40,000 versions of it, demand should include many buyers from this high-volume price range. Since the backlog for the Model 3 is about 300,000 units I expect 2019 sales to remain supply constrained if Tesla can offer lower price points (it already has announced a $2,000 price reduction). The important caveat to demand is that tax credits will be cut in H1 2019, from $7500 to $3750 and then cut again to $1875 in the second half of the year. Part of Tesla’s rationale for a $2000 price drop is to substantially offset the initial reduction of these tax credits.

Tesla began taking orders for its Q1 launch in Europe where demand over time could replicate that in the U.S. The average price of a Model 3 will initially be about $10,000 higher than in the U.S. Tesla is also building a major manufacturing facility in China (where Model 3 prices are currently over $20,000 higher than the U.S.). This Giga-Factory is expected to begin production in the latter half of 2019. While moving production to China for vehicles sold there should eliminate trade war issues, Tesla still expects to begin delivering Model 3s to Chinese customers in March.

The combination of a large backlog, reducing prices within the U.S. and launches in Europe and China should generate strong growth in 2019. Some investors fear price reductions might lead to lower gross margins. When I followed PC stocks on Wall Street, this was a constant question. My answer is the same as what proved true there: strong opportunity for continuous cost reduction should enable gross margins to remain in the 20-25% range in any location that is at volume production. So, perhaps the Chinese Giga-Factory and a future European factory will start at lower margins while volume ramps but expect margins in the U.S. (the bulk of revenue in 2019) to remain in the targeted range. Higher prices in Europe and China due to massive initial demand allows premium pricing which may keep margins close to 20%+ in each.

Facebook stock will outpace the market (it closed last year at $131/share).

Facebook underperformed in 2018, closing the year down 28% despite revenue growth that should be 35% to 40% and EPS tracking to about 36% growth (despite a massive increase in SG&A to spur future results).  The stock reacted to the plethora of criticism regarding privacy of user information coupled with the continuing charges of Russian use of Facebook to impact the election. Before the wave of negative publicity, Facebook reached a high of $218/share in July. Facebook is likely to continue to increase its spending to address privacy issues and to burnish its image. However, scaling revenue could mean it keeps operating margins at a comparable level to 2018 rather than increasing them. Rumors of Facebook’s demise seem highly exaggerated!  According to a December 2018 JP Morgan survey of U.S. Internet users, the three most used social media products were Facebook (88% of participants), Facebook Messenger (61%) and Instagram (47%). Also, 82% of those surveyed picked a Facebook-owned platform as being the most important to them. Finally, the average Facebook user reported checking Facebook roughly 5 times per day with 56% of users spending 15 minutes to an hour or more on the platform on an average day. While Facebook has experienced a minor decrease in overall usage, Instagram usage has increased dramatically. Facebook, Instagram, and WhatsApp together give the company a growing and dominant position.

At the beginning of 2018 Facebook stock was trading at 34 times trailing EPS. By the end of the year the multiple of trailing EPS was below 18. If I assume EPS can grow 20%+ in 2019 (which is below my expectation but higher than the consensus forecast) than a multiple of 20 would put the stock at about $180/share by December 31. If it grew EPS, more in line with revenue and/or returned to a multiple closer to 34 it could reach well over 200.

Two key factors:

  1. A 20% increase in revenue (I expect the increase to be about 30%) adds over $11 billion in revenue. A comparable 20% increase in SG&A would provide over $4 billion in additional money to spend, affording the company ample dollars to devote to incremental marketing without impacting operating margins.
  2. Given the “low” stock price, Facebook increased its buyback program by $9 billion to $15 billion. Since it generates $6B – $7B in cash per quarter from operations (before capex) and has roughly $40 billion in cash and equivalents it could easily increase this further if the stock remains weak. The $15 billion could reduce the share count by as much as 3% in turn increasing EPS by a similar amount.

Amazon stock will outpace the market (it closed last year at $1502/share).

While its stock dropped from its September high of $2050, Amazon remained one of the best market performers in 2018 closing the year at $1502/share. At its 2018 high of $2050, It may have gotten ahead of itself, but at year end it was up less than 2018 revenue growth. Leveraging increased scale meant net income grew faster than revenue and is likely to triple from 2017. Growth will be lower in Q4 then Q3 as Q4 2017 was the first quarter that included all revenue from Whole Foods. Still, I would not be surprised if Amazon beat expectations in Q4 since this is already factored into analyst forecasts. Amazon trades on revenue coupled with the prospect of increasingly mining the revenue into higher profits. But the company will always prioritize making long term investments over maximizing near term earnings. Growth in the core ecommerce business is likely to gradually slow, but Amazon has created numerous revenue streams like its cloud and echo/Alexa businesses that I expect to result in maintaining revenue growth in the 20% plus range in 2019. The prospect of competing with an efficient new brick and mortar offering (see prediction 6 in this post) could drive new excitement around the stock.

Profitability in 2019 could be reduced by: announced salary increases to low end workers; increasing the number of physical store locations; and greater marketing incentives for customers. Offsets to this include higher growth in stronger margin businesses like AWS and subscription services. The stock may gyrate a bit, but I expect it to continue to outperform.

Stitch Fix stock will outpace the market (it closed last year at $17/share).

In my 2018 forecast I called this my riskiest pick and it was the most volatile which is saying a lot given the turbulence experience by Facebook, Tesla, and Amazon. I was feeling pretty smug when the stock reached a high of $52/share in September! I’m not sure how much of the subsequent drop was due to VCs and other early investors reducing their positions but this can have an impact on newly minted public companies. Whatever the case, the stock dropped from September’s high to a low point of $17.09 by year’s end. The drop was despite the company doing a good job balancing growth and profitability with October quarter revenue up 24% and earnings at $10.7 million up from $1.3 million in the prior year. Both beat analyst expectations. The stock was impacted because the number of users grew 22% (1-2% less than expected) despite revenue exceeding expectations at 24% growth. I’m not sure why this was an issue.

Stitch Fix continues to add higher-end brands and to increase its reach into men, plus sizes and kids. Its algorithms to personalize each box of clothes it ships keeps improving. Therefore, the company can spend less on acquiring new customers as it has increased its ability to get existing customers to spend more and come back more often. I believe the company can grow by roughly 20% or more in 2019. If it does and achieves anything close to the revenue multiple that it started with in 2018 (before the multiple doubled in mid-year), there would be a sizeable stock gain this year. But it is a thinly traded stock and likely to be quite volatile.

Docusign Stock will outpace the market in 2019 (it is currently at $43/share).

Docusign is a new recommendation. Like Stitch Fix, it is a recent IPO and could be volatile. Docusign is the runaway leader in e-signatures, facilitating multiple parties signing documents in a secure, reliable way on board resolutions, mortgages, investment documents, etc. Strong positives include:

  • A high value for a reasonable price – I am increasingly annoyed when I need to deal with manual signatures for documents.
  • As of October 31, 2018, Docusign had over 450,000 customers up from 350,000 customers one year earlier. Of which 50,000 are Enterprise/Commercial accounts;
  • There are hundreds of millions of users whose e-signatures are stored by the company making the network effect quite large;
  • Roughly 95% of revenue is from its SaaS product which has 80% gross margin with the rest from services where margins have improved and are now positive;
  • As a SaaS company with a stable revenue base growth is more predictable. The company exceeded revenue guidance each quarter with the October 31, 2018 quarter revenue up 37%;
  • Most customers pay annually in advance. This means cash flow from operations is positive despite the company recording an operating loss;
  • Customers expand their use resulting in retained customers growing revenue faster than decreases from churned customers making net revenue retention over 100%;
  • International expansion remains a large opportunity as international is only 18% of revenue.

Picks 6 – 10: Major Trends that will surface in 2019

I developed my primary method of stock picking at my first Wall Street firm, Stanford Bernstein. The head of research there, Chuck Cahn, emphasized that you could get small wins by correctly determining that a stock would trade up on certain news like a new product, a big customer win, and beating consensus forecasts. But larger and more predictable wins of 5X or more were possible if one identified a long-term winner riding a major trend and stuck with it for multiple years. All 5 of my stock picks fall into the latter category. I’ve been recommending Facebook, Tesla, and Amazon for 4 years or more. All 3 are now over 5X from when I first targeted them as I bought Tesla at $46 and Facebook at $24 in 2013 (before this blog) and they have been in my top 10 since. Amazon was first included in 2015 when it was at $288/share. Stitch Fix and DocuSign are riskier but if successful have substantial upside since both are early in their run of leveraging their key trends.

The next 4 picks are in early stages of trends that could lead to current and next generation companies experiencing benefits for many years. The first two go hand in hand as each describes transformation of physical retail/restaurants, namely, replacing staff with technology in a way that improves the customer experience. This is possible because we are getting closer to the tipping point where the front-end investment in technology can have a solid ROI from subsequent cost savings.

Replacing Cashiers with technology will be proven out in 2019

In October 2015 I predicted that Amazon (and others like Warby Parker) would move into physical retail between then and 2020. This has occurred with Amazon first opening bookstores and then buying Whole Foods, and Warby Parker expanding its number of physical locations to about 100 by the end of 2018. My reasoning then was simple: over 92% of purchases in the U.S. were made offline. Since Amazon had substantial share of e-commerce it would begin to have its growth limited if it didn’t create an off-line presence.

Now, for Amazon to maintain a 20% or greater revenue growth rate it’s even more important for it to increase its attack on offline commerce (now about 90% of U.S. retail) I’m not saying it won’t continue to try to increase its 50% share of online but at its current size offline offers a greater opportunity for growth.

A key to Amazon’s success has been its ability to attack new markets in ways that give it a competitive advantage. Examples of this are numerous but three of the most striking are Amazon Cloud Services (where it is the industry leader), the Kindle (allowing it to own 70% share of eBook sales) and Prime (converting millions of customers to a subscription which in turn incentivized buying more from Amazon due to free shipping).

Now the company is testing an effort to transform brick and mortar retail by replacing staff with technology and in doing so improving the buying experience. The format is called Go stores and there are currently 5 test locations. Downloading the Amazon Go App enables the user to use it to open the automated doors. The store is stocked (I think by actual people) with many of the same categories of products as a 7-Eleven, in a more modern way. Food items include La Boulangerie pastries, sushi, salads, an assortment of sandwiches and even meal kits. Like a 7-Eleven, it also has convenience items like cold medicine, aspirins, etc. The store uses cameras and sensors to track your movements, items you remove from the shelves and even whether you put an item back. When you leave, the app provides you with a digital receipt. Not only does the removal of cashiers save Amazon money but the system improves customer service by eliminating any need to wait in line. I expect Amazon to open thousands of these stores over the next 3-5 years as it perfects the concept. In the future I believe it will have locations that offer different types of inventory. While Amazon may be an early experimenter here, there is opportunity for others to offer similar locations relying on third party technology.

Replacing Cooks, Baristas and Waitstaff with robots will begin to be proven in 2019

The second step in reducing physical location staff will accelerate in 2019. There are already:

  1. Robotic coffee bars:  CafeX opened in San Francisco last year, and in them one orders drip coffee, cappuccino, latte, or hot chocolate using an app on your phone or an iPad available at a kiosk. The coffee is made and served by a robot “barista” with the charge automatically put on your credit card. Ordering, billing, and preparation are automatic, but there is still one staff member in the shop to make sure things go smoothly.
  2. The first robotic burger restaurant: Creator opened in San Francisco last June. It was in beta mode through September before opening to the general public. While a “robot” makes the burgers, Creator is not as automated as CafeX as humans prepare the sauces and prep the items that go into the machine. Creator also hasn’t automated ordering/payment. Startup Momentum Machines expects to open a robotic burger restaurant and has gotten substantial backing from well-known VCs.
  3. Robots replacing waitstaff: For example, at Robo Sushi in Toronto, a “Butlertron” escorts you to your table, you order via an iPad and a second robot delivers your meal. Unlike the robots in the coffee bar and burger restaurant these are made into cute characters rather than a machine. Several Japanese companies are investing in robotic machines that make several of the items offered at a sushi restaurant.
  4. Robotic Pizza restaurants: The furthest along in automation is the Pizza industry. Zume Pizza, a startup that uses robots to make pizzas, has recently received a $375 million investment from Softbank. Zume currently uses a mix of humans and robots to create and deliver their pizzas and is operational in the Bay Area. Pizza Hut and Dominos are working on drones and/or self-driving vehicles to deliver pizzas. And Little Caesars was just issued a patent for a robotic arm and other automated mechanisms used to create a pizza.

At CES, a robot that makes breads was announced. What all these have in common is replacing low end high turnover employees with technology for repetitive tasks. The cost of labor continues to rise while the cost of technology shrinks a la Moore’s Law. It is just a matter of time before these early experiments turn into a flood of change. I expect many of these experiments will turn into “proof points” in 2019. Successful experiments will generate substantial adoption in subsequent years. Opportunities exist to invest in both suppliers and users of many robotic technologies.

“Influencers” will be increasingly utilized to directly drive Commerce

Companies have long employed Influencers as spokespersons for products and in some cases even as brands (a la Michael Jordon and Stephan Curry basketball shoes or George Forman Grills). They appear on TV ads for products and sometimes used their social reach to tout them. Blogger, a prior Azure investment, understood how to use popular bloggers in advertising campaigns. But Blogger ads, like most TV ads did not directly offer the products to potential customers. Now we are on the verge of two major changes: tech players creating structured ways to enable fans of major influencers (with millions of followers) to use one-click to directly buy products; and technology companies that can economically harness the cumulative power of hundreds of micro-influencers (tens of thousands of fans) to replicate the reach of a major influencer. I expect to see strong growth in this method of Social Commerce this year.

The Cannabis Sector should show substantial gains in 2019

In my last post I said about the Cannabis Sector: “The industry remains at a very early stage, but numerous companies are now public, and the recent market correction has the shares of most of these at more reasonable levels. While I urge great care in stock selection, it appears that the industry has emerged as one to consider investing in.” Earlier in this post, I mentioned that riding a multi-year wave with a winning company in that segment is a way to have strong returns. I’m not knowledgeable enough regarding public Cannabis companies, so I haven’t included any among my stock recommendations. However, I expect industry wide revenue to grow exponentially. The 12 largest public Cannabis companies by descending market cap are: Canopy Growth Corp (the largest at over $11B), Tilray, Aurora Cannabis, GW Pharmaceuticals, Curealeaf Holdings, Aphria, Green Thumb Industries, Cronos Group, Medmen Enterprises, Acreage Holdings, Charlotte’s Web Holdings and Trulieve Cannabis.

I believe one or more of these will deliver major returns over the next 5 years. Last year I felt we would see good fundamentals from the industry but that stocks were inflated. Given that the North American Cannabis Index opened this year at 208 well down from its 2018 high of 386 investing now seems timely. I’ll use this index as the measure of performance of this pick.

2019 will be the Year of the Unicorn IPO

Many Unicorns went public in 2018, but this year is poised to be considerably larger and could drive the largest IPO market fund raising in at least 5 years.  Disbelievers will say: “the market is way down so companies should wait longer.” The reality is the Nasdaq is off from its all-time high in August by about 15% but is higher than its highest level at any time before 2018. Investment funds are looking for new high growth companies to invest in. It appears very likely that as many as 5 mega-players will go public this year if the market doesn’t trade off from here. Each of them is a huge brand that should have very strong individual support. Institutional investors may not be as optimistic if they are priced too high due to the prices private investors have previously paid. They are: Uber, Lyft, Airbnb, Pinterest, and Slack. Each is one of the dominant participants in a major wave, foreshadowing substantial future revenue growth. Because information has been relatively private, I have less knowledge of their business models so can’t comment on whether I would be a buyer. Assuming several of these have successful IPOs many of the other 300 or so Unicorns may rush to follow.

It will be an interesting year!

The Argument for Curry as a Unicorn

In our previous post we posed the potential for Stephen Curry to become a Unicorn (in venture this is a company that reaches $1 billion in value). While it was mostly for fun, on reflection we decided that it actually could prove valid. This post will walk you through why an athlete like Curry (or potentially James Harden, Russell Westbrook or Anthony Davis) could become a Unicorn should they be elevated to the elite status of a LeBron James.

curry unicorn

The Precedent for Creating a Corporation Owning an Athlete’s Earnings Exists

In April 2014, Vernon Davis offered stock in his future earnings via a venture with Fantex, Inc. as part of a new financial instrument being sold by Fantex. Davis offered a 10% share of all future earnings from his brand marketing company to Fantex, which would then turn around and divide it into shares of a tracking stock that can be traded within their own exchange. The offering was 421,100 shares, valued at $10 each, for a total of $4.2 million. This implied a total value of the “Vernon Davis Corporation” of $42 million. Davis’ current salary is $4.7 million and endorsement income about $1.75 million for a total income of $6.5 million. Given that the longevity of football players is rarely into their mid-thirties coupled with Davis being over 30 at the time, it seems likely that he had no more than 3-4 years left in his playing career. Putting those facts together makes it appear that Davis was unlikely to earn much more than $42 million going forward and might earn less as we would expect his income to drop precipitously once he retired. So buying the stock was probably viewed as more of a symbol of support for Davis and its “market cap” appears about equal to his expected future earnings.

NBA Stars are Among the Highest Earning Athletes’

The current highest earner of endorsements in the NBA is LeBron James at about $44 million per year (Kevin Durant is second at $35 million). The highest contract in the league is Kobe Bryant at about $23 million per year (and had been $30 million previously) with the 10 highest players in the league making an average of over $21 million. Given the new TV contract scheduled to go into effect in the 2016-2017 season, it’s been projected that the cap will increase from about  $63 million today to $90 million in 2017 and be nearly $140 million by 2025 (10 years from now, at age 37, Curry should still be playing). Let’s make the following assumptions:

  1. Curry’s salary will go from a current level of $11 million in 2015 and 12 million in 2016 (4 other Warriors will be paid more that year) to about $30 million in 2017 assuming the top salaries tend to be about 1/3 of their team’s cap as they are today.
  2. It will be up to $40 million in 2025, or less than 1/3 the projected $140 million cap.
  3. His endorsements will reach midway between the current levels experienced by LeBron and Durant, to about $40 million by 2017 (they are currently at about $5.5 million from Under Armour)
  4. His endorsement income will rise by about 10%/year subsequently, through 2025 to reach $92 million in 2025
  5. He will continue to earn endorsement income (but will retire from playing) subsequent to the 2025 season.
  6. The level post 2025 will average $60 million per year for 10 years and then go to zero.

The last assumption is based on observing the income of retired stars like Michael Jordan (earning $100 million/year 12 years after retirement), David Beckham (earned about $75 million the first year after retiring), Arnold Palmer (earned $42 million/year 40 years after winning his last tournament), Shaq ($21 million), Magic Johnson is now worth over $500 million. Each are making more now than the total they made while playing and, in several cases, more per year than in their entire playing careers. So assuming Curry’s income will drop by 1/3 after retirement is consistent with these top earners.

chart

This puts his total income from 2016 through the end of 2035 at over $1.5 billion. All of the above assumptions can prove true if Curry continues to ascend to super-star status, which would be helped if the Warriors win the championship this year. They could even prove low if Curry played longer and/or remained an icon for longer than 10 years after retiring. Thankfully, Curry has remained relatively injury free and our analysis assumes that he remains healthy. Curry is not only one of the most exciting players to watch, but is also becoming the most popular player with fans around the league. Curry now ranks second overall in total uniform sales, behind LeBron James.

So while the concept of Stephen Curry as a Unicorn (reaching $1 billion in value) started as a fun one to contemplate with our last post, further analysis reveals that it is actually possible that Fantex or some other entity could create a tracking stock that might reach that type of valuation.

As a VC, I would love to invest in him!

SoundBytes:

  • In the recent game against the Blazers there was further validation of Curry’s MVP bid. Curry delivered eight 3-pointers, hit 17 of 23 shots and went 7-of-7 in his 19-point fourth quarter. His last two threes were a combined distance of 55 feet, setting a new record for threes in a season and breaking his own record!
  • To understand just how well Curry shot, his Field Goal Efficiency was 91% (he had 8 threes bringing his equivalent field goals to 21/23). Not only was this higher than anyone who scored 40 points this year or took at least 20 shots in a game, we believe it may be among the highest ever for someone taking 20 shots in a game.
  • As a comparison, the two Portland stars, Aldredge and Lillian, each had strong games and scored 27 and 20 points, respectively. But, to do that, they took 46 shots between them (double that of Curry) and only scored 2 more points in total for the extra 23 shots!
  • The 4th quarter performance by Curry, cited above, translates to a 114% FGE rating, which is averaging more than 100% shooting as he scored 16 points on 7 shots. When foul shots are taken into account, his True Shooting % was 137% as he scored 19 points on 8 field goal attempts (counting the one on which he was fouled).To draw a comparison, when Russell Westbrook scored 54 points against Portland on April 12 he took 43 shots, 20 more than Curry (23 more if we include shots that led to foul shots).

Is Stephen Curry Becoming a Unicorn?

Why Curry should be the clear NBA MVP

Much has been written about the importance of discovering and investing early in “Unicorns”, companies that eventually cross the $1 billion valuation threshold. In basketball, teams make tough decisions as to whether to sign individual players to contracts that can be worth as much as $120 million or more over six years. The top few players can earn a billion dollars over their career when endorsements are added to the equation, assuming they can last as long as a Kobe Bryant or Tim Duncan. Clearly part of the road to riches is getting the recognition as one of the elite. This year, several players previously thought of as “quite good” are emerging in the quest to be thought of as “great”. Nothing can help a player put his stamp on such a claim as much as winning the MVP. In the spirit of trying to identify a future “Unicorn” in professional basketball, I thought it would be fun to analyze the current crop of contenders.

Given an unusual emergence of multiple stars, this year’s NBA MVP race is one of the most hotly contested in years. There are five legitimate candidates: Stephen Curry, Russell Westbrook, James Harden, Anthony Davis and LeBron James. All of them are having spectacular seasons and in most years that would be good enough for them to win. But only one can take the MVP crown. LeBron is the reigning king of the league and has long ago hoisted his flag atop the mountain. But, he has won the MVP title a number of times and while he remains a solid choice, he is not a clear choice. Therefore, it appears almost certain that most voters will favor a candidate who has yet to win. In the last few weeks Davis seems to have faded from consideration so, in this post, I will provide the analysis that has led me to determine that Curry is a more worthy recipient than Westbrook and Harden.

Scoring

Basketball columnists and analysts often focus too much of their evaluation of success on a player’s scoring average. In an attempt to help understand a player’s full value, John Hollinger created a Player Efficiency Rating (PER) that incorporates several statistics in the hope it provides a single rating that determines the best player. While it is a truly worthy effort, we feel there is quite a bit of judgement incorporated in what value to place on different statistics.  For example, it rewards players who take more shots even when the extra shots are 2-pointers at a low field goal percentage (taking extra 2-point shots at over a 31% increases the rating even though that is well below what the rest of his team would likely shoot). We would place more value on giving the ball up (and having a lower scoring average) than taking a low percentage shot.

I am surprised that the simplest calculation of scoring efficiency does not surface as a regularly reported statistic. Some sources occasionally report an “Adjusted Field Goal Percentage” (AFG%) that counts a 3-point field goal as worth 1.5 times a 2-point field goal. We believe this is the correct way of viewing a shooter’s effectiveness and called it field goal efficiency (FGE%). It calculates the percentage as the equivalent of 2-point field goals made per field goal attempt (FGA):

FGE% = (2-point shots made + 1.5 x 3-point shots made)/FGA

There is one statistic that analysts call True Shooting Percentage (TS%) that goes one step further. It also takes foul shots into account. It assumes that 1 of every 9 foul shots is part of a 3-point (or 4-point) play and therefore considers 2.25 foul shots as the same as one field goal attempt (since most pairs of foul shots replace a field goal attempt). TS% is calculated by adding the field goal attempt equivalent of foul shots to normal field goal attempts to determine the equivalent number of attempts used by a player. By dividing points scored by 2 we know how points scored equates to 2-point field goals made (FGME). This translated to the following formula for TS%:

Equivalent field goal attempts (EFGA) = FGA + FTA/2.25

FGME = points scored/2

TS% =FGME/EFGA

Now let’s compare Curry, Harden and Westbrook based on these statistics all on a per game basis:

Slide1

Harden and Westbrook are neck-and-neck in scoring average, each about four points per game higher than Curry. But Curry plays fewer minutes per game and takes fewer shots. His shooting efficiency at 58.6% is by far the highest of the three by a significant amount (a full 14% higher than Westbrook and 7% higher than Harden). It is also the highest in the league for players that have taken at least 8 shots per game (which includes all of the top 100 players by scoring average). At over 90%, Curry is the number one foul shooter in the league. But Harden and Westbrook are also hitting roughly 85% of their foul shots. Therefore, the fact that they get fouled much more than Curry brings each of their TS%s closer to Curry’s. Still, Curry is a whopping 10% higher than Westbrook and 2.5% higher than Harden. It is apparent that the scoring average advantage is more a function of Curry playing fewer minutes and being more selective in his shots.

To see the impact of this we calculated their scoring average per 36 minutes played (which we consider about average for a team’s star) and points scored per 25 equivalent field goals attempts:

Slide2

So, even if he played the same amount of time as Harden and Westbrook, Curry would trail in average points per game, primarily because he still would take fewer shots. But if he took the same number of equivalent shots he’d have a higher scoring average than both.

A Few Other Statistical Comparisons

While scoring efficiency is an important measure of a players value to his team, several other statistics like assists, rebounds, and steals are also considered quite relevant. To make comparisons fair, we adjusted to the average per 36 minutes for each:

Slide3

For steals, Westbrook and Curry are close to dead even with Harden about 11% behind. However, Westbrook is the clear leader in rebounds and has 7% more assists than Curry with both well ahead of Harden.

Each of these three players leads their team’s offense. They all control the ball attempting to score themselves or assist others in scoring without turning the ball over, as every turnover is a lost scoring opportunity. The ratio of assists to turnovers helps capture effectiveness as a guard. On the defensive end they each can compensate for a portion of their turnovers by stealing the ball. The ratio of steals to turnovers captures how well they are able defensively to partly compensate for depriving their team of a scoring opportunity. But attempts to steal the ball can lead to more personal fouls. The ratio of steals to personal fouls helps understand defensive effectiveness. Here are the comparisons:

Slide4

Harden and Westbrook are 25%-40% behind Curry in all of these categories. What the first ratio tells us is that Curry passes the ball more accurately and/or takes less risk so that he gets his assists without turning the ball over as frequently as the others. Another way of looking at it is that the extra 0.6 assists that Westbrook averages per 36 minutes comes at the expense of one extra turnover vs Curry.  The steal/turnover ratio tells us that for every 3 turnovers Curry has, he is able to get the ball back twice through steals. The others recover less than half of their turnovers through steals. Finally the steals/personal foul ratio shows that Curry is quite effective defensively with a ratio that is over 30% better than either of the others.


Curry Creates the Most Team Success

So, what is the bottom line that helps capture the impact of the various statistics we have shown? Of course one measure is the fact that Curry has helped his team achieve a much better record. What other measure should be considered in evaluating a potential MVP’s impact on a team? Given Curry’s extremely high Field Goal Effectiveness, does his taking fewer shots help the team more than Harden and Westbrook taking more shots and scoring more? The league average for scoring per game is roughly 99.9 points (through about 76 games of the season). Each of the three help their team score at a higher rate than that, but Curry has led the Warriors to the highest scoring per game in the league. The comparison:

charts

A natural question is whether this superior offensive performance comes at the expense of inferior defense.  So we should include the average points given up per game by each team to round out the picture. Notice the Warriors allow fewer points per game than the league average while both the Thunder and the Rockets allow more than the league average. The combination for the Warriors means that they have the highest plus/minus in the league by quite a bit (the Warrior’s 10.4 is 60% higher than the Clippers who are second at 6.5), and it is nearly double the sum of the plus/minus for the Rockets and Thunder combined.

Slide6

The league also maintains plus/minus differential by player. That is how many more points a team scores than opponents when that player is on the floor.  In all three cases, it seems clear the players are driving the team’s effectiveness as their differential exceeds that of the teams (meaning that without them on the floor, the other team, on average, outscores their team). This statistic takes offense and defense into account and helps measure the influence a player has on his team’s effectiveness.

Slide7

This means that Curry is responsible for a 12.0-point improvement in plus/minus when on the floor versus how the team does when he isn’t, while both Westbrook and Harden improve their team’s plus/minus by 5.0 points. Given his top score in plus/minus, much higher Field Goal Effectiveness and TS%, combined with driving the Warriors to the top record in the league, it seems that Curry should be the league MVP and is on his way to becoming a Unicorn. As a VC, I would love to invest in him!

SoundBytes:

  • The recent ESPN selection of the top 20 players of the past 20 years is quite enlightening in how well the NBA markets their elite players compared to other sports. Despite the fact that football and baseball have a multiple of the number of players and are more popular sports, five of the 20 were from the NBA:
    • Number 1: Michael Jordon
    • Number 2: LeBron James
    • Number 8: Kobe Bryant
    • Number 11: Shaquille O’Neal
    • Number 14: Tim Duncan
  • There were 3 from football (all quarterbacks) and 2 each from baseball, tennis and soccer. And one each from 6 other sports (hockey, boxing, golf, swimming, track and cycling).
  • The four emerging stars (this includes Anthony Davis) we have discussed all have the potential to be on a future such list but their status among the greatest will also be dependent on their ability to win multiple championships. Winning MVPs makes a player great, winning multiple championships makes them one of the greatest.
  • Last night’s game against the Blazers was further validation’s of Curry’s MVP bid. Curry delivered eight 3-pointers, hit 17 of 23 shots and went 7-of-7 in his 19-point fourth quarter. His last two threes were a combined distance of 55 feet, setting a new record for threes in season and breaking his own record!