My approach on public market investing

I have always taken a research driven, multi-pronged approach to identifying attractive publicly traded equity investments, and after reflecting on this approach with a new fund that I am starting, I figured that it would make for an interesting blog post to share this with a broader audience. The companies that I have covered through previous blog posts have been identified through this process. As you likely know if you made some investments based off of my suggestions in the past, they have performed very well!

My Screening Process

I begin with a screening process as follows:

  1. Discover trends that are disruptive to entrenched market participants, expected to continue for over five years, and relate to very large markets
  2. Identify companies that are strong beneficiaries of these trends; and
  3. Evaluate these companies’ competitive advantages that stem from one or more of:
    • superior technology often protected by patents,
    • strong emerging brand,
    • network effect of having built a massive connected audience,
    • high quality leadership,
    • products that are very difficult to replicate, and/or
    • advantageous business model

Companies are identified that pass the above screening. Then I apply a filter to reduce these matches to ones that also are already generating or have an ability to generate strong profits. I believe that the most important metric to evaluate companies that have yet to develop mature business models is contribution margin, i.e.: gross margin minus customer acquisition cost. We have covered contribution margin in past blog posts. Check our post in January 2020 which contains our discussion of sophisticated valuation methodology for more background on how I see this as a key metric for evaluating business models.

Companies passing the above screen are rare and, thus, are both difficult and time-consuming to identify. Each company selected from those that passed the screening will also need to have well above average revenue growth for their respective stages.

My experience indicates that great returns will be realized over a long period of time from companies that have the key attributes described above and, therefore, I expect, generally, to hold the core of each of my positions for an average period of five years or more. This doesn’t mean never selling any shares, but rather holding the majority of shares for that period. I augment my equity investments in portfolio companies by writing both call and put options or other derivatives (we covered an example of this recently with Zoom in my 2020 predictions). Doing this hedges risk of short-term market fluctuation and generates income from option premiums going to zero over the life of the option. Given my concentration on relatively few securities of high growth companies, it is expected that volatility in my portfolio could often exceed that of the overall market. Therefore, I believe it’s important to avoid margin borrowing as this would increase risk and volatility beyond what I think is an acceptable level.

Applying the Strategy to Investing

The first step in my strategy is to identify longer term trends that are disruptive to entrenched leaders of large markets. I believe the following qualify:

  1. Growth of eCommerce: Online purchasing will gain share for another 10 years or more
  2. Shift of services from physical, in-person to virtual: This reduces cost and adds convenience and should persist for many years
  3. Use of video conferencing in place of older audio conferencing: Will continue to further penetrate businesses and also emerge as a “must have” for individual households
  4. Online advertising: It will continue to gain share from other forms as it allows for more precise measurement of effectiveness and promotes immediate ability to purchase
  5. Shift from old generation autos to eco-friendlier (i.e. electric) with software capabilities tightly integrated: It is in its early stages and will gain increasing traction for several decades to come
  6. The entire online security industry will not only grow at an accelerated pace but also face an upheaval as more modern technology will be used to detect increased attacks from those deploying viruses, spam, intrusions and identity theft
  7. Web Services will continue to experience double digit growth: Since its directly tied to Internet traffic driven by increased eCommerce, escalation of video, social and virtual services

Several companies that I have selected (and outlined in the past) benefit from more than one of the 7 identified trends and all are one of the dominant players in their particular arena. It should be noted that the arena may be more specific than the trend.

For example, Online advertising has distinct leaders in overall social (Facebook), search advertising (Google), Visual advertising (Pinterest), eCommerce ads (Amazon) and programmatic (The Trade Desk). So, while these 5 companies compete for advertising budget, they each are the dominant brands in their sub-sector with massive networks of users that are difficult to replicate.

Picking the winners

In the first section of this blog, I highlighted six different types of competitive advantages I look for. The companies that I have recently invested in have three or more of these advantages, and on average qualifies for roughly 4.5. On the leadership side not only do all have very strong leadership but virtually all are led by their founder who is an early innovator in their sector.

One other major consideration recently has been the impact of the pandemic. There are three companies that I have previously covered in the blog that I feel benefit strongly: Amazon, DocuSign, and Zoom. Both Peloton and Shopify would be major additional beneficiaries. When the pandemic ends there is widespread views on how such companies will be impacted. On the one hand, many analysts believe some or all of these will experience a reduction in revenue against strong comps. Others, including myself, think that behavior has changed, so while massive growth experienced during the pandemic won’t be replicated, most, if not all of them will continue to grow at a more “normal” rate. The four advertising companies I mentioned previously: Facebook, Google, Pinterest and The Trade Desk have all been impacted by the loss of advertising from major business segments like travel, live events (and associated ticket sellers) and brick and mortar retail. Since Amazon advertising revenue is limited to online sellers it is not affected by loss of ads from these sectors. My expectation is that when the Shelter-in-Place requirements are substantially eased, all four of these companies will experience a jump in advertising revenue. As we reach April of 2021 this jump will be compared to depressed comps and all four should experience above normal growth.

Of companies that are in my 2020 stock pics, surprisingly, Tesla has appreciated well over 600% despite its revenue being lower than pre-pandemic expectations. I believe this is mostly because of the certain shift taking place towards software enabled electronic cars but the stock has also been helped by inclusion in the S&P index. The other company negatively impacted by the pandemic is Stitch Fix. On the one hand, it has undoubtedly gained share as it offers a modern online method of shopping to its very large base of customers, but it is also obvious that people are just not buying that many items of clothes during the pandemic. I expected Stitch Fix to be a substantial beneficiary when Shelter-in-Place is eased, but the market is already anticipating this as we’ve seen it’s begin year value of $25.66, which fell dramatically earlier in the pandemic, rebound nicely to a price of $69 in December 2020…a 170% appreciation year-to-date.

I have also been examining several companies that had recently IPO’d as younger public companies tend to have higher growth rates which in turn creates greater potential future appreciation. So, I considered the various companies that had come public in 2019 to see which ones met my screens. Investing in Lyft and Uber, post IPO, had little interest for me. On the positive side, Lyft revenue growth was 95% in Q1, 2019, but it had a negative contribution margin in 2018 and Q1 2019. Uber’s growth was a much lower 20% in Q1, but it appeared to have slightly better contribution margin than Lyft, possibly even as high as 5%. I expected Uber and Lyft to improve their contribution margin, but it is difficult to see either of them delivering a reasonable level of profitability in the near term as scaling revenue does not help profitability until contribution margin improves. So, I passed on both which proved the right decision as Lyft is still well below the first day’s closing price of $78.29 post-IPO. Uber is now up 27% vs its first day closing price (roughly the same as the S&P index) as food delivery has proven a great business for them during the pandemic. The first of the 2019 IPO class that I bought was Zoom Video, which had a contribution margin of roughly 25% coupled with over 100% revenue growth. It also seemed on the verge of moving to profitability. Four others piqued my interest: Pinterest, Peloton, Slack and CrowdStrike. All of these were growing revenue at a 40% or higher rate, had solid business models and met my other criteria. I’ll discuss these in more detail in my following posts but, on average, they are up well over 300% this year …stay tuned for my 2021 predictions!

Discussion of Sophisticated Valuation Methodology

In the long run, companies should be valued based on future earnings flows. Since this is often nearly impossible to calculate, proxies are often used instead. I find it difficult to competently determine what proxies should be used for cyclical companies, so will ignore them as they are not in my universe in venture or public investing. The focus of this post will be on exploring valuation for high-growth companies.

Companies that are already at or near their long-term model for profitability are often valued based on a multiple of earnings. If they are still in their high growth phase, they are likely to have increasing earnings over time and should therefore command a higher multiple than those that are growing slowly or not at all. Much analysis has been done to compare various such entities based on how their multiple of earnings varies depending on their level of growth. There will be a strong correlation between their multiple of earnings and level of growth, but other factors such as the “dependability of growth and earnings” can lead to wide variations in valuations.  For example, a company that has a SaaS business model with greater than 100% revenue retention would usually be viewed as one where growth is “safer” … thus commanding a higher multiple than those with different models.

What about companies that are not near their long-term profit model?   

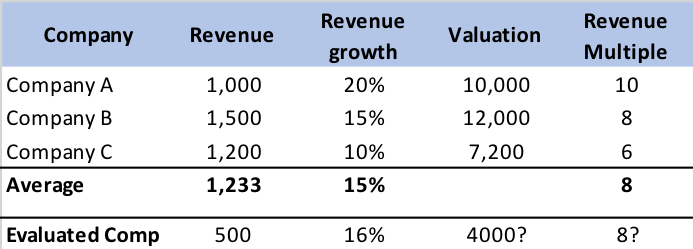
Many of the companies that have recently gone public are a long way from reaching their long-term business model, and so other methods of valuing them must be used. Often, Investment Bankers suggest a multiple of revenue as one method. By considering how “comparable” companies trade based on revenue and growth a suggested valuation can be derived:

Table 1 Valuation of Comparable Companies

Table 1 shows a sample of what an investment banker might use as one method of determining potential valuation. However, there are many weaknesses to this approach. The biggest of which is: “what makes a company a comparable?” Usually companies selected are in the same sector. But, within a sector, business models can vary widely. For example, a sector like eCommerce has companies that:

  1. Sell physical goods which are not their own brands
  2. Sell physical goods that are their own brands
  3. Are a marketplace in which sellers list their goods and the company facilitates sales, collects the money and pays the seller (e.g., eBay).  Such a company’s revenue is not the sales of the goods but instead the marketplace commission.
  4. Sell virtual goods that are their own

There can be wide variation in gross margin among the four categories, but in general, gross margins are higher as we go from 1 to 2 to 3 to 4. In fact, companies in category 1 often have gross margins in the 20% to 40% range, those in category 2 in the 40% to 70% range, those in category 3 in the 70% to 90% range and those in category 4 in the 85% to 95% range. What this means is that all other things being equal the potential earnings at scale for these will depend more on its business model than on the sector.  

To test our theory of whether using a multiple of Gross Margin was a better measure of value than a multiple of revenue, we plotted the relationship between growth and valuation using each of these methods.  It turns out there is a correlation between valuation as a multiple of revenue based on revenue growth regardless of industry. We found the correlation coefficient for it to be 0.36, an indication of a moderate relationship. This was still far better than the correlation between slow growth and high growth plays that just happen to be in the same industry. So, I believe (based on evidence) that growth is a better indicator of multiple than industry sector.

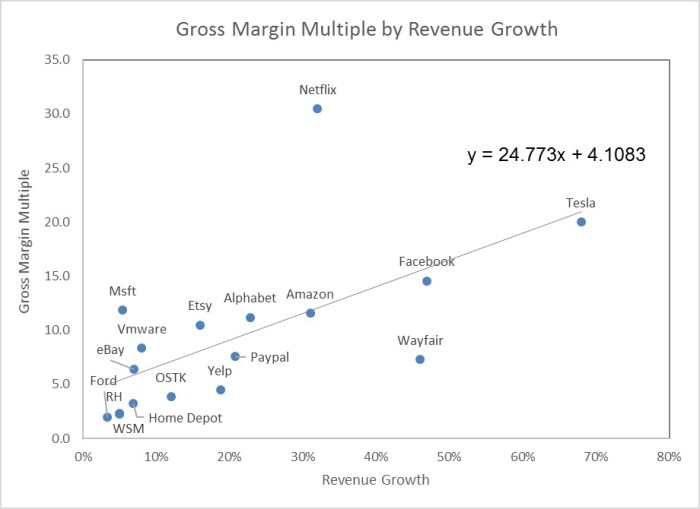
In that same post we plotted the relationship between revenue growth and valuation as a multiple of gross margin dollars (GMD). For the remainder of this post I’ll use multiple to mean the multiple of GMD. Since it seemed obvious that GM% is a better indicator of future earnings than revenue, I wasn’t surprised that the correlation coefficient was a much higher 0.62, an indication of a much stronger relationship. While other factors like dependability of revenue, market size, perceived competitive advantage and more will affect the multiple, I decided that this method of assessing valuation was strong enough that I use the resulting least square regression formula as a way of getting a starting approximation for the value of a company that has yet to reach “business model maturity”.

Why Contribution Margin is a better indicator than Gross Margin of future earnings.

The reason the correlation coefficient between GMD multiples and revenue growth is 0.62 rather than a number much closer to 1.0 is that a number of other factors play a role in determining future earnings. For me, the most important one is Contribution Margin, which considers the marketing/sales cost spent each month to help drive revenue (think of it as GMD minus marketing/sales cost). Contribution Margin indicates how quickly the benefits of scaling the business will enable reaching mature earnings. When I look at a company that has low contribution margins it is difficult to see how it can generate substantial profits unless it can improve gross margin and/or reduce marketing spend as a percentage of sales. That is why the bull story on Spotify is that it will get the music labels to substantially reduce their royalty level (from close to 80%), or for Uber is that it will go to self-driving vehicles or why Blue Apron keeps reducing its marketing spend in an effort to increase contribution margin. The argument then becomes a speculation on why the multiple should be of a “theoretically” higher amount.  I would like to plot revenue growth versus the multiple of Contribution Margin to obtain a new least square formula, which I am confident would have a higher correlation coefficient.  Unfortunately, many companies do not readily identify variable marketing/sales cost so instead I analyze where it is likely to be, and factor that into how I view valuation.

Other Factors to Consider for Understanding a Company’s Valuation

  1. Recurring revenue models should have a higher multiple: Business to Business SaaS (Software as a Service) companies usually trade at higher multiples than those with other models that are growing at the same rate. The reason is simple: their customers are likely to stay on their platforms for a decade or more and often increase what they spend over time. This creates a situation where a portion of revenue growth can be sustained even before adding the marketing spend to acquire future customers which in turn should lead to higher Contribution Margins.
  2. Companies that are in markets that are likely to grow at a high rate for 5 years or more should have higher multiples: If the market a company plays in is growing quickly there is more opportunity to sustain high growth levels for a longer time, leading to a likelihood of greater future earnings.
  3. Companies with substantial competitive advantage should have higher multiples: Any company that has a product that it is difficult to replicate can elevate its margins and earnings for a long period of time. One of the best examples of this is pharmaceutical companies, where their drug patents last for 20 years. Even after the patent expires the original holder will continue to sell the drug at a much higher price than its generic alternatives and still maintain strong market share.
  4. Companies that are farther away from generating actual earnings should trade at lower multiples than those that are close or already generating some earnings: The reason for this is obvious to me but it is often not the case … especially for newly minted IPOs. I believe there is considerable risk that such companies will take many years to reach profitability (if they do at all) and that when they do it will only be a modest portion of revenue. I started this post by saying that eventually valuations should reflect the present value of future earnings flows. The longer it takes to get to mature earnings, the lower its present value (see table 2). If tangible earnings started 7 years out (vs immediately) the discounted value of the flow would be reduced by more than half – reflecting that the valuation of the company should be half that of a company with a similar earnings flow that started immediately.

Table 2: Present value of future dollars using a 12% discount rate

How I bet on my Valuation Methodology.

Consider the three recommendations in my last post that have had their IPO between November of 2017 and mid-2019: DocuSign, Stitch fix and Zoom. They all are profitable already. Two are B to B SaaS companies with greater than 100% revenue retention (that means that the cohort of customers they had a year ago, including those that churned, are spending more today than when they started). The third has existing customers increasing their year over spend as well. They are all growing at a strong pace.

SoundBytes

  • While I did not include it in my recommended stocks for 2020, I recently purchased shares in Pinterest (at $19.50 per share), one of the three 2019 Unicorn IPOs (of the nine I highlighted in my last post) that was already profitable. Based on my valuation methods it is at a reasonable valuation, grew 47% year over year in its last reported quarter, and appears well positioned to grow at a high level for many years. What I find surprising is the comparison to the valuation of Snap. Snap is growing at roughly the same pace (50% in the last reported quarter), had an adjusted EBITDA loss of nearly 10% in Q3 and yet was trading at nearly double the multiple of GMD. 
  • I can’t help mentioning that we predicted that Tesla was likely to have a great Q4 in our post in November, based on the long wait time for my getting a model 3 I had ordered, coupled with manufacturing cranking out more expensive model S and X versions for most of the quarter, and that the Chinese factory was starting to produce cars. At the time the stock was $333 per share. Now, after it has risen over 200 points a number of analysts are saying the same thing.

Comparing Recent IPO Companies – Should Performance Drive Valuation?

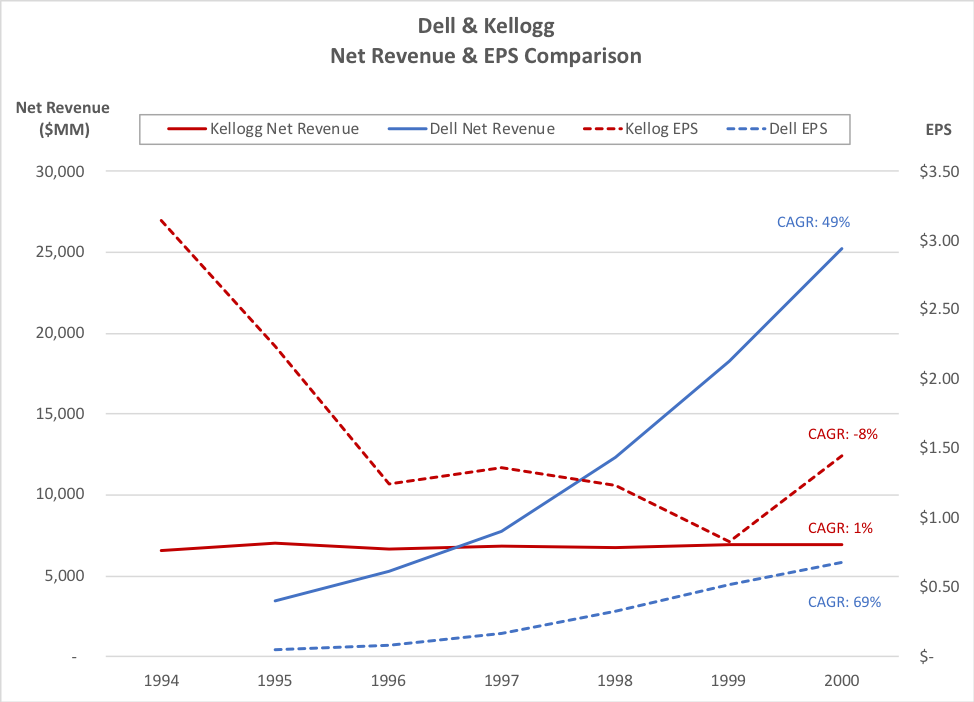
In a past life, while on Wall Street, one of my favorite calls was: “Buy Dell Short Kellogg”. My reasoning behind the call was that while Dell’s revenue and earnings growth was more than 10X that of Kellogg, somehow Kellogg had a much higher PE than Dell. Portfolio managers gave me various reasons they claimed were logical to explain the un-logical situation like: “Kellogg is more reliable at meeting earnings expectations” …. when in truth they had missed estimates 20 straight quarters. What I later came to believe was that the explanation was their overall comfort level with Kellogg because they understood cereal better than they understood a direct marketing PC hardware company at the time. My call worked out well as Dell not only had a revenue CAGR of nearly 50% from January 1995 (FY 95) through January of 2000 (and a 69% EPS CAGR) but also experienced significant multiple expansion while Kellogg revenue grew at just over 1% annually during the ensuing period and its earnings shrunk (as spend was against missed revenue expectations). The success of Dell was a major reason I was subsequently selected as the number one stock picker across Wall Street analysts for 2 years in a row.

I bring up history because history repeats. One of the reasons for my success in investing is that I look at metrics as a basis of long-term valuation. This means ignoring story lines of why the future is much brighter for those with weak metrics or rationales of why disaster will befall a company that has strong results. Of course, I also consider the strength of management, competitive advantages and market size. But one key thesis that comes after studying hundreds of “growth” companies over time is that momentum tends to persist, and strong business models will show solid contribution margin as an indicator of future profitability.

Given this preamble I’ll be comparing two companies that have recently IPO’d. Much like those that supported Kellogg, the supporters of the one with the weaker metrics will have many reasons why it trades at a much higher multiple (of revenue and gross margin dollars) than the one with stronger metrics.  

Based on financial theory, companies should be valued based on future cash flows. When a company is at a relatively mature stage, earnings and earnings growth will tend to be the proxy used and a company with higher growth usually trades at a higher multiple of earnings.   Since many companies that IPO have little or no earnings, many investors use a multiple of revenue to value them but I prefer to use gross margin or contribution margin (where marketing cost is broken out clearly) as a proxy for potential earnings as they are much better indicators of what portion of revenue can potentially translate to future earnings (see our previous post for valuation methodology).

I would like to hold off on naming the companies so readers can look at the metrics with an unbiased view (which is what I try to do). So, let’s refer to them as Company A and Company B. Table 1 shows their recent metrics.

Notes:

  • Growth for Company B included an extra week in the quarter. I estimate growth would have been about 27% year/year without the extra week
  • Disclosures on marketing seem inexact so these are estimates I believe to be materially correct
  • Pre-tax income for Company A is from prior quarter as the June quarter had considerable one-time expenses that would make it appear much worse

Company B is:

  1. Growing 2 -2 ½ times faster
  2. Has over 3X the gross margin percentage
  3. Over 28% contribution margin whereas Company A contribution margin is roughly at 0
  4. Company B is bordering on profitability already whereas Company A appears years away

Yet, Company A is trading at roughly 3.5X the multiple of revenue and almost 11X the multiple of gross margin dollars (I could not use multiple of contribution margin as Company A was too close to zero). In fairness to Company A, its gross margin was much higher in the prior quarter (at 27%). But even giving it the benefit of this higher number, Company B gross margins were still about 65% higher than Company A.

The apparent illogic in this comparison is much like what we saw when comparing Kellogg to Dell many years ago. The reasons for it are similar: investors, in general, feel more comfortable with Company A than they do with Company B. Additionally, Company A has a “story” on why things will change radically in the future. You may have guessed already that Company A is Uber. Company B is Stitchfix, and despite its moving to an industry leading position for buying clothing at home (using data science to customize each offering) there continues to be fear that Amazon will overwhelm it sometime in the future. While Uber stock has declined about 35% since it peaked in late June it still appears out of sync compared to Stitchfix.

I am a believer that, in general, performance should drive valuation, and have profited greatly by investing in companies that are growing at a healthy rate, appear to have a likelihood of continuing to do so in the near future and have metrics that indicate they are undervalued.

Soundbytes

  • It appears that many others are now beginning to focus more closely on gross margins which we have been doing for years. I would encourage a shift to contribution margin, where possible, as this considers the variable cost needed to acquire customers.
  • A few notes about Tesla following our 2019 predictions: My household is about to become a two Tesla family. My wife has owned her second Tesla, a Model S, for over 4 years and I just placed an order to buy a Model 3 as a replacement for my Mercedes 550S. Besides the obvious benefits to the environment, I’m also tired of having to go to gas stations every week. The Model 3 can go 310 miles on a charge, is extremely fast, has a great user interface and has autopilot. I looked at several other cars but found it hard to justify paying twice as much (or more) for a car with less pickup, inferior electronics, etc.
  • If you were wondering why Tesla stock has gone on a run it is because the Chinese Ministry of Industry and Information Technology (MIIT) has added Tesla to its list of approved auto manufacturers (the news of the possibility broke over a week ago). It appears likely that Tesla will begin producing Model 3s out of the new Giga Factory in China some time in Q4. This not only adds capacity for Tesla to increase its unit sales substantially in 2020 but also will save the Company considerable money as it won’t need to ship cars from its US factory. Remember Tesla also is planning on a Giga Factory in Europe to service strong demand there. The company has said that it will choose the location by the end of 2019. Given the intense competition to be the selected location, it is likely that the site chosen will involve substantial incentives to Tesla. While I would not want to predict when it will be in production, Elon Musk expects the date to be sometime in 2021. Various announcements along the way could be positive for Tesla stock.

My Crazy Investment Technique for Solid Growth Stocks

You should not try it!

Applying Private Investment Analysis to the Rash of Mega-IPOs Occurring

The first half of 2019 saw a steady stream of technology IPOs. First Lyft, then Uber, then Zoom, all with different business models and revenue structures. As an early investor in technology companies, I spend a lot of time evaluating models for Venture Capital, but as a (recovering) investment analyst, I also like to take a view around how to structure a probability weighted investment once these companies have hit the public markets. The following post outlines a recent approach that I took to manage the volatility and return in these growth stocks.

Question: Which of the Recent technology IPOs Stands out as a Winning Business Model?

Investing in Lyft and Uber, post IPO, had little interest for me. On the positive side, Lyft revenue growth was 95% in Q1, 2019, but it had a negative contribution margin in 2018 and Q1 2019.  Uber’s growth was a much lower 20% in Q1, but it appears to have slightly better contribution margin than Lyft, possibly even as high as 5%. I expect Uber and Lyft to improve their contribution margin, but it is difficult to see either of them delivering a reasonable level of profitability in the near term as scaling revenue does not help profitability until contribution margin improves. Zoom Video, on the other hand, had contribution margin of roughly 25% coupled with over 100% revenue growth. It also seems on the verge of moving to profitability, especially if the company is willing to lower its growth target a bit.

Zoom has a Strong Combination of Winning Attributes

There is certainly risk in Zoom but based on the momentum we’re seeing in its usage (including an increasing number of startups who use Zoom for video pitches to Azure), the company looks to be in the midst of a multi-year escalation of revenue. Users have said that it is the easiest product to work with and I believe the quality of its video is best in class. The reasons for Zoom’s high growth include:

  1. Revenue retention of a cohort is currently 140% – meaning that the same set of customers (including those who churn) spend 40% more a year later. While this growth is probably not sustainable over the long term, its subscription model, based on plans that increase with usage, could keep the retention at over 100% for several years.
  2. It is very efficient in acquiring customers – with a payback period of 7 months, which is highly unusual for a SaaS software company. This is partly because of the viral nature of the product – the host of the Zoom call invites various people to participate (who may not be previous Zoom users). When you participate, you download Zoom software and are now in their network at no cost to Zoom. They then offer you a free service while attempting to upgrade you to paid.
  3. Gross Margins (GMs) are Software GMs – about 82% and increasing, making the long-term model likely to be quite profitable
  4. Currently the product has the reputation of being best in class (see here) for a comparison to Webex.
  5. Zoom’s compression technology is well ahead of any competitor according to my friend Mark Leslie (a superb technologist and former CEO of Veritas).

The Fly in the Ointment: My Valuation Technique shows it to be Over Valued

My valuation technique, published in one of our blog posts, provides a method of valuing companies based on revenue growth and gross margin. It helps parse which sub-scale companies are likely to be good investments before they reach the revenue levels needed to achieve long term profitability. For Zoom Video, the method shows that it is currently ahead of itself on valuation, but if it grows close to 100% (in the January quarter it was up 108%) this year it will catch up to the valuation suggested by my method. What this means is that the revenue multiple of the company is likely to compress over time.

Forward Pricing: Constructing a Way of Winning Big on Appreciation of Even 10%

So instead of just buying the stock, I constructed a complex transaction on May 29. Using it, I only required the stock to appreciate 10% in 20 months for me to earn 140% on my investment. I essentially “pre-bought” the stock for January 2021 (or will have the stock called at a large profit). Here is what I did:

  1. Bought shares of stock at $76.92
  2. Sold the same number of shares of call options at $85 strike price for $19.84/share
  3. Sold the same number of shares of put options at $70 strike for $22.08/share
  4. Both sets of options expire in Jan 2021 (20 months)
  5. Net out of pocket was $35/share

Given the momentum I think there is a high probability (75% or so) that the revenue run rate in January 2021 (when options mature) will be over 2.5x where it was in Q1 2019. If that is the case, it seems unlikely that the stock would be at a lower price per share than the day I made the purchase despite a potential for substantial contraction of Price/Revenue.

In January 2021, when the options expire, I will either own the same shares, or double the number of shares or I will have had my shares “called” at $85/share.

The possibilities are: 

  • If the stock is $85 or more at the call date, the stock would be called, and my profit would be roughly 140% of the net $35 invested
  • If the stock is between $70 and $85, I would net $42 from the options expiring worthless plus or minus the change in value from my purchase price of $76.92. The gain would exceed 100%
  • If the stock is below $70, I’ll own 2x shares at an average price of $52.50/share – which should be a reasonably good price to be at 20 months out.
  •  Of course, the options can be repurchased, and new options sold during the time period resulting in different outcomes.

Break-Even Point for the Transaction Is a 32% Decline in Zoom Video Stock Price

Portfolio Managers that are “Value Oriented” will undoubtedly have a problem with this, but I view this transaction as the equivalent of a value stock purchase (of a high flyer) since the break-even of $52/share should be a great buy in January 2021. Part of my reasoning is the downside protection offered: where my being forced to honor the put option would mean that in January 2021, I would own twice the number of shares at an average price of $52.50/share. If I’m right about the likelihood of 150% revenue growth during the period, it would mean price/revenue had declined about 73% or more. Is there some flaw in my logic or are the premiums on the options so high that the risk reward appears to favor this transaction?

I started writing this before Zoom reported their April quarter earnings, which again showed over 100% revenue growth year/year. As a result, the stock jumped and was about $100/share. I decided to do a similar transaction where my upside is 130% of net dollars invested…but that’s a story for another day.

Estimating the “Probabilistic” Return Using My Performance Estimates

Because I was uncomfortable with the valuation, I created the transaction described above. I believe going almost 2 years out provides protection against volatility and lowers risk. This can apply to other companies that are expected to grow at a high rate. As to my guess at probabilities:

  1. 75% that revenue run rate is 2.5x January 2019 (base) quarter in the quarter ending in January 2021. A 60% compound annual growth (CAG) for 2 years puts the revenue higher (they grew over 100% in the January 2019 quarter to revenue of $105.8M)
  2. 95% that revenue run rate is over 2.0X the base 2 years later (options expire in January of that year). This requires revenue CAG of 42%. Given that the existing customer revenue retention rate averaged 140% last year, this appears highly likely.
  3. 99% that revenue is over 1.5X the base in the January 2021 quarter (requires slightly over 22% CAG)
  4. 1% that revenue is less than 1.5X

Assuming the above is true, I believe that when I did the initial transaction the probabilities for the stock were (they are better today due to a strong April quarter):

  1. 50% that the stock trades over 1.5X today by January 2021 (it is almost there today, but could hit a speed bump)
  2. 80% that the stock is over $85/share (up 10% from when I did the trade) in January 2021
  3. 10% that the stock is between $70 and $85/share in January 2021
  4. 5% that the stock is between $52 and $70 in January 2021
  5. 5% that the stock is below $52

Obviously, probabilities are guesses since they heavily depend on market sentiment, whereas my revenue estimates are more solid as they are based upon analysis, I’m more comfortable with. Putting the guesses on probability together this meant:

  1. 80% probability of 140% profit = 2.4X
  2. 10% probability of 100% profit = 2.0X
  3. 5% probability of 50% profit (this assumes the stock is in the middle at $61/share) = 1.5X
  4. 5% probability of a loss assuming I don’t roll the options and don’t buy them back early. At $35/share, loss would be 100% = (1.0X)

If I’m right on these estimates, then the weighted probability is 120% profit. I’ve been doing something similar with Amazon for almost 2 years and have had great results to date. I also did part of my DocuSign buy this way in early January. Since then, the stock is up 27% and my trade is ahead over 50%. Clearly if DocuSign (or Amazon or Zoom) stock runs I won’t make the same money as a straight stock purchase would yield given that I’m capped out on those DocuSign shares at slightly under 100% profit, but the trade also provides substantial downside protection.

Conclusion: Investing in Newly Minted IPOs of High Growth Companies with Solid Contribution Margins Can be Done in a “Value Oriented” Way  

When deciding whether to invest in a company that IPOs, first consider the business model:

  • Are they growing at a high rate of at least 30%?
  • Experiencing increasing contribution margins already at 20% or more?
  • Is there visibility to profitability without a landscape change?

Next, try to get the stock on the IPO if possible. If you can’t, is there a way of pseudo buying it at a lower price? The transaction I constructed may be to complex for you to try and carries the additional risk that you might wind up owning twice the number of shares. If you decide to do it make sure you are comfortable with the potential future cash outlay.

Company Valuations Implied by my Valuations Bible: Are Snap, Netflix, Square and Twitter Grossly Overvalued?

Applying the Gross Margin Multiple Method to Public Company Valuation

In my last two posts I’ve laid out a method to value companies not yet at their mature business models. The method provides a way to value unprofitable growth companies and those that are profitable but not yet at what could be their mature business model. This often occurs when a company is heavily investing in growth at the expense of near-term profits. In the last post, I showed how I would estimate what I believed the long-term model would be for Tesla, calling the result “Potential Earnings” or “PE”. Since this method requires multiple assumptions, some of which might not find agreement among investors, I provided a second, simplified method that only involved gross margin and revenue growth.

The first step was taking about 20 public companies and calculating how they were valued as a multiple of gross margin (GM) dollars. The second step was to determine a “least square line” and formula based on revenue growth and the gross margin multiple for these companies. The coefficient of 0.62 shows that there is a good correlation between Gross Margin and Revenue Growth, and one significantly better than the one between Revenue Growth and a company’s Revenue Multiple (that had a coefficient of 0.36 which is considered very modest).

Where’s the Beef?

The least square formula derived in my post for relating revenue growth to an implied multiple of Gross Margin dollars is:

GM Multiple = (24.773 x Revenue growth percent) + 4.1083

Implied Company Market Value = GM Multiple x GM Dollars

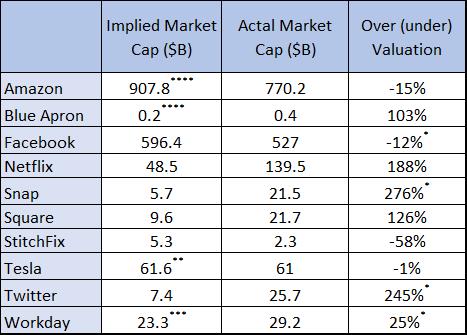
Now comes the controversial part. I am going to apply this formula to 10 companies using their data (with small adjustments) and compare the Implied Market Value (Implied MKT Cap) to their existing market Cap as of several days ago. I’ll than calculate the Implied Over (under) Valuation based on the comparison. If the two values are within 20% I view it as normal statistical variation.

Table 1: Valuation Analysis of 10 Tech Companies

  • * Includes net cash included in expected market cap
  • ** Uses adjusted GM%
  • *** Uses 1/31/18 year end
  • **** Growth rate used in the model is q4 2017 vs q4 2016.  See text

This method suggests that 5 companies are over-valued by 100% or more and a fifth, Workday, by 25%. Since Workday is close to a normal variation, I won’t discuss it further. I have added net cash for Facebook, Snap, Workday and Twitter to the implied market cap as it was material in each case but did not do so for the six others as the impact was not as material.

I decided to include the four companies I recommended, in this year’s top ten list, Amazon, Facebook, Tesla and Stitchfix, in the analysis. To my relief, they all show as under-valued with Stitchfix, (the only one below the Jan 2 price) having an implied valuation more than 100% above where it currently trades. The other three are up year to date, and while trading below what is suggested by this method, are within a normal range. For additional discussion of these four see our 2018 top Ten List.


Digging into the “Overvalued” Five

Why is there such a large discrepancy between actual market cap and that implied by this method for 5 companies? There are three possibilities:

  1. The method is inaccurate
  2. The method is a valid screen but I’m missing some adjustment for these companies
  3. The companies are over-valued and at some point, will adjust, making them risky investments

While the method is a good screen on valuation, it can be off for any given company for three reasons:  the revenue growth rate I’m using will radically change; a particular company has an ability to dramatically increase gross margins, and/or a particular company can generate much higher profit margins than their gross margin suggests. Each of these may be reflected in the company’s actual valuation but isn’t captured by this method.

To help understand what might make the stock attractive to an advocate, I’ll go into a lot of detail in analyzing Snap. Since similar arguments apply to the other 4, I’ll go into less detail for each but still point out what is implicit in their valuations.

Snap

Snap’s gross margin (GM) is well below its peers and hurts its potential profitability and implied valuation. Last year, GM was about 15%, excluding depreciation and amortization, but it was much higher in the seasonally strong Q4. It’s most direct competitor, Facebook, has a gross margin of 87%.  The difference is that Facebook monetizes its users at a much higher level and has invested billions of dollars and executed quite well in creating its own low-cost infrastructure, while Snap has outsourced its backend to cloud providers Google and Amazon. Snap has recently signed 5-year contracts with each of them to extend the relationships. Committing to lengthy contracts will likely lower the cost of goods sold.  Additionally, increasing revenue per user should also improve GM.  But, continuing to outsource puts a cap on how high margins can reach. Using our model, Snap would need 79% gross margin to justify its current valuation. If I assume that scale and the longer-term contracts will enable Snap to double its gross margins to 30%, the model still shows it as being over-valued by 128% (as opposed to the 276% shown in our table). The other reason bulls on Snap may justify its high valuation is that they expect it to continue to grow revenue at 100% or more in 2018 and beyond. What is built into most forecasts is an assumed decline in revenue growth rates over time… as that is what typically occurs. The model shows that growing revenue 100% a year for two more years without burning cash would leave it only 32% over-valued in 2 years. But as a company scales, keeping revenue growth at that high a level is a daunting task. In fact, Snap already saw revenue growth decline to 75% in Q4 of 2017.

Twitter

Twitter is not profitable.  Revenue declined in 2017 after growing a modest 15% in 2016, and yet it trades at a valuation that implies that it is a growth company of about 50%. While it has achieved such levels in the past, it may be difficult to even get back to 15% growth in the future given increased competition for advertising.

Netflix

I recommended Netflix in January 2015 as one of my stock picks for the year, and it proved a strong recommendation as the stock went up about 140% that year. However, between January 2015 and January 2018, the stock was up over 550% while trailing revenue only increased 112%.  I continue to like the fundamentals of Netflix, but my GM model indicates that the stock may have gotten ahead of itself by a fair amount, and it is unlikely to dramatically increase revenue growth rates from last year’s 32%.

Square

Square has followed what I believe to be the average pattern of revenue growth rate decline as it went from 49% growth in 2015, down to 35% growth in 2016, to under 30% growth in 2017. There is no reason to think this will radically change, but the stock is trading as if its revenue is expected to grow at a nearly 90% rate. On the GM side, Square has been improving GM each year and advocates will point out that it could go higher than the 38% it was in 2017. But, even if I use 45% for GM, assuming it can reach that, the model still implies it is 90% over-valued.

Blue Apron

I don’t want to beat up on a struggling Blue Apron and thought it might have reached its nadir, but the model still implies it is considerably over-valued. One problem that the company is facing is that investors are negative when a company has slow growth and keeps losing money. Such companies find it difficult to raise additional capital. So, before running out of cash, Blue Apron began cutting expenses to try to reach profitability. Unfortunately, given their customer churn, cutting marketing spend resulted in shrinking revenue in each sequential quarter of 2017. In Q4 the burn was down to $30 million but the company was now at a 13% decline in revenue versus Q4 of 2016 (which is what we used in our model). I assume the solution probably needs to be a sale of the company. There could be buyers who would like to acquire the customer base, supplier relationships and Blue Apron’s understanding of process. But given that it has very thin technology, considerable churn and strong competition, I’m not sure if a buyer would be willing to pay a substantial premium to its market cap.


An Alternative Theory on the Over Valued Five

I have to emphasize that I am no longer a Wall Street analyst and don’t have detailed knowledge of the companies discussed in this post, so I easily could be missing some important factors that drive their valuation.  However, if the GM multiple model is an accurate way of determining valuation, then why are they trading at such lofty premiums to implied value? One very noticeable common characteristic of all 5 companies in question is that they are well known brands used by millions (or even tens of millions) of people. Years ago, one of the most successful fund managers ever wrote a book where he told readers to rely on their judgement of what products they thought were great in deciding what stocks to own. I believe there is some large subset of personal and professional investors who do exactly that. So, the stories go:

  • “The younger generation is using Snap instead of Facebook and my son or daughter loves it”
  • “I use Twitter every day and really depend on it”
  • “Netflix is my go-to provider for video content and I’m even thinking of getting rid of my cable subscription”

Once investors substitute such inclinations for hard analysis, valuations can vary widely from those suggested by analytics. I’m not saying that such thoughts can’t prove correct, but I believe that investors need to be very wary of relying on such intuition in the face of evidence that contradicts it.

The Valuation Bible – Part 2: Applying the Rules to Tesla and Creating an Adjusted Valuation Method for Startups

This post is part 2 of our valuation discussion (see this post for part 1).  As I write this post Tesla’s market cap is about $56 billion. I thought it would be interesting to show how the rules discussed in the first post apply to Tesla, and then to take it a step further for startups.

Revenue and Revenue Growth

Revenue for Tesla in 2017 was $11.8 billion, about 68% higher than 2016, and it is likely to grow faster this year given the over $20 billion in pre-orders (and growing) for the model 3 coupled with continued strong demand for the model S and model X. Since it is unclear when the new sports car or truck will ship, I assume no revenue in those categories. As long as Tesla can increase production at the pace they expect, I estimate 2018 revenue will be up 80% – 120% over 2017, with Q4 year over year growth at or above 120%.

If I’m correct on Tesla revenue growth, its 2018 revenue will exceed $20 billion. So, Rule Number 1 from the prior post indicates that Tesla’s high growth rates should merit a higher “theoretical PE” than the S&P (by at least 4X if one believes that growth will continue at elevated rates).

Calculating TPE

Tesla gross margins have varied a bit while ramping production for each new model, but in the 16 quarters from Q1, 2014 to Q4, 2017 gross margin averaged 23% and was above 25%, 6 of the 16 quarters. Given that Tesla is still a relatively young company it appears likely margins will increase with scale, leading me to believe that long term gross margins are very likely to be above 25%. While it will dip during the early production ramp of the model 3, 25% seems like the lowest percent to use for long term modeling and I expect it to rise to between 27% and 30% with higher production volumes and newer factory technology.

Tesla recognizes substantial cost based on stock-based compensation (which partly occurs due to the steep rise in the stock). Most professional investors ignore artificial expenses like stock-based compensation, as I will for modeling purposes, and refer to the actual cost as net SG&A and net R&D. Given that Tesla does not pay commissions and has increased its sales footprint substantially in advance of the roll-out of the model 3, I believe Net SG&A and Net R&D will each increase at a much slower pace than revenue. If they each rise 20% by Q4 of this year and revenue is at or exceeds $20 billion, this would put their total at below 20% of revenue by Q4. Since they should decline further as a percent of revenue as the company matures, I am assuming 27% gross margin and 18% operating cost as the base case for long term operating profit. While this gross margin level is well above traditional auto manufacturers, it seems in line as Tesla does not have independent dealerships (who buy vehicles at a discount) and does not discount its cars at the end of each model year.

Estimated TPE

Table 1 provides the above as the base case for long term operating profit. To provide perspective on the Tesla opportunity, Table 1 also shows a low-end case (25% GM and 20% operating cost) and a high-end profit case (30% GM and 16% operating cost).  Recall, theoretic earnings are derived from applying the mature operating profit level to trailing and to forward revenue. For calculating theoretic earnings, I will ignore interest payments and net tax loss carry forwards as they appear to be a wash over the next 5 years. Finally, to derive the Theoretic Net Earnings Percent a potential mature tax rate needs to be applied. I am using 20% for each model case which gives little credit for tax optimization techniques that could be deployed. That would make theoretic earnings for 2017 and 2018 $0.85 billion and $1.51 billion, respectively and leads to:

  • 2017 TPE=$ 56.1 billion/$0.85 = 66.0
  • 2018 TPE= $ 56.1 billion/1.51 = 37.1

The S&P trailing P/E is 25.5 and forward P/E is about 19X. Based on our analysis of the correlation between growth and P/E provided in the prior post, Tesla should be trading at a minimum of 4X the trailing S&P ratio (or 102 TP/E) and at least 3.5X S&P forward P/E (or 66.5 TP/E). To me that shows that the current valuation of Tesla does not appear out of market.  If the market stays at current P/E levels and Tesla reaches $21B in revenue in 2018 this indicates that there is strong upside for the stock.

Table 1: Tesla TPE 2017 & 2018

The question is whether Tesla can continue to grow revenue at high rates for several years. Currently Tesla has about 2.4% share of the luxury car market giving it ample room to grow that share. At the same time, it is entering the much larger medium-priced market with the launch of the Model 3 and expects to produce vehicles in other categories over the next few years. Worldwide sales of new cars for the auto market is about 90 million in 2017 and growing about 5% a year. Tesla is the leader in several forward trends: electric vehicles, automated vehicles and technology within a car. Plus, it has a superior business model as well. If it reaches $21 billion in revenue in 2018, its share of the worldwide market would be about 0.3%. It appears poised to continue to gain share over the next 3-5 years, especially as it fills out its line of product.  Given that it has achieved a 2.4% share of the market it currently plays in, one could speculate that it could get to a similar share in other categories. Even achieving a 1% share of the worldwide market in 5 years would mean about 40% compound growth between 2018 and 2022 and imply a 75X-90X TP/E at the end of this year.

The Bear Case

I would be remiss if I omitted the risks that those negative on the stock point out. Tesla is a very controversial stock for a variety of reasons:

  1. Gross Margin has been volatile as it adds new production facilities so ‘Bears’ argue that even my 25% low case is optimistic, especially as tax rebate subsidies go away
  2. It has consistently lost money so some say it will never reach the mature case I have outlined
  3. As others produce better electric cars Tesla’s market share of electric vehicles will decline so high revenue growth is not sustainable
  4. Companies like Google have better automated technology that they will license to other manufacturers leading to a leap frog of Tesla

As they say, “beauty is in the eyes of the beholder” and I believe my base case is realistic…but not without risk. In response to the bear case that Tesla revenue growth can’t continue, it is important to recognize that Tesla already has the backlog and order momentum to drive very high growth for the next two years. Past that, growing market share over the 4 subsequent years to 1% (a fraction of their current share of the luxury market) would generate compound annual growth of 40% for that 4-year period. In my opinion, the biggest risk is Tesla’s own execution in ramping production. Bears will also argue that Tesla will never reach the operating margins of my base case for a variety of reasons. This is the weakness of the TPE approach: it depends on assumptions that have yet to be proven. I’m comfortable when my assumptions depend on momentum that is already there, gross margin proof points and likelihood that scale will drive operating margin improvements without any radical change to the business model.

Applying the rules to Startups

As a VC I am often in the position of helping advise companies regarding valuation. This occurs when they are negotiating a round of financing or in an M&A situation.  Because the companies are even earlier than Tesla, theoretic earnings are a bit more difficult to establish. Some investors ignore the growth rates of companies and look for comps in the same business. The problem with the comparable approach is that by selecting companies in the same business, the comps are often very slow growth companies that do not merit a high multiple. For example, comparing Tesla to GM or Ford to me seems a bit ludicrous when Tesla’s revenue grew 68% last year and is expected to grow even faster this year while Ford and GM are growing their revenue at rates below 5%. It would be similar if investors compared Apple (in the early days of the iPhone) to Nokia, a company it was obsoleting.

Investors look for proxies to use that best correlate to what future earnings will be and often settle on a multiple of revenue. As Table 2 shows, there is a correlation between valuation as a multiple of revenue and revenue growth regardless of what industry the companies are in. This correlation is closer than one would find by comparing high growth companies to their older industry peers.

Table 2: Multiple of Revenue and Revenue Growth

However, using revenue as the proxy for future earnings suffers from a wide variety of issues. Some companies have 90% or greater gross margins like our portfolio company Education.com, while others have very low gross margins of 10% – 20%, like Spotify. It is very likely that the former will generate much higher earnings as a percent of revenue than the latter. In fact, Education.com is already cash flow positive at a relatively modest revenue level (in the low double-digit millions) while Spotify continues to lose a considerable amount of money at billions of dollars in revenue. Notice, this method also implies that Tesla should be valued about 60% higher than its current market price.

This leads me to believe a better proxy for earnings is gross margin as it is more closely correlated with earnings levels. It also removes the issue of how revenue is recognized and is much easier to analyze than TPE. For example, Uber recognizing gross revenue or net revenue has no impact on gross margin dollars but would radically change its price to revenue. Table 3 uses the same companies as Table 2 but shows their multiple of gross margin dollars relative to revenue growth. Looking at the two graphs, one can see how much more closely this correlates to the valuation of public companies. The correlation coefficient improves from 0.36 for the revenue multiple to 0.62 for the gross margin multiple.

Table 3: Multiple of Gross Margin vs. Revenue Growth

So, when evaluating a round of financing for a pre-profit company the gross margin multiple as it relates to growth should be considered. For example, while there are many other factors to consider, the formula implies that a 40% revenue growth company should have a valuation of about 14X trailing gross margin dollars.  Typically, I would expect that an earlier stage company’s mature gross margin percent would likely increase. But they also should receive some discount from this analysis as its risk profile is higher than the public companies shown here.

Notice that the price to sales graph indicates Tesla should be selling at 60% more than its multiple of 5X revenue. On the other hand, our low-end case for Tesla Gross Margin, 25%, puts Tesla at 20X Gross Margin dollars, just slightly undervalued based on where the least square line in Table 3 indicates it should be valued.

The Valuation Bible

Facebook valuation image

After many years of successfully picking public and private companies to invest in, I thought I’d share some of the core fundamentals I use to think about how a company should be valued. Let me start by saying numerous companies defy the logic that I will lay out in this post, often for good reasons, sometimes for poor ones. However, eventually most companies will likely approach this method, so it should at least be used as a sanity check against valuations.

When a company is young, it may not have any earnings at all, or it may be at an earnings level (relative to revenue) that is expected to rise. In this post, I’ll start by considering more mature companies that are approaching their long-term model for earnings to establish a framework, before addressing how this framework applies to less mature companies. The post will be followed by another one where I apply the rules to Tesla and discuss how it carries over into private companies.

Growth and Earnings are the Starting Points for Valuing Mature Companies

When a company is public, the most frequently cited metric for valuation is its price to earnings ratio (PE). This may be done based on either a trailing 12 months or a forward 12 months. In classic finance theory a company should be valued based on the present value of future cash flows. What this leads to is our first rule:

Rule 1: Higher Growth Rates should result in a higher PE ratio.

When I was on Wall Street, I studied hundreds of growth companies (this analysis does not apply to cyclical companies) over the prior 10-year period and found that there was a very strong correlation between a given year’s revenue growth rate and the next year’s revenue growth rate. While the growth rate usually declined year over year if it was over 10%, on average this decline was less than 20% of the prior year’s growth rate. What this means is that if we took a group of companies with a revenue growth rate of 40% this year, the average organic growth for the group would likely be about 33%-38% the next year. Of course, things like recessions, major new product releases, tax changes, and more could impact this, but over a lengthy period of time this tended to be a good sanity test. As of January 2, 2018, the average S&P company had a PE ratio of 25 on trailing earnings and was growing revenue at 5% per year. Rule 1 implies that companies growing faster should have higher PEs and those growing slower, lower PEs than the average.

Graph 1: Growth Rates vs. Price Earnings Ratios

graph

The graph shows the correlation between growth and PE based on the valuations of 21 public companies. Based on Rule 1, those above the line may be relatively under-priced and those below relatively over-priced. I say ‘may be’ as there are many other factors to consider, and the above is only one of several ways to value companies. Notice that most of the theoretically over-priced companies with growth rates of under 5% are traditional companies that have long histories of success and pay a dividend. What may be the case is that it takes several years for the market to adjust to their changed circumstances or they may be valued based on the return from the dividend. For example, is Coca Cola trading on: past glory, its 3.5% dividend, or is there something about current earnings that is deceptive (revenue growth has been a problem for several years as people switch from soda to healthier drinks)? I am not up to speed enough to know the answer. Those above the line may be buys despite appearing to be highly valued by other measures.

Relatively early in my career (in 1993-1995) I applied this theory to make one of my best calls on Wall Street: “Buy Dell sell Kellogg”. At the time Dell was growing revenue over 50% per year and Kellogg was struggling to grow it over 4% annually (its compounded growth from 1992 to 1995, this was partly based on price increases). Yet Dell’s PE was about half that of Kellogg and well below the S&P average. So, the call, while radical at the time, was an obvious consequence of Rule 1. Fortunately for me, Dell’s stock appreciated over 65X from January 1993 to January 2000 (and well over 100X while I had it as a top pick) while Kellogg, despite large appreciation in the overall stock market, saw its stock decline slightly over the same 7-year period (but holders did receive annual dividends).

Rule 2: Predictability of Revenue and Earnings Growth should drive a higher trailing PE

Investors place a great deal of value on predictability of growth and earnings, which is why companies with subscription/SaaS models tend to get higher multiples than those with regular sales models. It is also why companies with large sales backlogs usually get additional value. In both cases, investors can more readily value the companies on forward earnings since they are more predictable.

Rule 3: Market Opportunity should impact the Valuation of Emerging Leaders

When one considers why high growth rates might persist, the size of the market opportunity should be viewed as a major factor. The trick here is to make sure the market being considered is really the appropriate one for that company. In the early 1990s, Dell had a relatively small share of a rapidly growing PC market. Given its competitive advantages, I expected Dell to gain share in this mushrooming market. At the same time, Kellogg had a stable share of a relatively flat cereal market, hardly a formula for growth. In recent times, I have consistently recommended Facebook in this blog for the very same reasons I had recommended Dell: in 2013, Facebook had a modest share of the online advertising, a market expected to grow rapidly. Given the advantages Facebook had (and they were apparent as I saw every Azure ecommerce portfolio company moving a large portion of marketing spend to Facebook), it was relatively easy for me to realize that Facebook would rapidly gain share. During the time I’ve owned it and recommended it, this has worked out well as the share price is up over 8X.

How the rules can be applied to companies that are pre-profit

As a VC, it is important to evaluate what companies should be valued at well before they are profitable. While this is nearly impossible to do when we first invest (and won’t be covered in this post), it is feasible to get a realistic range when an offer comes in to acquire a portfolio company that has started to mature. Since they are not profitable, how can I apply a PE ratio?

What needs to be done is to try to forecast eventual profitability when the company matures. A first step is to see where current gross margins are and to understand whether they can realistically increase. The word realistic is the key one here. For example, if a young ecommerce company currently has one distribution center on the west coast, like our portfolio company Le Tote, the impact on shipping costs of adding a second eastern distribution center can be modeled based on current customer locations and known shipping rates from each distribution center. Such modeling, in the case of Le Tote, shows that gross margins will increase 5%-7% once the second distribution center is fully functional. On the other hand, a company that builds revenue city by city, like food service providers, may have little opportunity to save on shipping.

  • Calculating variable Profit Margin

Once the forecast range for “mature” gross margin is estimated, the next step is to identify other costs that will increase in some proportion to revenue. For example, if a company is an ecommerce company that acquires most of its new customers through Facebook, Google and other advertising and has high churn, the spend on customer acquisition may continue to increase in direct proportion to revenue. Similarly, if customer service needs to be labor intensive, this can also be a variable cost. So, the next step in the process is to access where one expects the “variable profit margin” to wind up. While I don’t know the company well, this appears to be a significant issue for Blue Apron: marketing and cost of goods add up to about 90% of revenue. I suspect that customer support probably eats up (no pun intended) 5-10% of what is left, putting variable margins very close to zero. If I assume that the company can eventually generate 10% variable profit margin (which is giving it credit for strong execution), it would need to reach about $4 billion in annual revenue to reach break-even if other costs (product, technology and G&A) do not increase. That means increasing revenue nearly 5-fold. At their current YTD growth rate this would take 9 years and explains why the stock has a low valuation.

  • Estimating Long Term Net Margin

Once the variable profit margin is determined, the next step would be to estimate what the long-term ratio of all other operating cost might be as a percent of revenue. Using this estimate I can determine a Theoretic Net Earnings Percent. Applying this percent to current (or next years) revenue yields a Theoretic Earnings and a Theoretic PE (TPE):

TPE= Market Cap/Theoretic Earnings     

To give you a sense of how I successfully use this, review my recap of the Top Ten Predictions from 2017 where I correctly predicted that Spotify would not go public last year despite strong top line growth as it was hard to see how its business model could support more than 2% or so positive operating margin, and that required renegotiating royalty deals with record labels.  Now that Spotify has successfully negotiated a 3% lower royalty rate from several of the labels, it appears that the 16% gross margins in 2016 could rise to 19% or more by the end of 2018. This means that variable margins (after marketing cost) might be 6%. This would narrow its losses, but still means it might be several years before the company achieves the 2% operating margins discussed in that post. As a result, Spotify appears headed for a non-traditional IPO, clearly fearing that portfolio managers would not be likely to value it at its private valuation price since that would lead to a TPE of over 200. Since Spotify is loved by many consumers, individuals might be willing to overpay relative to my valuation analysis.

Our next post will pick up this theme by walking through why this leads me to believe Tesla continues to have upside, and then discussing how entrepreneurs should view exit opportunities.


SoundBytes

I’ve often written about effective shooting percentage relative to Stephen Curry, and once again he leads the league among players who average 15 points or more per game. What also accounts for the Warriors success is the effective shooting of Klay Thompson, who is 3rd in the league, and Kevin Durant who is 6th. Not surprisingly, Lebron is also in the top 10 (4th). The table below shows the top ten among players averaging 15 points or more per game.  Of the top ten scorers in the league, 6 are among the top 10 effective shooters with James Harden only slightly behind at 54.8%. The remaining 3 are Cousins (53.0%), Lillard (52.2%), and Westbrook, the only one below the league average of 52.1% at 47.4%.

Table: Top Ten Effective Shooters in the League

table

*Note: Bolded players denote those in the top 10 in Points per Game

The Argument for Curry as a Unicorn

In our previous post we posed the potential for Stephen Curry to become a Unicorn (in venture this is a company that reaches $1 billion in value). While it was mostly for fun, on reflection we decided that it actually could prove valid. This post will walk you through why an athlete like Curry (or potentially James Harden, Russell Westbrook or Anthony Davis) could become a Unicorn should they be elevated to the elite status of a LeBron James.

curry unicorn

The Precedent for Creating a Corporation Owning an Athlete’s Earnings Exists

In April 2014, Vernon Davis offered stock in his future earnings via a venture with Fantex, Inc. as part of a new financial instrument being sold by Fantex. Davis offered a 10% share of all future earnings from his brand marketing company to Fantex, which would then turn around and divide it into shares of a tracking stock that can be traded within their own exchange. The offering was 421,100 shares, valued at $10 each, for a total of $4.2 million. This implied a total value of the “Vernon Davis Corporation” of $42 million. Davis’ current salary is $4.7 million and endorsement income about $1.75 million for a total income of $6.5 million. Given that the longevity of football players is rarely into their mid-thirties coupled with Davis being over 30 at the time, it seems likely that he had no more than 3-4 years left in his playing career. Putting those facts together makes it appear that Davis was unlikely to earn much more than $42 million going forward and might earn less as we would expect his income to drop precipitously once he retired. So buying the stock was probably viewed as more of a symbol of support for Davis and its “market cap” appears about equal to his expected future earnings.

NBA Stars are Among the Highest Earning Athletes’

The current highest earner of endorsements in the NBA is LeBron James at about $44 million per year (Kevin Durant is second at $35 million). The highest contract in the league is Kobe Bryant at about $23 million per year (and had been $30 million previously) with the 10 highest players in the league making an average of over $21 million. Given the new TV contract scheduled to go into effect in the 2016-2017 season, it’s been projected that the cap will increase from about  $63 million today to $90 million in 2017 and be nearly $140 million by 2025 (10 years from now, at age 37, Curry should still be playing). Let’s make the following assumptions:

  1. Curry’s salary will go from a current level of $11 million in 2015 and 12 million in 2016 (4 other Warriors will be paid more that year) to about $30 million in 2017 assuming the top salaries tend to be about 1/3 of their team’s cap as they are today.
  2. It will be up to $40 million in 2025, or less than 1/3 the projected $140 million cap.
  3. His endorsements will reach midway between the current levels experienced by LeBron and Durant, to about $40 million by 2017 (they are currently at about $5.5 million from Under Armour)
  4. His endorsement income will rise by about 10%/year subsequently, through 2025 to reach $92 million in 2025
  5. He will continue to earn endorsement income (but will retire from playing) subsequent to the 2025 season.
  6. The level post 2025 will average $60 million per year for 10 years and then go to zero.

The last assumption is based on observing the income of retired stars like Michael Jordan (earning $100 million/year 12 years after retirement), David Beckham (earned about $75 million the first year after retiring), Arnold Palmer (earned $42 million/year 40 years after winning his last tournament), Shaq ($21 million), Magic Johnson is now worth over $500 million. Each are making more now than the total they made while playing and, in several cases, more per year than in their entire playing careers. So assuming Curry’s income will drop by 1/3 after retirement is consistent with these top earners.

chart

This puts his total income from 2016 through the end of 2035 at over $1.5 billion. All of the above assumptions can prove true if Curry continues to ascend to super-star status, which would be helped if the Warriors win the championship this year. They could even prove low if Curry played longer and/or remained an icon for longer than 10 years after retiring. Thankfully, Curry has remained relatively injury free and our analysis assumes that he remains healthy. Curry is not only one of the most exciting players to watch, but is also becoming the most popular player with fans around the league. Curry now ranks second overall in total uniform sales, behind LeBron James.

So while the concept of Stephen Curry as a Unicorn (reaching $1 billion in value) started as a fun one to contemplate with our last post, further analysis reveals that it is actually possible that Fantex or some other entity could create a tracking stock that might reach that type of valuation.

As a VC, I would love to invest in him!

SoundBytes:

  • In the recent game against the Blazers there was further validation of Curry’s MVP bid. Curry delivered eight 3-pointers, hit 17 of 23 shots and went 7-of-7 in his 19-point fourth quarter. His last two threes were a combined distance of 55 feet, setting a new record for threes in a season and breaking his own record!
  • To understand just how well Curry shot, his Field Goal Efficiency was 91% (he had 8 threes bringing his equivalent field goals to 21/23). Not only was this higher than anyone who scored 40 points this year or took at least 20 shots in a game, we believe it may be among the highest ever for someone taking 20 shots in a game.
  • As a comparison, the two Portland stars, Aldredge and Lillian, each had strong games and scored 27 and 20 points, respectively. But, to do that, they took 46 shots between them (double that of Curry) and only scored 2 more points in total for the extra 23 shots!
  • The 4th quarter performance by Curry, cited above, translates to a 114% FGE rating, which is averaging more than 100% shooting as he scored 16 points on 7 shots. When foul shots are taken into account, his True Shooting % was 137% as he scored 19 points on 8 field goal attempts (counting the one on which he was fouled).To draw a comparison, when Russell Westbrook scored 54 points against Portland on April 12 he took 43 shots, 20 more than Curry (23 more if we include shots that led to foul shots).