
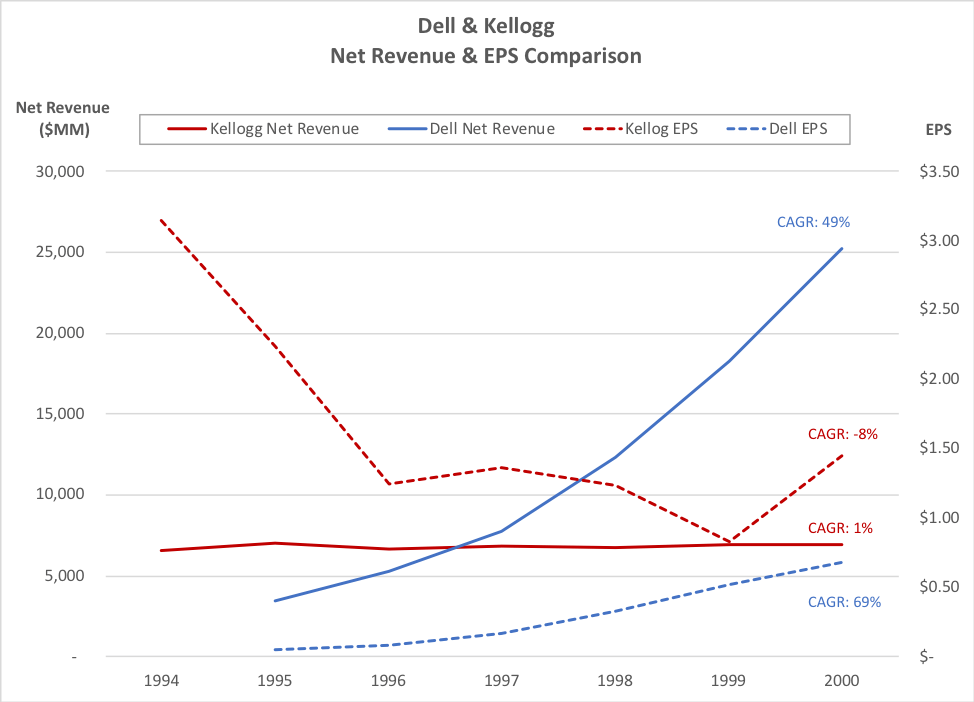
In a past life, while on Wall Street, one of my favorite calls was: “Buy Dell Short Kellogg”. My reasoning behind the call was that while Dell’s revenue and earnings growth was more than 10X that of Kellogg, somehow Kellogg had a much higher PE than Dell. Portfolio managers gave me various reasons they claimed were logical to explain the un-logical situation like: “Kellogg is more reliable at meeting earnings expectations” …. when in truth they had missed estimates 20 straight quarters. What I later came to believe was that the explanation was their overall comfort level with Kellogg because they understood cereal better than they understood a direct marketing PC hardware company at the time. My call worked out well as Dell not only had a revenue CAGR of nearly 50% from January 1995 (FY 95) through January of 2000 (and a 69% EPS CAGR) but also experienced significant multiple expansion while Kellogg revenue grew at just over 1% annually during the ensuing period and its earnings shrunk (as spend was against missed revenue expectations). The success of Dell was a major reason I was subsequently selected as the number one stock picker across Wall Street analysts for 2 years in a row.
I bring up history because history repeats. One of the reasons for my success in investing is that I look at metrics as a basis of long-term valuation. This means ignoring story lines of why the future is much brighter for those with weak metrics or rationales of why disaster will befall a company that has strong results. Of course, I also consider the strength of management, competitive advantages and market size. But one key thesis that comes after studying hundreds of “growth” companies over time is that momentum tends to persist, and strong business models will show solid contribution margin as an indicator of future profitability.
Given this preamble I’ll be comparing two companies that have recently IPO’d. Much like those that supported Kellogg, the supporters of the one with the weaker metrics will have many reasons why it trades at a much higher multiple (of revenue and gross margin dollars) than the one with stronger metrics.
Based on financial theory, companies should be valued based on future cash flows. When a company is at a relatively mature stage, earnings and earnings growth will tend to be the proxy used and a company with higher growth usually trades at a higher multiple of earnings. Since many companies that IPO have little or no earnings, many investors use a multiple of revenue to value them but I prefer to use gross margin or contribution margin (where marketing cost is broken out clearly) as a proxy for potential earnings as they are much better indicators of what portion of revenue can potentially translate to future earnings (see our previous post for valuation methodology).
I would like to hold off on naming the companies so readers can look at the metrics with an unbiased view (which is what I try to do). So, let’s refer to them as Company A and Company B. Table 1 shows their recent metrics.
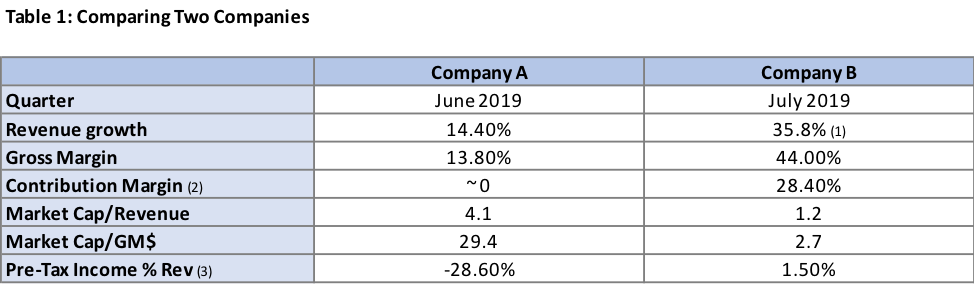
Notes:
- Growth for Company B included an extra week in the quarter. I estimate growth would have been about 27% year/year without the extra week
- Disclosures on marketing seem inexact so these are estimates I believe to be materially correct
- Pre-tax income for Company A is from prior quarter as the June quarter had considerable one-time expenses that would make it appear much worse
Company B is:
- Growing 2 -2 ½ times faster
- Has over 3X the gross margin percentage
- Over 28% contribution margin whereas Company A contribution margin is roughly at 0
- Company B is bordering on profitability already whereas Company A appears years away
Yet, Company A is trading at roughly 3.5X the multiple of revenue and almost 11X the multiple of gross margin dollars (I could not use multiple of contribution margin as Company A was too close to zero). In fairness to Company A, its gross margin was much higher in the prior quarter (at 27%). But even giving it the benefit of this higher number, Company B gross margins were still about 65% higher than Company A.
The apparent illogic in this comparison is much like what we saw when comparing Kellogg to Dell many years ago. The reasons for it are similar: investors, in general, feel more comfortable with Company A than they do with Company B. Additionally, Company A has a “story” on why things will change radically in the future. You may have guessed already that Company A is Uber. Company B is Stitchfix, and despite its moving to an industry leading position for buying clothing at home (using data science to customize each offering) there continues to be fear that Amazon will overwhelm it sometime in the future. While Uber stock has declined about 35% since it peaked in late June it still appears out of sync compared to Stitchfix.
I am a believer that, in general, performance should drive valuation, and have profited greatly by investing in companies that are growing at a healthy rate, appear to have a likelihood of continuing to do so in the near future and have metrics that indicate they are undervalued.
Soundbytes
- It appears that many others are now beginning to focus more closely on gross margins which we have been doing for years. I would encourage a shift to contribution margin, where possible, as this considers the variable cost needed to acquire customers.
- A few notes about Tesla following our 2019 predictions: My household is about to become a two Tesla family. My wife has owned her second Tesla, a Model S, for over 4 years and I just placed an order to buy a Model 3 as a replacement for my Mercedes 550S. Besides the obvious benefits to the environment, I’m also tired of having to go to gas stations every week. The Model 3 can go 310 miles on a charge, is extremely fast, has a great user interface and has autopilot. I looked at several other cars but found it hard to justify paying twice as much (or more) for a car with less pickup, inferior electronics, etc.
- If you were wondering why Tesla stock has gone on a run it is because the Chinese Ministry of Industry and Information Technology (MIIT) has added Tesla to its list of approved auto manufacturers (the news of the possibility broke over a week ago). It appears likely that Tesla will begin producing Model 3s out of the new Giga Factory in China some time in Q4. This not only adds capacity for Tesla to increase its unit sales substantially in 2020 but also will save the Company considerable money as it won’t need to ship cars from its US factory. Remember Tesla also is planning on a Giga Factory in Europe to service strong demand there. The company has said that it will choose the location by the end of 2019. Given the intense competition to be the selected location, it is likely that the site chosen will involve substantial incentives to Tesla. While I would not want to predict when it will be in production, Elon Musk expects the date to be sometime in 2021. Various announcements along the way could be positive for Tesla stock.
