It saves at least 800 jobs at a 14x return to government
Let me start this post by saying I did not vote for Donald Trump and consider myself an independent. But, as my readers know, I can’t help analyzing everything including company business models (both public and private), basketball performance, football, and of course, economics. I have, to date, resisted opining on the election, as it appears to be a polarizing event and therefore a no-win for those who comment. However, I care deeply about the future of our country and the welfare of workers of all levels. Being in Venture Capital allows me to believe (perhaps naively) that I contribute to adding jobs to our country. All this brings me to the recent agreement reached between Trump and Carrier, as it may mark a shift in economic policy.
A key assumption in interpreting the value of the deal is how many jobs were already slated by Carrier to leave the country and which of these were saved. President-Elect Trump has claimed he saved 1,150 jobs. Trump’s opponents say 350 were never slated to leave the country. I’m not going to try to figure out which camp is right. My analysis will only assume 800 manufacturing jobs that were slated to leave the country now will remain in Indiana. This does not seem to be disputed by anyone and was confirmed by a Carrier spokesperson. My observations for this analysis are:
- Had those jobs left, 800 fewer people would be employed (which might be different ones than these but less jobs mean less employment).
- The average worker at these jobs would make $20 an hour plus overtime (some reports have put this as high as $30 per hour fully loaded cost to Carrier). The average worker at these jobs would make about $45,000 annually, assuming modest overtime.
- On average, assuming working spouses in many cases, family income would be an average of $65,000.
Given what we know, here’s why I think Trump’s Carrier deal is a good one for the U.S., and actually results in revenue to the government that far exceeds the tax credits:
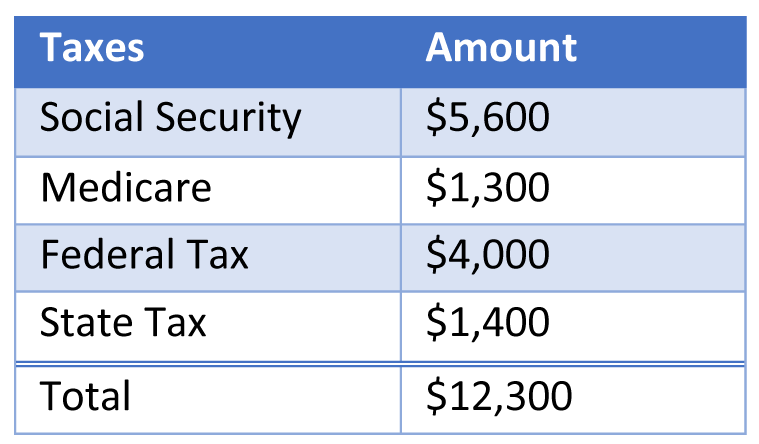
Social security taxes are currently 6.2% of each worker’s wages. The employer matches that, resulting in about $5,600 in FICA tax income to the government per worker from social security. Medicare is 1.45% and is also matched, resulting in about $1,300 in Medicare taxes paid to the government.
The federal income tax increment between a $20,000 family income (for spouse) and $65,000 family income is about $4,000 (but depends on a number of factors). Indiana state taxes of 3.3% on adjusted gross income comes out to nearly $1,400.
To make the total relatively conservative, I’ve omitted county taxes, payroll taxes and other payments that various other governmental entities might receive. This should mean the total financial income to various governmental entities from these jobs remaining probably exceeds those calculated in Table 1 below even if some of my rough assumptions are not exact.
Table 1. Governmental Income per Worker
So, the economic question of whether the subsidy Trump agreed to was worth it partly depends on how much additional income was derived by the government versus the tax credits of $700,000 per year granted to Carrier in exchange for keeping the jobs here.
Of course, there is also a multiplier effect of families having higher income available for spending. And if 800 additional people are unemployed, there are numerous costs paid by the government. We’ll leave these out of the analysis, but they are all real benefits to our society of more people being employed. It is important to realize how expensive it is for the government to subsidize unemployed workers as opposed to realizing multiple sources of tax revenues when these workers have good jobs.
If we take the total from Table 1, which we believe underestimates the income to governmental entities, and multiply it by the 800 workers, the annual benefit adds up to about $9.8 million. Since Carrier is getting a $700,000 annual subsidy, the governmental revenue derived is over 14 times the cost. And that is without including a number of other benefits, some of which we mentioned above. As an investor, I’d take a 14 times return every day of the year. Wouldn’t you? Shouldn’t the government?
This is not a sweetheart deal for Carrier
I won’t go into all the math, but it indicates that Carrier will spend tens of millions of dollars more by keeping workers in the U.S. rather than moving them to Mexico. Comments that the $700,000 yearly benefit they have been given is a sweetheart deal does not appear to be the case.
Why the Democrats lost the election
Trump campaigned on the promise that he would create policies and heavily negotiate to increase employment in America. While this is a small victory in the scheme of things and certainly falls short of retaining all the jobs Carrier wanted to move, the analysis demonstrates that spending some money in tax breaks to increase employment has a large payback to government. It also means a lot to 800 people who greatly prefer being paid for working rather than receiving unemployment benefits.
Is this approach scalable?
The other question is whether this is scalable as a way of keeping jobs in America. Clearly Trump would not be able to negotiate individually with every company planning on moving jobs out of the U.S. Some infrastructure would need to be created – the question would be at what cost? If this became policy, would it encourage more companies to consider moving jobs as a way of attracting tax benefits? Any approach would need to prevent that. My guess is that getting a few companies known to be moving jobs to reconsider is only an interim step. If Trump is to fulfill his promise, an ongoing solution will be needed. But it is important to properly evaluate any steps from an impartial financial viewpoint as the United States needs to increase employment.
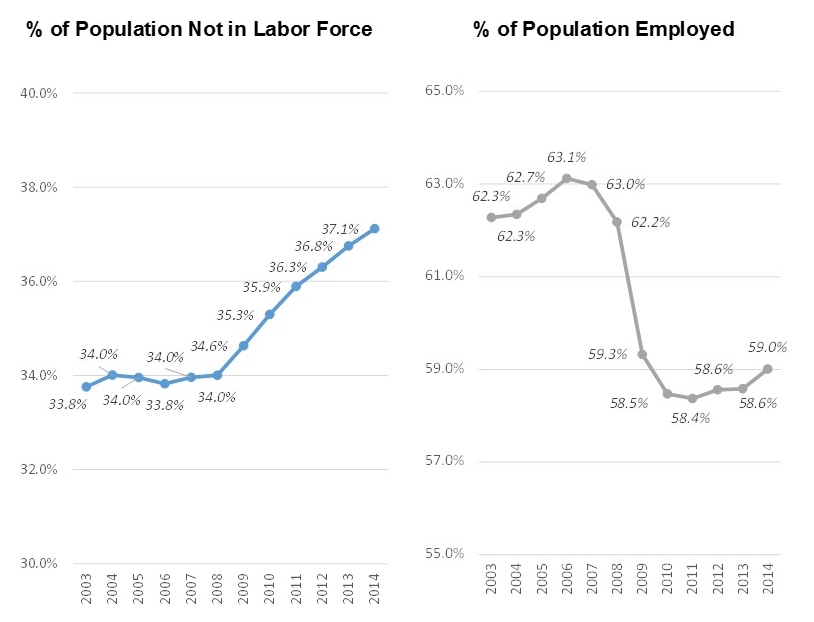
Employment is the right way of measuring the economy’s health
My post of March 2015 discussed the health of the economy and pointed out that looking at the Unemployment Rate as the key indicator was deceptive as much of the improvement was from people dropping out of the workforce. Instead, I advocated using the “Employment Rate” (the percent of the eligible population employed) as a better indicator. I noted that in 2007, pre-downturn, 63.0% of the population had a job. By 2010 this had declined to 58.5%, a 450 basis point drop due to the recession. Four years later the “Recovery” drove that number up to 59.0% which meant only 1/9 of the drop in those working returned to the workforce. Since then the workforce has recovered further but still stands at 325 basis points below the pre-recession level. That is why the rust belt switched from voting Democrat to President-Elect Trump.
The real culprit is loss of better quality job opportunities
In an article in the New York Times on December 7, “stagnant wages” since 1980 were blamed for lack of income growth experienced by the lower half on the economic scale. I believe that the real culprit is loss of better quality job opportunities. Since 1980 production and non-supervisory hourly wages have increased 214% but at the same time manufacturing workers as a percent of the workforce has shrunk from 18.9% to 8.1% and there has been no recovery of these jobs subsequent to the 2007-2010 recession. Many of these displaced workers have been forced to take lower paying jobs in the leisure, health care or other sectors, part-time jobs or dropped out of the workforce entirely (triggering substantial government spending to help them). This loss of available work in manufacturing is staggering and presents a challenge to our society. It also is the button Donald Trump pushed to get elected. I am hoping he can change the trend but it is a difficult task for anyone, Republican or Democrat.
A condensed version of of this post is featured on Fortune.com