My December 2016 post analyzed the Trump deal to retain Carrier workers in the United States and concluded it was positive for the country and for the state of Indiana. It saved 800 jobs and had a payback to the government of more than 14X their investment. I was clear in the post that I hadn’t voted for Trump and consider myself an independent. While I remain an independent, the opportunity to analyze the recently announced deal to get Amazon to commit 25,000 – 40,000 jobs for New York City is irresistible to me as my conclusions will be in support of politicians on the opposite side of the spectrum from Trump: New York Mayor Bill de Blasio and Governor Andrew Cuomo. I believe that:
Analysis of benefits and drawbacks of any major negotiation should be politically independent.
Unfortunately, this has become less and less the case given the divisive politics that we have in our country. What was shocking to me in this case was that some members of their own party (Democrats), heavily criticized de Blasio and Cuomo.
Major Assumption: Jobs are good for a City/State if the cost to government is reasonable
One of the major responsibilities of a political leader is improving the economy in their State/City. The crux of the discussion is really the question: ‘what is a reasonable cost’ for doing so? On one hand, it can be measured in pure cash flow of moneys paid to Amazon (or any other entity a government wants to attract) versus the cash the government will receive from additional tax dollars. On the other hand, there are other factors that benefit or degrade life in the community. Since the former is more measurable, I’ll start with that.
What are the Actual Out-of-Pocket dollars New York City (NYC) and New York State (NYS) will give to Amazon?
I can’t tell if its rhetoric or a lack of clear communication, but many detractors, like state Senator Michael Gianaris, are saying “We’ve got $3 billion dollars to spend, how would you spend it? Amazon would be very low on the list of where that money would go.” To be blunt, this is a ridiculous comment. NYC is spending zero dollars in cash and while the state is providing $505 million of actual cash as a capital grant, far more money will flow back to it. The Capital grant is based on $2.5 billion that Amazon has promised to invest in New York City (to build their HQ, a 600-seat public school, affordable space for manufacturers and to develop a 3.5-acre waterfront esplanade and park).
The rest of the $3 billion falls into 3 incentive programs that have existed for many years to help woo companies to NYS. They are:
- The Excelsior Jobs Program was created in 2010 to replace the expiring Empire Zone Program. Like the prior program, it’s objectives are to provide job creation incentives to firms in targeted industries, like high-tech, for relocating in NYS. The credits are based on the wages added and several other factors. This program, which is available to all companies in the targeted sectors, will generate $1.2 billion in state business income tax credits for Amazon if it meets its commitments.
- The Relocation and Employment Assistance Program (REAP), first established in 2003, targets creating jobs in parts of the city more in need of them, rather than adding to the heavy cluster in downtown and midtown Manhattan, namely the outer boroughs or north of 96th street in Manhattan. The tax credits generated from this program total $897 million and can be used towards reducing Amazon’s New York City corporate taxes over 12 years. This credit is based on the rules of the existing law.
- The Industrial and Commercial Abatement Program (ICAP), which replaced a prior program, created in 2008, provides tax incentives for commercial and industrial buildings that are built, modernized, or expanded. The credits are based on the taxable value created if the city believes it is beneficial based on its location and other factors. This program is generally available and the $386 million in credits are directly tied to the rules of the law.
Table 1: Benefits to Amazon from NYS and NYC

It is important to note most of the benefits to Amazon are “as of right”, so any company can get them. Since these programs scale based on the number of employees or the amount of capital investment, the sheer size of the Amazon commitment creates a “sticker shock” given the associated benefits. The 3 programs were not created for Amazon but have been in existence for years to encourage job creation and industrial development in targeted areas. The credits under REAP and ICAP appear to be as mandated by those programs and not discretionary. It’s harder for me to tie the state tax abatement amount granted under the Excelsior program (by the state) to the law, but the calculation appears to follow it with some judgement in the cap of what is awarded. The capital grant seems to be the only discretionary part of the package and is the only portion that involves out of pocket dollars from the state (the city will not provide any cash incentives).
Could New York Have won the HQ with lesser incentives?
Given the large return on investment to NYC and NYS, the only question in my mind is whether they could have succeeded with even less incentives and generated an even greater return! A whitepaper by Reis, an analytic company for real estate evaluation, judged New York City as a top candidate without considering incentives offered to Amazon. It’s difficult to judge whether New York City would have been chosen with reduced incentives. On the one hand it has the best public transportation, strong cultural advantages, and several great Universities (as a source of employees), especially the new Cornell-Technion campus located directly next to Amazon’s HQ2 location. On the other hand, it is a very expensive place to do business which is why these incentive programs were created to begin with. As a basis of comparison, consider the bundle of incentives Wisconsin offered to get the Taiwanese technology company Foxconn to build a U.S. plant there. For the 13,000 jobs (at an average annual wage of $53,000) that Foxconn has committed to, Wisconsin plus the County and local village have provided about $3.8 billion in tax credits and breaks. The taxable wages in NY will be 6-9 times as much and the incentives are lower. Therefore, I suspect other locations offered Amazon incentives at the same or a greater level as those from New York.
How Does Revenue to the City and State Compare to the out of pocket cost?
I’m going to make the following assumptions:
- New York State Corporate Tax is 6.5% and NYC is 8.85% but I’m assuming the business tax incentives from Excelsior and REAP will be sufficient to preclude Amazon paying any incremental taxes to NYC or NYS (above what they currently pay) for the 12 years they apply. Subsequently, there should be substantial incremental taxes for the additional 8 years of the time horizon I’m using. Since I’m not including this income flow to the city and state, there is considerable upside to my calculations.
- The PILOT program payments, estimated by Deputy Mayor Alicia Glen, at $600 to $650 million are the only real estate taxes Amazon will pay. I’m not sure what it would have been without the ICAP credit but the range for the PILOT program amount appears to be known.
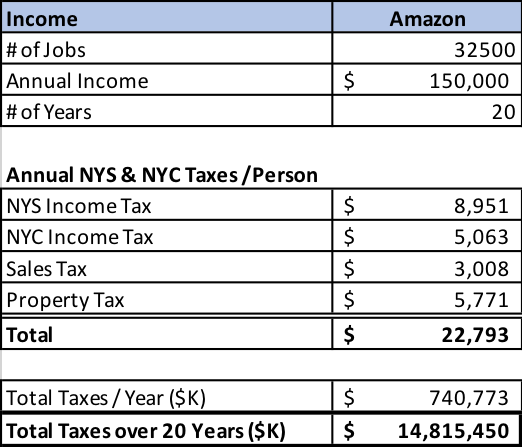
- NYS and/or NYC will benefit from income, sales and property taxes on employees hired by Amazon and taxes on any additional jobs that get created because of Amazon. I’ll assume taxes are on full wages but that employees have no other income (like interest, capital gains, etc.) and all individuals are single. This puts my model for some who are married without a working spouse at higher taxes then they will pay, but my estimates will be too low for those with a working spouse or any with other sources of income. For this purpose, I’ll use the initial 25,000 jobs plus half of the additional 15,000 (32,500) as the average number over a 20 year period. Since the incremental employment should average longer, that seemed a conservative average to use. I’ll also use an average starting salary of $150,000 for the future Amazon employees as that has been in the announcement. As another assumption, to keep my calculations below what should occur, I haven’t assumed any increases in salary. Even a 4% increase per year would cause salaries to more than double by the end of the 20 years (and NYS and NYC income taxes grow by even more). Since those involved in the project would likely have wage increases over time their income and other taxes would be considerably higher than those based on my assumptions. This coupled with the fact that the negotiators for NYC and NYS used 25 years as the horizon, means their tax calculations will be considerably higher (and more accurate) than mine for the direct employees.
I used the website Smart Asset calculator to generate estimates of NYS and NYC Income tax, sales tax, and property tax per year for each income level. As stated before, the actual numbers will be higher because many of these individuals will have other sources of income, a working spouse and will have salaries escalating over time. Table 2 shows the totals for these estimated taxes to be nearly $15B.
Table 2: NYS & NYC Tax Impact from Amazon HQ
- Scholars have found strong evidence of the presence of a local multiplier effect. These come from the direct employees hired, indirect jobs created from suppliers and partners and induced jobs that are a result of the spending of the direct and indirect jobs as well as each layer of induced jobs. For example, a noted scholar on the subject, Enrico Moretti, determined that when Apple Computer was employing 12,000 workers locally, an additional 60,000 jobs were created. These included 36,000 unskilled positions like restaurant or retail workers, and 24,000 skilled jobs like lawyers or doctors. If I assume this 5 to 1 ratio would hold for the highly paid Amazon workers, then 32,500 technology jobs would generate 162,500 more jobs in NYC! Based on the Apple example, 60% of these would be unskilled and 40% highly skilled. Assuming an average salary of $35,000 for the unskilled, an average of $100,00 for half of the skilled and $150,000 for the other half, taxes generated from the multiplier effect over the 20 years would be over $28 billion.
Table 3: NYS & NYC Tax Impact from Amazon HQ Multiplier Effect

- The $2.5 billion Amazon has committed to spend on capital projects would in turn generate further jobs in construction and an associated multiplier impact, but since this is a temporary benefit over 2-5 years, I have omitted it from the analysis.
- The $43 billion estimated total of these income streams to the city and state assume the tax abatements cause no incremental corporate taxes from Amazon. While Amazon will be paying rent on the land leased from the city, I also left out this benefit as I couldn’t estimate the amount. While I believe the actual benefit could be higher, consider that even if I’m off by 75% on the multiplier effect, the total would still be over $22 billion and the payback about 44X the $505 million cash outlay!
Other Benefits and Negatives of Attracting Amazon
There are a variety of more difficult factors to analyze than the straight forward financial windfall the city and state will get from this agreement. Living in the San Francisco Bay Area has taught me that what I may view as obvious might not be so to others. Becoming the Florence of the Tech World has meant that the Bay Area is incredibly wealthy, in turn generating a huge tax base for government to use to fund helping the homeless, stem research and many other perceived public good initiatives. Attracting 25,000 – 40,000 technology jobs will vault New York City into a clear contender for tech community leadership. It will lead to others following and to the creation of more startups, one or two who could become the next Amazon, Apple, Google, Facebook, or Microsoft (generating more jobs and more tax income to NYC and NYS). This is not universally celebrated in the Bay Area as it also has led to traffic congestion, higher housing prices, and increased cost of entertainment. But It has meant increased employment opportunities across the full spectrum of jobs. However, an average worker, while making more than elsewhere, can find it a difficult place to afford. In New York City these issues are partly offset for those renting apartments due to rent control and rent stabilization as over 50% of all rental units are under some form of regulation.
New York City is large enough to be able to absorb 25,000 to 40,000 workers relatively easily, but it could add to the problems for the already strained subway system. I believe it’s no accident that Amazon chose a location near the water so that its employees could take advantage of the new, highly praised, NYC Ferry system. While many of the workers may choose to live near the Amazon facilities, some may decide to buy houses in locations that require utilizing mass transit. If I were to guess, I would say a portion of the increased cash flow, to the city will be used to improve the subway system, Long Island Railroad and to add more Ferries each of which will benefit all New Yorkers.
Conclusion: The Amazon Agreement for HQ2 to be in NYC is a Huge Positive for NYC and NYS
While detractors may nitpick at the deal, it has a great ROI for the City and State, will increase employment, provide revenue to improve mass transit and follows incentives mandated by existing laws. Clearly a coup for Mayor de Blasio and Governor Cuomo.
Soundbytes
- The SF Chronicle published an article on November 28, 2018 touting Stephan Curry’s strong credentials as a possible MVP this year. In it they used several of the statistics we discussed a year ago. Namely, how much better his teammates shoot when they play with Curry and his amazing plus/minus.
- Sticking with sports, I can’t help ruminating on how the NFL keeps shooting itself in the foot. I won’t comment on the latest unsavory incidents among players towards women or the Kaepernick fiasco. Instead, I keep thinking about what to call the team about to leave Oakland:
- Oakland Raiders, their current name
- Oakland Traders, given their propensity to exchange top players for draft choices
- Oakland Traitors, trading away their best current players, which has insured a terrible season – thus completing the betrayal of the City of Oakland and the most loyal and colorful fan base in the league