Recap of 2020 Top Ten Predictions

Tesla’s new pickup truck due out late 2021

Bull Markets have Tended to Favor My Stock Picks

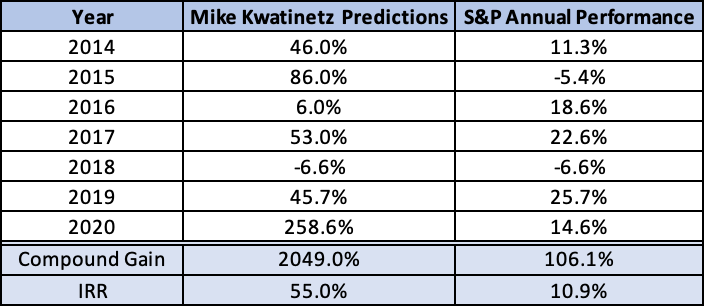
This may seem like a repeat of what you have heard from me in the past, but I enter each year with some trepidation as my favored stocks are high beta and usually had increased in value the prior year (in 2019 they were up about 46% or nearly double the S&P which also had a strong year). The fact is: I’m typically nervous that somehow my “luck” will run out. But, in 2020 I was actually pretty confident that my stock picks would perform well and would beat the market. I felt this confidence because the companies I liked were poised for another very strong growth year, had appreciated well under their growth over the prior 2-year period and were dominant players in each of their sub-sectors. Of course, no one could foresee the crazy year we would all face in 2020 as the worldwide pandemic radically changed society’s activities, purchasing behavior, and means of communication. As it turns out, of the 6 stocks I included in my top ten list 3 were beneficiaries of the pandemic, 2 were hurt by it and one was close to neutral. The pandemic beneficiaries experienced above normal revenue growth and each of the others faired reasonably well despite Covid’s impact. The market, after a major decline in March closed the year with double digit gains. Having said all that, I may never replicate my outperformance in 2020 as the 6 stocks had an average gain of an astounding 259% and every one of them outperformed the S&P gain of 14.6% quite handily.

Before reviewing each of my top ten from last year, I would like to once again reveal long term performance of the stock pick portion of the top ten list. I assume equal weighting for each stock in each year to come up with performance and then compound the yearly gains (or losses) to provide the 7-year performance. I’m comparing the S&P index at December 31 of each year to determine annual performance.  Soundbyte’s compound gain for the 7-year period is 2049% which equates to an IRR of 55.0%. The S&P was up 106.1% during the same 7-year period, an IRR of 10.9%.

2020 Non-Stock Top Ten Predictions also Impacted by Covid

The pandemic not only affected stock performance, it had serious impact on my non-stock predictions. In the extreme, my prediction regarding the Warriors 2020-2021 season essentially became moot as the season was postponed to start in late December…so had barely over a week of games in the current year! My other 3 predictions were all affected as well. I’ll discuss each after reviewing the stock picks.

The 2020 Stocks Picked to Outperform the Market (S&P 500)

  1. Tesla Stock which closed 2019 at $418/share and split 5 for 1 subsequently
  2. Facebook which closed 2019 at $205/share
  3. DocuSign which closed 2019 at $74/share
  4. Stitch Fix which closed 2019 at $25.66/share
  5. Amazon which closed 2019 at $1848/share
  6. Zoom Video Communications which closed 2019 at $72.20/share

In last year’s recap I noted 3 of my picks had “amazing performance” as they were up between 51% and 72%. That is indeed amazing in any year. However, 2020 was not “any year”. The 6 picks made 2019 gains look like chopped liver as 4 of my 6 picks were up well over 100%, a 5th was up over 70% and the last had gains of double the S&P. In the discussion below, I’ve listed in bold each of my ten predictions and give an evaluation of how I fared on each.

1. Tesla stock appreciation will continue to outperform the market (it closed last year at $418/share). Note that after the 5 for 1 split this adjusts to $84.50/share.

In 2020, Tesla provided one of the wildest rides I’ve ever seen. By all appearances, it was negatively impacted by the pandemic for three reasons: people reduced the amount they drove thereby lessening demand for buying a new vehicle, supply chains were disrupted, and Tesla’s Fremont plant was forced to be closed for seven weeks thereby limiting supply. Yet the company continued to establish itself as the dominant player in electronic, self-driving vehicles. It may have increased its lead in user software in its cars and it continued to maintain substantial advantages in battery technology. The environment was also quite favorable for a market share increase of eco-friendly vehicles.

Additionally, several other factors helped create demand for the stock. The 5 for 1 stock split, announced in August was clearly a factor in a 75% gain over a 3-week period. Inclusion in the S&P 500 helped cause an additional spike in the latter part of the year. Tesla expanded its product line into 2 new categories by launching the Model Y, a compact SUV, to rave reviews and demonstrating its planned pickup truck (due in late 2021) as well. While the truck demo had some snags, orders for it (with a small deposit) are currently over 650,000 units.

All in all, these factors led to Tesla closing the year at $706/share, post-split, an astounding gain of 744% making this the largest one year gain I’ve had in the 7 years of Soundbytes.

2. Facebook Stock will outpace the market (it closed 2019 at $205 per share)

Facebook was one of the companies that was hurt by the pandemic as major categories of advertising essentially disappeared for months. Among these were live events of any kind and associated ticketing company advertising, airlines and cruise lines, off-line retail, hotels, and much more. Combine this with the company’s continued issues with regulatory bodies, its stock faced an uphill battle in 2020. What enabled it to close the year at $273 per share, up 33% (over 2x the S&P), is that its valuation remains low by straight financial metrics.

3. DocuSign stock appreciation will continue to outperform the market (it closed 2019 at $74/share)

DocuSign was another beneficiary of the pandemic as it helped speed the use of eSignature technology. The acceleration boosted revenue growth to 53% YoY in Q3, 2021 (the quarter ended on October 31, 2020) from 39% in Fiscal 2020.  Since growth typically declines for high-growth companies this was significant. Investors also seemed to agree with me that the company would not lose the gains when the pandemic ends. Further, DocuSign expanded its product range into contract life-cycle management and several other categories thereby growing its TAM (total available market). Despite increased usage, DocuSign COGs did not rise (Gross Margin was 79% in Q3). Finally, competition appeared to weaken as its biggest competitor, Adobe, lost considerable ground. This all led to a sizable stock gain of 200% to $222/share at year end.

4. Stitch Fix stock appreciation will continue to outperform the market (it closed 2019 at $25.66/share)

Stitch Fix had a roller coaster year mostly due to the pandemic driving people to work from home, which led to a decline in purchasing of clothes. I’m guessing many of you, like me, wear jeans and a fleece or sweatshirt most days so our need for new clothes is reduced. This caused Stitch Fix to have negative growth earlier in the year and for its stock to drop in price over 50% by early April. But, the other side of the equation is that brick and mortar stores lost meaningful share to eMerchants like Stitch Fix. So, in the October quarter, Stitch Fix returned to growth after 2 weak quarters caused by the pandemic. The growth of revenue at 10% YoY was below their pre-pandemic level but represented a dramatic turn in its fortunes. Additionally, the CEO guided to 20-25% growth going forward. The stock reacted very positively and closed the year at $58.72/share up 129% for the year.

5. Amazon stock strategy will outpace the market (it closed last year at $1848/share)

Amazon had a banner year in 2020 with a jump in growth driven by the pandemic. Net sales grew 37% YoY in Q3 as compared to an approximate 20% level, pre-pandemic. Their gains were in every category and every geography but certainly eCommerce led the way as consumers shifted more of their buying to the web. Of course, such a shift also meant increased growth for AWS as well. Net Income in Q3 was up 197% YoY to over $6.3 billion. Given the increase in its growth rate and strong earnings the stock performed quite well in 2020 and was up 76% to $3257/share.

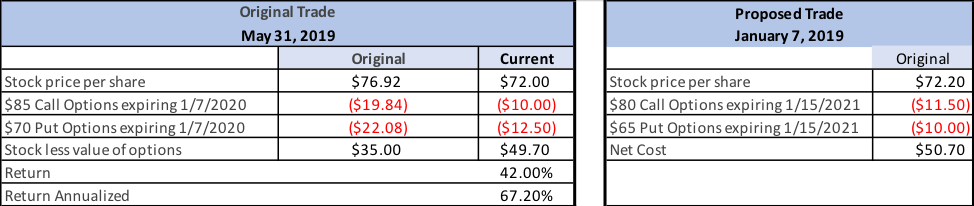
In our post we also recommended selling puts with a strike price of $1750 as an augmented strategy to boost returns. Had someone done that the return would have increased to 89%. For the purposes of blog performance, I will continue to use the stock price increase for performance. Regardless, this pick was another winner.

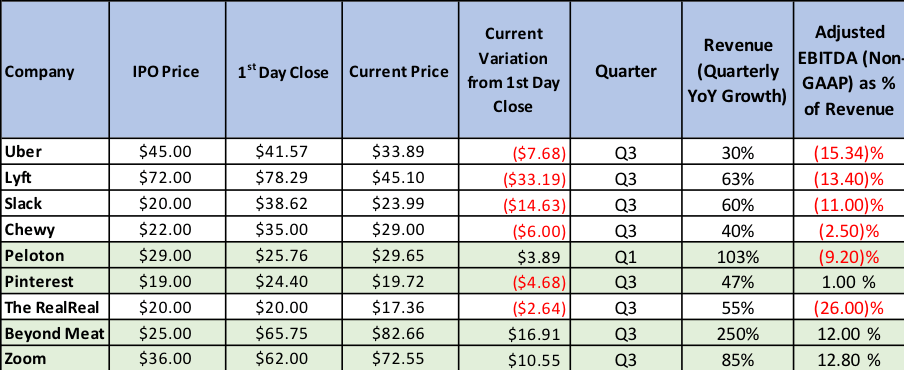
6. I added Zoom Media to the list of recommended stocks. It closed 2019 at $72.20

When I put Zoom on my list of recommended stocks, I had no idea we’d be going through a pandemic that would turn it into a household name. Instead, I was confident that the migration from audio calls to video conference calls would continue to accelerate and Zoom has the best product and pricing in the category. For its fiscal 2020-year (ending in January, 2020) Zoom grew revenue 78% with the final sequential quarter of the year growth at 13.0%. Once the pandemic hit, Zoom sales accelerated greatly with the April quarter up 74% sequentially and 169% YoY. The April quarter only had 5 weeks of pandemic benefit. The July quarter had a full 3 months of benefit and increased an astounding 102% sequentially and 355% YoY.  Q3, the October quarter continued the upward trend but now had a full quarter of the pandemic as a sequential compare. So, while the YoY growth was 367%, the sequential quarterly growth began to normalize. At over 17% it still exceeded what it was averaging for the quarters preceding the pandemic but was a disappointment to investors and the stock has been trading off since reporting Q3 numbers. Regardless of the pullback, the stock is ahead 369% in 2020, closing the year at $337/share .

In the post we also outlined a strategy that combined selling both put and call options with purchasing the stock. Later in the year we pointed out that buying back the calls and selling the stock made sense mid-year if one wanted to maximize IRR. If one had followed the strategy (including the buyback we suggested) the return would still have been well over a 100% IRR but clearly lower than the return without the options. As with Amazon, for blog performance, we are only focused on the straight stock strategy. And this recommendation turned out to be stellar.

Unusual Year for the Non-Stock Predictions

7. The major election year will cause a substantial increase in advertising dollars spent

This forecast proved quite valid. Michael Bloomberg alone spent over $1 billion during his primary run. The Center for Responsive Politics reported that they projected just under $11 billion in spending would take place between candidates for president, the Senate and the House in the general election. This was about 50% higher than in 2016. Additionally, there will be incremental dollars devoted to the runoff Senate races in Georgia. This increase helped advertising companies offset some of the lost revenue discussed above.

8. Automation of Retail will continue to gain momentum

Given the pandemic, most projects were suspended so this did not take place. And it may be a while before we have enough normalization for this trend to resume, but I am confident it will. However, the pandemic also caused an acceleration in eCommerce for brick and mortar supermarkets and restaurants. I’m guessing almost everyone reading this post has increased their use of one or more of: Instacart, Amazon Fresh, Walmart delivery, Safeway delivery, Uber Eats, GrubHub, Doordash, etc. My wife and I even started ordering specialty foods (like lox) from New York through either Goldbelly or Zabars. Restaurants that would not have dreamed of focusing on takeout through eCommerce are now immersed in it. While this was not the automation that I had contemplated it still represents a radical change.

9. The Warriors will come back strong in the 2020/2021 season

This was my fun prediction. Unfortunately, the combination of injuries and Covid eliminated fun for sports fans. I expected that there would be enough games in 2020 to evaluate whether my forecast was correct or not. Since the season started in late December its premature to evaluate it. Also, I pointed out that the team had to stay relatively healthy for the prediction to work. Guess what? The Warriors have already had 2 devastating injuries (Thompson the critical one, and Chriss, who I expected would help the second team as well).

Yet, several things I predicted in the post have occurred:

  1. The younger players did develop last season, especially Pascal
  2.  The Warriors did get a very high draft choice and at first blush he seems like a winner
  3. The Warriors did use the Iguodala cap space to sign a strong veteran, Oubre.

Given the absence of Thompson, the team will be successful if they make the playoffs. So, let’s suspend evaluating the forecast to see if that occurs in a packed Western Conference despite losing Thompson. Last year they started 4 and 16. For the 2020-2021 season  (as of January 3) they are 3 and 3 and appear to be a much better team that needs time to jell. But the jury is out as to how good (or bad) they will be. 

10. At least one of the major Unicorns will be acquired by a larger player

There were 9 Unicorns listed in the post. Eight are still going at it by themselves but the 9th, Slack, has recently been acquired by SalesForce making this an accurate prediction.

2021 Predictions coming soon

Stay tuned for my top ten predictions for 2021… but please note most of the 6 stocks from 2020 will continue on the list and as usual, for these stocks, we will use their 2020 closing prices as the start price for 2021. For any new stock we add, we will use the price of the stock as we are writing the post.

Soundbytes

I thought I would share something I saw elsewhere regarding New Year’s wishes. In the past most people wished for things like success for themselves and/or family members in one form or another. The pandemic has even transformed this. Today, I believe most people are more focused on wishing for health for them, their family, friends, and an end to this terrible pandemic. Please take care of yourselves, stay safe. We are getting closer to the end as vaccines are here and will get rolled out to all of us over the next 4-6 months.

2020 Top Ten Predictions

I wanted to start this post by repeating something I discussed in my top ten lists in 2017 and 2018 which I learned while at Sanford Bernstein in my Wall Street days: “Owning companies that have strong competitive advantages and a great business model in a potentially mega-sized market can create the largest performance gains over time (assuming one is correct).” It does make my stock predictions somewhat boring (as they were on Wall Street where my top picks, Dell and Microsoft each appreciated over 100X over the ten years I was recommending them).

Let’s do a little simple math. Suppose one can generate an IRR of 26% per year (my target is to be over 25%) over a long period of time.  The wonder of compounding is that at 26% per year your assets will double every 3 years. In 6 years, this would mean 4X your original investment dollars and in 12 years the result would be 16X. For comparison purposes, at 5% per year your assets would only be 1.8X in 12 years and at 10% IRR 3.1X.  While 25%+ IRR represents very high performance, I have been fortunate enough to consistently exceed it (but always am worried that it can’t keep up)! For my recommendations of the past 6 years, the IRR is 34.8% and since this exceeds 26%, the 6-year performance  is roughly 6X rather than 4X.

What is the trick to achieving 25% plus IRR? Here are a few of my basic rules:

  1. Start with companies growing revenue 20% or more, where those closer to 20% also have opportunity to expand income faster than revenue
  2. Make sure the market they are attacking is large enough to support continued high growth for at least 5 years forward
  3. Stay away from companies that don’t have profitability in sight as companies eventually should trade at a multiple of earnings.
  4. Only choose companies with competitive advantages in their space
  5. Re-evaluate your choices periodically but don’t be consumed by short term movement

As I go through each of my 6 stock picks I have also considered where the stock currently trades relative to its growth and other performance metrics. With that in mind, as is my tendency (and was stated in my last post), I am continuing to recommend Tesla, Facebook, Amazon, Stitch Fix and DocuSign. I am adding Zoom Video Communications (ZM) to the list. For Zoom and Amazon I will recommend a more complex transaction to achieve my target return.

2020 Stock Recommendations:

1. Tesla stock appreciation will continue to outperform the market (it closed last year at $418/share)

Tesla is likely to continue to be a volatile stock, but it has so many positives in front of it that I believe it wise to continue to own it. The upward trend in units and revenue should be strong in 2020 because:

  • The model 3 continues to be one of the most attractive cars on the market. Electric Car Reviews has come out with a report stating that Model 3 cost of ownership not only blows away the Audi AS but is also lower than a Toyota Camry! The analysis is that the 5-year cost of ownership of the Tesla is $0.46 per mile while the Audi AS comes in 70% higher at $0.80 per mile. While Audi being more expensive is no surprise, what is shocking is how much more expensive it is. The report also determined that Toyota Camry has a higher cost as well ($0.49/mile)! Given the fact that the Tesla is a luxury vehicle and the Camry is far from that, why would anyone with this knowledge decide to buy a low-end car like a Camry over a Model 3 when the Camry costs more to own?  What gets the Tesla to a lower cost than the Camry is much lower fuel cost, virtually no maintenance cost and high resale value. While the Camry purchase price is lower, these factors more than make up for the initial price difference
  • China, the largest market for electronic vehicles, is about to take off in sales. With the new production facility in China going live, Tesla will be able to significantly increase production in 2020 and will benefit from the car no longer being subject to import duties in China.  
  • European demand for Teslas is increasing dramatically. With its Chinese plant going live, Tesla will be able to partly meet European demand which could be as high as the U.S. in the future. The company is building another factory in Europe in anticipation. The earliest indicator of just how much market share Tesla can reach has occurred in Norway where electric cars receive numerous incentives. Tesla is now the best selling car in that country and demand for electric cars there now exceeds gas driven vehicles.

While 2020 is shaping up as a stairstep uptick in sales for Tesla given increased capacity and demand, various factors augur continued growth well beyond 2020. For example, Tesla is only partway towards having a full lineup of vehicles. In the future it will add:

  • Pickup trucks – where pre-orders and recent surveys indicate it will acquire 10-20% of that market
  • A lower priced SUV – at Model 3 type pricing this will be attacking a much larger market than the Model X
  • A sports car – early specifications indicate that it could rival Ferrari in performance but at pricing more like a Porsche
  • A refreshed version of the Model S
  • A semi – where the lower cost of fuel and maintenance could mean strong market share.

2. Facebook stock appreciation will continue to outperform the market (it closed last year at $205/share)

Facebook, like Tesla, continues to have a great deal of controversy surrounding it and therefore may sometimes have price drops that its financial metrics do not warrant. This was the case in 2018 when the stock dropped 28% in value during that year. While 2019 partly recovered from what I believe was an excessive reaction, it’s important to note that the 2019 year-end price of $205/share was only 16% higher than at the end of 2017 while trailing revenue will have grown by about 75% in the 2-year period. The EPS run rate should be up in a similar way after a few quarters of lower earnings in early 2019. My point is that the stock remains at a low price given its metrics. I expect Q4 to be quite strong and believe 2020 will continue to show solid growth.

The Facebook platform is still increasing the number of active users, albeit by only about 5%-6%. Additionally, Facebook continues to increase inventory utilization and pricing. In fact, given what I anticipate will be added advertising spend due to the heated elections for president, senate seats, governorships etc., Facebook advertising inventory usage and rates could increase faster (see prediction 7 on election spending).  

Facebook should also benefit by an acceleration of commerce and increased monetization of advertising on Instagram. Facebook started monetizing that platform in 2017 and Instagram revenue has been growing exponentially and is likely to close out 2019 at well over $10 billion. A wild card for growth is potential monetization of WhatsApp. That platform now has over 1.5 billion active users with over 300 million active every day. It appears close to beginning monetization.

The factors discussed could enable Facebook to continue to grow revenue at 20% – 30% annually for another 3-5 years making it a sound longer term investment.

3. DocuSign stock appreciation will continue to outperform the market (it closed last year at $74/share)

DocuSign is the runaway leader in e-signatures facilitating multiple parties signing documents in a secure, reliable way for board resolutions, mortgages, investment documents, etc. Being the early leader creates a network effect, as hundreds of millions of people are in the DocuSign e-signature database. The company has worked hard to expand its scope of usage for both enterprise and smaller companies by adding software for full life-cycle management of agreements. This includes the process of generating, redlining, and negotiating agreements in a multi-user environment, all under secure conditions. On the small business side, the DocuSign product is called DocuSign Negotiate and is integrated with Salesforce.

The company is a SaaS company with a stable revenue base of over 560,000 customers at the end of October, up well over 20% from a year earlier. Its strategy is one of land and expand with revenue from existing customers increasing each year leading to a roughly 40% year over year revenue increase in the most recent quarter (fiscal Q3). SaaS products account for over 95% of revenue with professional services providing the rest. As a SaaS company, gross margins are high at 79% (on a non-GAAP basis).

The company has now reached positive earnings on a non-GAAP basis of $0.11/share versus $0.00 a year ago. I use non-GAAP as GAAP financials distort actual results by creating extra cost on the P&L if the company’s stock appreciates. These costs are theoretic rather than real.

My only concern with this recommendation is that the stock has had a 72% runup in 2019 but given its growth, move to positive earnings and the fact that SaaS companies trade at higher multiples of revenue than others I still believe it can outperform this year.

4. Stitch Fix Stock appreciation will continue to outperform the market (it closed last year at $25.66/share)

Stitch Fix offers customers, who are primarily women, the ability to shop from home by sending them a box with several items selected based on sophisticated analysis of her profile and prior purchases. The customer pays a $20 “styling fee” for the box which can be applied towards purchasing anything in the box. The company is the strong leader in the space with revenue approaching a $2 billion run rate. Unlike many of the recent IPO companies, it has shown an ability to balance growth and earnings. The stock had a strong 2019 ending the year at $25.66 per share up 51% over the 2018 closing price. Despite this, our valuation methodology continues to show it to be substantially under valued and it remains one of my picks for 2020. The likely cause of what I believe is a low valuation is a fear of Amazon making it difficult for Stitch Fix to succeed. As the company gets larger this fear should recede helping the multiple to expand.  

Stitch Fix continues to add higher-end brands and to increase its reach into men, plus sizes and kids. Its algorithms to personalize each box of clothes it ships keeps improving. Therefore, the company can spend less on acquiring new customers as it has increased its ability to get existing customers to spend more and come back more often. Stitch Fix can continue to grow its revenue from women in the U.S. with expansion opportunities in international markets over time. I believe the company can continue to grow by roughly 20% or more in 2020 and beyond.

Stitch Fix revenue growth (of over 21% in the latest reported quarter) comes from a combination of increasing the number of active clients by 17% to 3.4 million, coupled with driving higher revenue per active client. The company accomplished this while generating profits on a non-GAAP basis.

5. Amazon stock strategy will outpace the market (it closed last year at $1848/share).

Amazon shares increased by 23% last year while revenue in Q3 was up 24% year over year. This meant the stock performance mirrored revenue growth. Growth in the core commerce business has slowed but Amazon’s cloud and echo/Alexa businesses are strong enough to help the company maintain roughly 20% growth in 2020. The company continues to invest heavily in R&D with a push to create automated retail stores one of its latest initiatives. If that proves successful, Amazon can greatly expand its physical presence and potentially increase growth through the rollout of numerous brick and mortar locations. But at its current size, it will be difficult for the company to maintain over 20% revenue growth for many years (excluding acquisitions) so I am suggesting a more complex investment in this stock:

  1. Buy X shares of the stock (or keep the ones you have)
  2. Sell Amazon puts for the same number of shares with the puts expiring on January 15, 2021 and having a strike price of $1750. The most recent sale of these puts was for over $126
  3. So, net out of pocket cost would be reduced to $1722
  4. A 20% increase in the stock price (roughly Amazon’s growth rate) would mean 29% growth in value since the puts would expire worthless
  5. If the stock declined 226 points the option sale would be a break-even. Any decline beyond that and you would lose additional dollars.
  6. If the options still have a premium on December 31, I will measure their value on January 15, 2021 for the purposes of performance.

6. I’m adding Zoom Video Communications to the list but with an even more complex investment strategy (the stock is currently at $72.20)

I discussed Zoom Video Communications (ZM) in my post on June 24, 2019. In that post I described the reasons I liked Zoom for the long term:

  1. Revenue retention of a cohort was about 140%
  2. It acquires customers very efficiently with a payback period of 7 months as the host of a Zoom call invites various people to participate in the call and those who are not already Zoom users can be readily targeted by the company at little cost
  3. Gross Margins are over 80% and could increase
  4. The product has been rated best in class numerous times
  5. Its compression technology (the key ingredient in making video high quality) appears to have a multi-year lead over the competition
  6. Adding to those reasons it’s important to note that ZM is improving earnings and was slightly profitable in its most recent reported quarter

The fly in the ointment was that my valuation technology showed that it was overvalued. However, I came up with a way of “future pricing” the stock. Since I expected revenue to grow by about 150% over the next 7 quarters (at the time it was growing over 100% year over year) “future pricing” would make it an attractive stock. This was possible due to the extremely high premiums for options in the stock. So far that call is working out. Despite the company growing revenue in the 3 quarters subsequent to my post by over 57%, my concern about valuation has proven correct and the stock has declined from $76.92 to $72.20. If I closed out the position today by selling the stock and buying back the options (see Table 1) my return for less than 7.5 months would be a 42% profit. This has occurred despite the stock declining slightly due to shrinkage in the premiums.

Table 1: Previous Zoom trade and proposed trade

I typically prefer using longer term options for doing this type of trade as revenue growth of this magnitude should eventually cause the stock to rise, plus the premiums on options that are further out are much higher, reducing the risk profile, but I will construct this trade so that the options expire on January 15, 2021 to be able to evaluate it in one year. In measuring my performance we’ll use the closing stock price on the option expiration date, January 15, 2021 since premiums in options persist until their expiration date so the extra 2 weeks leads to better optimization of the trade.

So, here is the proposed trade (see table 1):

  1. Buy X shares of the stock at $72.20 (today’s price)
  2. Sell Calls for X shares expiring January 15, 2021 at a strike of $80/share for $11.50 (same as last price it traded)
  3. Sell puts for X shares expiring January 15, 2021 with strike of $65/share for $10.00 (same as last price it traded)

I expect revenue growth of 60% or more 4 quarters out. I also expect the stock to rise some portion of that, as it is now closer to its value than when I did the earlier transaction on May 31, 2019. Check my prior post for further analysis on Zoom, but here are 3 cases that matter at December 31, 2020:

  • Stock closes over $80/share (up 11% or more) at end of the year: the profit would be 58% of the net cost of the transaction
    • This would happen because the stock would be called, and you would get $80/share
    • The put would expire worthless
    • Since you paid a net cost of $50.70, net profit would be $29.30
  • Stock closes flat at $72.20:  your profit would be $21.50 (42%)
    • The put and the call would each expire worthless, so you would earn the original premiums you received when you sold them
    • The stock would be worth the same as what you paid
  • Stock closes at $57.85 on December 31: you would be at break even. If it closed lower, then losses would accumulate twice as quickly:
    • The put holder would require you to buy the stock at the put exercise price of $65, $7.15 more than it would be worth
    • The call would expire worthless
    • The original stock would have declined from $72.20 to $57.85, a loss of $14.35
    • The loss on the stock and put together would equal $21.50, the original premiums you received for those options

Outside of my stock picks, I always like to make a few non-stock predictions for the year ahead.

7. The major election year will cause a substantial increase in advertising dollars spent

According to Advertising Analytics political spending has grown an average of 27% per year since 2012. Both the rise of Super PACs and the launch of online donation tools such as ActBlue have substantially contributed to this growth. While much of the spend is targeted at TV, online platforms have seen an increasing share of the dollars, especially Facebook and Google. The spend is primarily in even years, as those are the ones with senate, house and gubernatorial races (except for minor exceptions). Of course, every 4th year this is boosted by the added spend from presidential candidates. The Wall Street Journal projects the 2020 amount will be about $9.9 billion…up nearly 60% from the 2016 election year. It should be noted that the forecast was prior to Bloomberg entering the race and if he remains a viable candidate an additional $2 billion or more could be added to this total.

The portion targeted at the digital world is projected to be about $2.8 billion or about 2.2% of total digital ad spending. Much of these dollars will likely go to Facebook and Google. This spend has a dual impact: first it adds to the revenue of each platform in a direct way, but secondly it can also cause the cost of advertising on those platforms to rise for others as well.

8. Automation of Retail will continue to gain momentum

This will happen in multiple ways, including:

  1. More Brick & Mortar locations will offer some or all the SKUs in the store for online purchase through Kiosks (assisted by clerks/sales personnel). By doing this, merchants will be able to offer a larger variety of items, styles, sizes and colors than can be carried in any one outlet. In addition, the consolidation of inventory achieved in this manner will add efficiency to the business model. In the case of clothing, such stores will carry samples of items so the customer can try them on, partly to optimize fit but also to determine whether he or she likes the way it looks and feels on them. If one observes the massive use of Kiosks at airports it becomes obvious that they reduce the number of employees needed and can speed up checking in. One conclusion is this will be the wave of the future for multiple consumer-based industries.
  2. Many more locations will begin incorporating technology to eliminate the number of employees needed in their stores. Amazon will likely be a leader in this, but others will also provide ways to reduce the cost of ordering, picking goods, checking out and receiving information while at the store.

9. The Warriors will come back strong in the 2020/21 season

Let me begin by saying that this prediction is not being made because I have been so humbled by my miss in the July post where I predicted that the Warriors could edge into the 2020 playoffs and then contend for a title if Klay returned in late February/early March. Rather, it is based on analysis of their opportunity for next season and also an attempt to add a little fun to my Top Ten List!  The benefit of this season:

  • Klay and Curry are getting substantial time off after 5 seasons of heavy stress. They should be refreshed at the start of next season
  • Russell, assuming he doesn’t keep missing games with injuries, is learning the Warriors style of play
  • Because of the injuries to Klay, Curry, Looney, and to a lesser extent Green and Russell, several of the younger members of the team are getting experience at a much more rapid rate than would normally be possible and the Warriors are able to have more time to evaluate them as potential long-term assets
  • If the Warriors continue to lose at their current rate, they will be able to get a high draft choice for the first time since 2012 when they drafted Harrison Barnes with the 7th pick. Since then their highest pick has been between the 28th and 30th player chosen (30 is the lowest pick in the first round)
  • The Warriors will have more cap space available to sign a quality veteran
  • Andre Iguodala might re-sign with the team, and while this is not necessary for my prediction it would be great for him and for the team
  • The veterans should be hungry again after several years of almost being bored during the regular season

I am assuming the Warriors will be relatively healthy next season for this to occur.

10. At least one of the major Unicorns will be acquired by a larger player

In 2019, there was a change to the investing environment where most companies that did not show a hint of potential profitability had difficulty maintaining their market price. This was particularly true of highly touted Unicorns, which mostly struggled to increase their share price dramatically from the price each closed on the day of their IPO. Table 2 shows the 9 Unicorns whose IPOs we highlighted in our last post. Other than Beyond Meat, Zoom and Pinterest, they all appear some distance from turning a proforma profit. Five of the other six are below their price on the first day’s close. A 6th, Peloton, is slightly above the IPO price (and further above the first days close). Beyond Meat grew revenue 250% in its latest quarter and moved to profitability as well. Its stock jumped on the first day and is even higher today.  While Pinterest is showing an ability to be profitable it is still between the price of the IPO and its close on the first day of trading.  Zoom, which is one of our recommended buys, was profitable (on a Non-GAAP basis) and grew revenue 85% in its most recent quarter. A 10th player, WeWork, had such substantial losses that it was unable to have a successful IPO.

Table 2: Recent Unicorn IPOs Stock Price & Profitability Comparisons

Something that each of these companies have in common is that they are all growing revenue at 30% or more, are attacking large markets, and are either in the leadership position in that market or are one of two in such a position. Because of this I believe one or more of these (and comparable Unicorns) could be an interesting acquisition for a much larger company who is willing to help make them profitable. For such an acquirer their growth and leadership position could be quite attractive.

Recap of 2019 Top Ten Predictions

Bull Markets have Tended to Favor My Stock Picks

I entered 2019 with some trepidation as my favored stocks are high beta and if the bear market of the latter portion of 2018 continued, I wasn’t sure I would once again beat the market…it was a pretty close call last year. However, I felt the companies I liked would continue to grow their revenue and hoped the market would reward their performance. As it turns out, the 5 stocks I included in my top ten list each showed solid company performance and the market returned to the bull side. The average gain for the stocks was 45.7% (versus the S&P gain of 24.3%).

Before reviewing each of my top ten from last year, I would like to once again reveal long term performance of the stock pick portion of my top ten list. For my picks, I assume equal weighting for each stock in each year to come up with my performance and then compound the yearly gains (or losses) to provide my 6-year performance. For the S&P my source is Multpl.com.  I’m comparing the S&P index at January 2 of each year to determine annual performance.  My compound gain for the 6-year period is 499% which equates to an IRR of 34.8%. The S&P was up 78% during the same 6-year period, an IRR of 10.1%.

The 2019 Top Ten Predictions Recap

One of my New Year’s pledges was to be more humble, so I would like to point out that I wasn’t 10 for 10 on my picks. One of my 5 stocks slightly under-performed the market and one of my non-stock forecasts was a mixed bag. The miss on the non-stock side was the only forecast outside of tech, once again highlighting that I am much better off sticking to the sector I know best (good advice for readers as well). However, I believe I had a pretty solid year in my forecasts as my stock portfolio (5 of the picks) significantly outperformed the market, with two at approximately market performance and three having amazing performance with increases of 51% to 72%. Regarding the 5 non-stock predictions, 4 were right on target and the 5th was very mixed. As a quick reminder, my predictions were:

Stock Portfolio 2019 Picks:

  • Tesla stock will outpace the market (it closed last year at $333/share and opened this year at $310)
  • Facebook Stock will outpace the market (it closed last year at $131/share)
  • Amazon Stock will outpace the market (it opened the year at $1502/share)
  • Stitch Fix stock appreciation will outpace the market (it closed last year at $17/share)
  • DocuSign stock will outpace the market in 2019 (it is currently at $43/share and opened the year at $41)

5 Non-Stock Predictions:

  • Replacing cashiers with technology will be proven out in 2019
  • Replacing cooks, baristas, and waitstaff with robots will begin to be proven in 2019
  • Influencers will be increasingly utilized to directly drive commerce
  • The Cannabis Sector should show substantial gains in 2019
  • 2019 will be the year of the unicorn IPO

In the discussion below, I’ve listed in bold each of my ten predictions and give an evaluation of how I fared on each.

Tesla stock will outpace the market (it closed last year at $333/share and opened this year at $310)

Tesla proved to be a rocky ride through 2019 as detractors of the company created quite a bit of fear towards the middle of the year, driving the stock to a low of $177 in June. A sequence of good news followed, and the stock recovered and reached a high of $379 in front of the truck unveiling. I’m a very simplistic guy when I evaluate success as I use actual success as the measure as opposed to whether I would buy a product. Critics of the truck used Elon’s unsuccessful demonstration of the truck being “bulletproof” and the fact that it was missing mirrors and windshield wipers to criticize it. Since it is not expected to be production ready for about two years this is ridiculous! If the same critics applied a similar level of skepticism to the state of other planned competitive electric vehicles (some of which are two plus years away) one could conclude that none of them will be ready on time. I certainly think the various announced electric vehicles from others will all eventually ship, but do not expect them to match the Tesla battery and software capability given its 3 to 5-year lead. I said I’m a simple guy, so when I evaluate the truck, I look at the 250,000 pre-orders and notice it equates to over $12.5B in incremental revenue for the product! While many of these pre-orders will not convert, others likely will step in. To me that is strong indication that the truck will be an important contributor to Tesla growth once it goes into production.

Tesla stock recovered from the bad press surrounding the truck as orders for it mounted, the Chinese factory launch was on target and back order volume in the U.S. kept factories at maximum production.  Given a late year run the stock was up to $418 by year end, up 34.9% from the January opening price. But for continuing recommendations I use the prior year’s close as the benchmark (for measuring my performance) which places the gain at a lower 25.6% year over year as the January opening price was lower than the December 31 close. Either way this was a successful recommendation.

Facebook Stock will outpace the market (it closed last year at $131/share)

Facebook, like Tesla, has many critics regarding its stock. In 2018 this led to a 28% decline in the stock. The problem for the critics is that it keeps turning out very strong financial numbers and eventually the stock price has to recognize that. It appears that 2019 revenue will be up roughly 30% over 2018. After several quarters of extraordinary expenses, the company returned to “normal” earnings levels of about 35% of revenue in the September quarter. I expect Q4 to be at a similar or even stronger profit level as it is the seasonally strongest quarter of the year given the company’s ability to charge high Christmas season advertising rates. As a result, the stock has had a banner year increasing to $205/share at year-end up 57% over the prior year’s close making this pick one of my three major winners.

Amazon Stock will outpace the market (it opened the year at $1502/share)

Amazon had another very solid growth year and the stock kept pace with its growth. Revenue will be up about 20% over 2018 and gross margins remain in the 40% range. For Amazon, Q4 is a wildly seasonal quarter where revenue could jump by close to 30% sequentially. While the incremental revenue tends to have gross margins in the 25% – 30% range as it is heavily driven by ecommerce, the company could post a solid profit increase over Q3. The stock pretty much followed revenue growth, posting a 23% year over year gain closing the year at $1848 per share. I view this as another winner, but it slightly under-performed the S&P index.

Stitch Fix stock appreciation will outpace the market (it closed last year at $17/share)

Stitch Fix, unlike many of the recent IPO companies, has shown an ability to balance growth and earnings. In its fiscal year ending in July, year over year growth increased from 26% in FY 2018 to over 28% in FY 2019 (although without the extra week in Q4 of FY 2019 year over year growth would have been about the same as the prior year). For fiscal 2020, the company guidance is for 23% – 25% revenue growth after adjusting for the extra week in Q4 of FY 2019. On December 9th, Stitch Fix reported Q1 results that exceeded market expectations. The stock reacted well ending the year at $25.66 per share and the year over year gain in calendar 2019 moved to a stellar level of 51% over the 2018 closing price.

DocuSign stock will outpace the market in 2019 (it is currently at $43/share and opened the year at $41)

DocuSign continued to execute well throughout calendar 2019. On December 5th it reported 40% revenue growth in its October quarter, exceeding analyst expectations. Given this momentum, DocuSign stock was the largest gainer among our 5 picks at 72% for the year ending at just over $74 per share (since this was a new recommendation, I used the higher $43 price at the time of the post to measure performance). The company also gave evidence that it is reducing losses and not burning cash. Since ~95% of its revenue is subscription, the company is able to maintain close to 80% gross margin (on a proforma basis) and is well positioned to continue to drive growth. But, remember that growth declines for very high growth companies so I would expect somewhat slower growth than 40% in 2020.

Replacing cashiers with technology will be proven out in 2019

A year ago, I emphasized that Amazon was in the early experimental phase of its Go Stores which are essentially cashierless using technology to record purchases and to bill for them. The company now has opened or announced 21 of these stores. The pace is slower than I expected as Amazon is still optimizing the experience and lowering the cost of the technology. Now, according to Bloomberg, the company appears ready to:

  • Open larger format supermarkets using the technology
  • Increase the pace of adding smaller format locations
  • Begin licensing the technology to other retailers, replicating the strategy it deployed in rolling out Amazon Web Services to others

Replacing cooks, baristas, and waitstaff with robots will begin to be proven in 2019

The rise of the robots for replacing baristas, cooks and waitstaff did indeed accelerate in 2019. In the coffee arena, Briggo now has robots making coffee in 7 locations (soon to be in SFO and already in the Austin Airport), Café X robotic coffee makers are now in 3 locations, and there are even other robots making coffee in Russia (GBL Robotics), Australia (Aabak) and Japan (HIS Co). There is similar expansion of robotic pizza and burger cooks from players like Zume Pizza and Creator and numerous robots now serving food. This emerging trend has been proven to work. As the cost of robots decline and minimum wage rises there will be further expansion of this usage including franchise approaches that might start in 2020.

Influencers will be increasingly utilized to directly drive commerce

The use of influencers to drive commerce accelerated in 2019. Possibly the most important development in the arena was the April 2019 launch by Instagram of social commerce. Instagram now let’s influencers use the app to tag and sell products directly, that is, their posts can be “shoppable”. Part of the series of steps Instagram took was adding “checkout” which lets customers purchase products without leaving the walls of the app.

A second increase in the trend is for major influencers to own a portion of companies that depend on their influence to drive a large volume of traffic. In that way they can capture more of the value of their immense influence. Using this concept, Rihanna has become the wealthiest female musician in the world at an estimated net worth of $600 million. The vast majority of her wealth is from ownership in companies where she uses her influence to drive revenue. The two primary ones are Fenty Beauty and Fenty Maison. Fenty Beauty was launched in late 2017 and appears to be valued at over $3 billion. Rihanna owns 15% – do the math! Fenty Maison is a partnership between LVMH (the largest luxury brand owner) and Rihanna announced in May of 2019. It is targeting fashion products and marks the first time the luxury conglomerate has launched a fashion brand from scratch since 1987. Rihanna has more than 70 million followers on Instagram and this clearly establishes her as someone who can influence commerce.

The Cannabis Sector should show substantial gains in 2019

The accuracy of this forecast was a mixed bag as the key companies grew revenue at extremely high rates, but their stock valuations declined resulting in poor performance of the cannabis index (which I had said should be a barometer). A few examples of the performance of the largest public companies in the sector are shown in Table 2.

Table 2: Performance of Largest Public Cannabis Companies

*Note: Canopy last quarter was Sept 2019

In each case, the last reported quarter was calendar Q3. For Tilray, I subtracted the revenue from its acquisition of Manitoba Harvest so that the growth shown is organic growth. I consider this forecast a hit and a miss as I was correct regarding revenue (it was up an average of 282%) but the stocks did not follow suit, even modestly, as the average of the three was a decline of 54%. While my forecast was not for any individual company or stock in the sector, it was wrong regarding the stocks but right regarding company growth. The conclusion is humbling as I’m glad that I exercised constraint in not investing in a sector where I do not have solid knowledge of the way the stocks might perform.

2019 will be the year of the unicorn IPO

This proved true as many of the largest unicorns went public in 2019. Some of the most famous ones included on the list are: Beyond Meat, Chewy, Lyft, Peloton, Pinterest, Slack, The Real Real, Uber and Zoom. Of the 9 shown, four had initial valuations between $8 billion and $12 billion, two over $20 billion and Uber was the highest at an $82 billion valuation. Some unicorns found the public markets not as accepting of losses as the private market, with Lyft and Uber stock coming under considerable pressure and WeWork unable to find public buyers of its stock leading to a failed IPO and shakeup of company management. There is more to come in 2020 including another mega one: Airbnb.

2020 Predictions coming soon

Stay tuned for my top ten predictions for 2020…but please note that all 5 of the stocks recommended for 2019 will remain on the list.

Soundbyte

  • Before the basketball season began, I had a post predicting that the Warriors still had a reasonable chance to make the playoffs (if Klay returned in late February). Talk about feeling humble! I guess, counting this I had 3 misses on my predictions.

R&D: Amazon’s Dirty Little Secret Weapon


Why doesn’t Amazon produce more earnings given its dominance?

Amazon just reported earnings and, as was the case in 2017 and 2016, emphasized that 2019 will be an investment year, so the strong operating margin expansion of 2018 would be capped in 2019. This, of course, is great fodder for bears on the stock as Amazon gave sceptics renewed opportunity to point out that it is a company that has a flawed business model and would find it difficult to ever earn a reasonable return on revenue.

In contrast, I believe that Amazon continues to transform itself into a potential strong profit performer. For example, taking the longer perspective, Amazon’s gross margins are now over 40% up from 27.2% five years ago (2013). So why doesn’t Amazon deliver higher operating margin than the slightly over 6% it reported in 2018? Amazon’s dirty little secret is that it continues to invest heavily in creating future dominance through R&D. Had it spent a similar amount in R&D to its long time competitor, Walmart, EBITDA would have nearly tripled… to over 17% of revenue! I must confess that in the past I haven’t paid enough attention to how much Amazon spends on R&D. As a result, I was surprised that Apple and Microsoft trailed it in voice recognition technology and that Amazon could lead IBM and Microsoft in cloud technology. The reason this occurred is not a surprising one: Amazon outspends Apple, Microsoft and IBM in R&D.

In fact, Amazon now outspends every company in the world (see Table 1) and have been dedicating a larger portion of available dollars to R&D (as measured by the % of gross margin dollars spent on R&D) than any other large technology company, except Qualcomm, for more than 10 years. Even though Amazon had less than 50% of Apple’s revenue and less than 1/3 of its gross margin dollars 5 years ago (2013) Amazon spent nearly 50% more than Apple on R&D that year… by 2018 the gap had increased to close to 100% more.

Table 1: Top 10 (and a few more) U.S. R&D Spenders in 2018 ($Bn)

Sources: market watch, analyst reports, annual filings

Note 1: Ford and GM may be in the top 10 but so far have not reported R&D in 2018. If they report it at year end the table could change. Walmart does not report R&D and their spend is generally unavailable, but I found a reference that said they expected to spend $1.1M in 2017.

Note 2: A 2018 global list would include auto makers VW and Toyota (with R&D of $15.8B and about 10.0B), drug company Roche (&10.8B) and tech company Samsung at $15.3B in place of the lowest 4 in Table 1.

The Innovators Financial Dilemma: Increasing Future Prospects can lower Current Earnings

When I was on Wall Street covering Microsoft (and others) Bill Gates would often point out that the company was going to make large investments the following year so they could stay ahead of competition. He said he was less concerned with what that meant for earnings. That investment helped drive Microsoft to dominance by the late 1990s. Companies are often confronted with the dilemma of whether to increase spending to drive future growth or to maximize current earnings. I believe that investment in R&D, when effective, is correlated to future success.

It is interesting to see how leaders in R&D spending have transitioned over the past 10 years. In 2008 the global leaders in R&D spending included 5 pharma companies, 3 auto makers and only 2 tech companies (Nokia and Microsoft which subsequently merged). In 2018, 6 of the top 7 spenders (Samsung plus the 5 shown in Table 1) were technology companies.

Table 2 – 2008 global R&D leaders ($Bn)

Note: *Facebook data from 2009, first available financials from S-1 filing

It’s hard to change without tanking one’s stock

When a company has a business model that allocates 1% of gross margin dollars to R&D, it is not easy to turn on the dime. If Walmart had decided to invest half as much as Amazon in R&D in 2018, its earnings would have decreased by 80% – 90% and its stock would have depreciated substantially. So, instead it began a buying binge several years ago to try to close the technology gap through acquisitions (which has a much smaller impact on operating margins). It remains to be seen if this strategy will succeed going forward but in the past 5 years Walmart revenue (including acquisitions) increased only 5% while Amazon’s was up 130% in the same period (also including acquisitions).

Whatever Happened to IBM?

When I was growing up, I thought of IBM as the king of tech. In the early 1990s it still seemed to rule the roost. The biggest fear for Microsoft was that IBM could overwhelm it, yet now it appears to be an also ran in technology. From 2014 to 2018, a heyday era for tech companies, its revenue shrank from $93 billion in 2014 to $80 billion in 2018. I can’t tell how much of the problem stems from under investing in R&D versus poor execution, but for the past 5 years it has spent an average of about 13% of GM on R&D, while the 6 tech companies in Table 1 have averaged about 24% of GM dollars with Apple the only one under 20%.


Soundbytes

Soundbyte I: Tesla

  • I recently had a long dialogue with a very smart fund manager and was struck by what I believe to be misinformation he had read regarding Tesla. There were 3 major points that he had heard:
    • The quality of Tesla cars was shoddy
    • Tesla could not maintain reasonable margins as it began producing lower priced Model 3s
    • The upcoming influx of electric cars from companies like Porsche, Jaguar and Audi would take substantial market share away from Tesla

I decided to do a bit of research to determine how valid each of these issues might be.

  • Tesla Quality: I found it hard to believe that the majority of Tesla owners thought the car was of poor quality since every one of the 15 or so people I knew who had bought one had already bought another or were planning to for their next car. So, I found a report on customer satisfaction from Consumer Reports, and I was not surprised to find that Tesla was the number 1 ranked car by customer satisfaction.
  • Tesla margins: this is much harder to predict. Since Tesla is relatively young as a manufacturer it has had numerous issues with production. Yet it is probably ahead of many others when it comes to automating its facilities. This tends to cause gross margins to be lower while volume ramps and higher subsequently. The combination of that, plus moving up the learning curve, should mean that Tesla lowers the cost of producing its products. However, Tesla charges more for cars with higher capacity for distance, but as I understand it uses software to limit battery capacity for lower priced cars. This would mean that a portion of the difference between a lower priced Model 3 and a higher priced one (the battery capacity) would be minimal change in cost, putting pressure on margins. The question becomes whether Tesla’s improving cost efficiencies offset the average price decline of a Model 3 as Tesla begins fulfilling demand for lower priced versions.
  • March 1 Update: After this post was complete (Thursday February 28) the company announced it was closing many showrooms to reduce costs. Then late today (Friday) announced that the $35,000 version of the model 3 is now available. So, we shall soon see the impact. I believe that if Tesla has increased capacity there will be very strong sales. It also likely will experience lower gross margin percentages as it climbs the learning curve and ramps production.
  • Will the influx of electric cars from others impact Tesla market share?


  1. Porsche is an electric sports car starting at $90K – at that price point it is competitive with model S not model 3. In competing with the S it comes down to whether one prefers a sports car to a sedan. I have owned a Porsche in the past and would only consider it if I wanted a sports car with limited seating capacity (but very cool). I loved my Porsche but decided to switch to sedans going forward. Since then I’ve owned only sedans for the past 10+ years. It also appears that early production is almost a year away, so it is unlikely to be competitive for 2019.
  2. Audi is at price points that do compete with the Model 3 and expects to start delivering cars in March. However, I think that is mainly in Europe where Tesla is an emerging brand so it might not impact them at all. When I look at the Audi models I don’t think they will appeal to Tesla buyers as they are very old-line designs (I would call them ugly). The range of the cars on a charge is not yet official but seems likely to be much lower than Tesla which has a big lead in battery technology.
  3. The Jaguar competes with the Tesla Model X but while cheaper, appears a weak competitor.


I don’t want to dismiss the fact that traditional players will be introducing a large number of electronic vehicles. The question really is whether the market size for electric cars is a fixed portion of all cars or whether it will become a much larger part of the entire market over time. I would compare this to fears that analysts had when Lotus and Wordperfect created Windows versions. They felt that Microsoft would lose share of windows spreadsheets and word processors. I agreed but pointed out that Windows was 10% of the entire market for spreadsheets, so having a 90% share gave Microsoft 9% of the overall spreadsheet market. I also predicted Microsoft would have over a 45% share when Windows was 100% of the market. So, while this would decrease Microsoft’s share of Windows spreadsheets, it would grow its total share of the market by 5X Of course we all were proven wrong as Microsoft eventually reached over 90% of the entire market.

For Tesla, the question becomes whether these rivals are helping accelerate the share electric cars will have of the overall market, rather than eroding Tesla volumes. I’m thinking that it’s the former, and that Tesla will have a great volume year in 2019 and that its biggest competitive issue will be whether the Model 3 is so strong that it will get people to buy it over the Model S. Of course, I could be wrong, but believe the odds favor Tesla in 2019, especially the first half of the year where the competitors are not that strong.

Soundbyte II: The NYC / Amazon Deal Collapses

I never cease to be amazed at how little regard some Politicians have for facts. I should likely not have been surprised by the furor created over Amazon locating a major facility in New York City. I thought the $44 billion or more in benefits to the City and State and massive job creation were such a win that no one would contest it. Instead, the dialog centered around the $ 3 billion in tax benefits to Amazon. All but 1/6 of the benefits (which was cash from the state) were based on existing laws and amounted to a reduction of future taxes rather than upfront cash. What a loss for the City.

2019 Top Ten Predictions

Opportunity Knocks!

The 2018 December selloff provides buying opportunity

One person’s loss is another’s gain. The market contraction in the last quarter of the year means that most stocks are at much lower prices than they were in Q3 of 2018. The 5 stocks that I’m recommending (and already own) were down considerably from their Q3 2018 highs. While this may be wishful thinking, returning to those highs by the end of 2019 would provide an average gain of 78%. Each of the 5 had revenue growth of 25% or more last year (and 3 were over 35%) and each is poised for another strong year in 2019.

For the 4 continued recommendations (all of which I mentioned I would recommend again in my last post), I’ll compare closing price on December 31, 2019 to the close on December 31, 2018 for calculating performance. For the new add to my list, I’ll use the stock price as I write this post. I won’t attempt to predict the overall market again (I’m just not that good at it) but feel that the 14% drop in Q4 means there is a better chance that it won’t take a nosedive. However, since stock picks are always relative to the market, success is based on whether my picks, on average, outperform the market.

I’ll start the post with stock picks and then follow with the remaining 5 predictions.

 2019 Stocks  

Tesla stock will outpace the market (it closed last year at $333/share and is essentially the same as I write this)

In Q3, 2018 the Tesla model 3 was the bestselling car in the U.S. in terms of revenue and 5th highest by volume. This drove a 129% revenue increase versus a year earlier and $1.75 in earnings per share versus a loss of $4.22 in the prior quarter. I expect Q4 revenue to increase sequentially and growth year/year to exceed 100%. In Q3, Tesla reported that nearly half of vehicles traded in for the Model 3 were originally priced below $35,000. As Tesla begins offering sub-$40,000 versions of it, demand should include many buyers from this high-volume price range. Since the backlog for the Model 3 is about 300,000 units I expect 2019 sales to remain supply constrained if Tesla can offer lower price points (it already has announced a $2,000 price reduction). The important caveat to demand is that tax credits will be cut in H1 2019, from $7500 to $3750 and then cut again to $1875 in the second half of the year. Part of Tesla’s rationale for a $2000 price drop is to substantially offset the initial reduction of these tax credits.

Tesla began taking orders for its Q1 launch in Europe where demand over time could replicate that in the U.S. The average price of a Model 3 will initially be about $10,000 higher than in the U.S. Tesla is also building a major manufacturing facility in China (where Model 3 prices are currently over $20,000 higher than the U.S.). This Giga-Factory is expected to begin production in the latter half of 2019. While moving production to China for vehicles sold there should eliminate trade war issues, Tesla still expects to begin delivering Model 3s to Chinese customers in March.

The combination of a large backlog, reducing prices within the U.S. and launches in Europe and China should generate strong growth in 2019. Some investors fear price reductions might lead to lower gross margins. When I followed PC stocks on Wall Street, this was a constant question. My answer is the same as what proved true there: strong opportunity for continuous cost reduction should enable gross margins to remain in the 20-25% range in any location that is at volume production. So, perhaps the Chinese Giga-Factory and a future European factory will start at lower margins while volume ramps but expect margins in the U.S. (the bulk of revenue in 2019) to remain in the targeted range. Higher prices in Europe and China due to massive initial demand allows premium pricing which may keep margins close to 20%+ in each.

Facebook stock will outpace the market (it closed last year at $131/share).

Facebook underperformed in 2018, closing the year down 28% despite revenue growth that should be 35% to 40% and EPS tracking to about 36% growth (despite a massive increase in SG&A to spur future results).  The stock reacted to the plethora of criticism regarding privacy of user information coupled with the continuing charges of Russian use of Facebook to impact the election. Before the wave of negative publicity, Facebook reached a high of $218/share in July. Facebook is likely to continue to increase its spending to address privacy issues and to burnish its image. However, scaling revenue could mean it keeps operating margins at a comparable level to 2018 rather than increasing them. Rumors of Facebook’s demise seem highly exaggerated!  According to a December 2018 JP Morgan survey of U.S. Internet users, the three most used social media products were Facebook (88% of participants), Facebook Messenger (61%) and Instagram (47%). Also, 82% of those surveyed picked a Facebook-owned platform as being the most important to them. Finally, the average Facebook user reported checking Facebook roughly 5 times per day with 56% of users spending 15 minutes to an hour or more on the platform on an average day. While Facebook has experienced a minor decrease in overall usage, Instagram usage has increased dramatically. Facebook, Instagram, and WhatsApp together give the company a growing and dominant position.

At the beginning of 2018 Facebook stock was trading at 34 times trailing EPS. By the end of the year the multiple of trailing EPS was below 18. If I assume EPS can grow 20%+ in 2019 (which is below my expectation but higher than the consensus forecast) than a multiple of 20 would put the stock at about $180/share by December 31. If it grew EPS, more in line with revenue and/or returned to a multiple closer to 34 it could reach well over 200.

Two key factors:

  1. A 20% increase in revenue (I expect the increase to be about 30%) adds over $11 billion in revenue. A comparable 20% increase in SG&A would provide over $4 billion in additional money to spend, affording the company ample dollars to devote to incremental marketing without impacting operating margins.
  2. Given the “low” stock price, Facebook increased its buyback program by $9 billion to $15 billion. Since it generates $6B – $7B in cash per quarter from operations (before capex) and has roughly $40 billion in cash and equivalents it could easily increase this further if the stock remains weak. The $15 billion could reduce the share count by as much as 3% in turn increasing EPS by a similar amount.

Amazon stock will outpace the market (it closed last year at $1502/share).

While its stock dropped from its September high of $2050, Amazon remained one of the best market performers in 2018 closing the year at $1502/share. At its 2018 high of $2050, It may have gotten ahead of itself, but at year end it was up less than 2018 revenue growth. Leveraging increased scale meant net income grew faster than revenue and is likely to triple from 2017. Growth will be lower in Q4 then Q3 as Q4 2017 was the first quarter that included all revenue from Whole Foods. Still, I would not be surprised if Amazon beat expectations in Q4 since this is already factored into analyst forecasts. Amazon trades on revenue coupled with the prospect of increasingly mining the revenue into higher profits. But the company will always prioritize making long term investments over maximizing near term earnings. Growth in the core ecommerce business is likely to gradually slow, but Amazon has created numerous revenue streams like its cloud and echo/Alexa businesses that I expect to result in maintaining revenue growth in the 20% plus range in 2019. The prospect of competing with an efficient new brick and mortar offering (see prediction 6 in this post) could drive new excitement around the stock.

Profitability in 2019 could be reduced by: announced salary increases to low end workers; increasing the number of physical store locations; and greater marketing incentives for customers. Offsets to this include higher growth in stronger margin businesses like AWS and subscription services. The stock may gyrate a bit, but I expect it to continue to outperform.

Stitch Fix stock will outpace the market (it closed last year at $17/share).

In my 2018 forecast I called this my riskiest pick and it was the most volatile which is saying a lot given the turbulence experience by Facebook, Tesla, and Amazon. I was feeling pretty smug when the stock reached a high of $52/share in September! I’m not sure how much of the subsequent drop was due to VCs and other early investors reducing their positions but this can have an impact on newly minted public companies. Whatever the case, the stock dropped from September’s high to a low point of $17.09 by year’s end. The drop was despite the company doing a good job balancing growth and profitability with October quarter revenue up 24% and earnings at $10.7 million up from $1.3 million in the prior year. Both beat analyst expectations. The stock was impacted because the number of users grew 22% (1-2% less than expected) despite revenue exceeding expectations at 24% growth. I’m not sure why this was an issue.

Stitch Fix continues to add higher-end brands and to increase its reach into men, plus sizes and kids. Its algorithms to personalize each box of clothes it ships keeps improving. Therefore, the company can spend less on acquiring new customers as it has increased its ability to get existing customers to spend more and come back more often. I believe the company can grow by roughly 20% or more in 2019. If it does and achieves anything close to the revenue multiple that it started with in 2018 (before the multiple doubled in mid-year), there would be a sizeable stock gain this year. But it is a thinly traded stock and likely to be quite volatile.

Docusign Stock will outpace the market in 2019 (it is currently at $43/share).

Docusign is a new recommendation. Like Stitch Fix, it is a recent IPO and could be volatile. Docusign is the runaway leader in e-signatures, facilitating multiple parties signing documents in a secure, reliable way on board resolutions, mortgages, investment documents, etc. Strong positives include:

  • A high value for a reasonable price – I am increasingly annoyed when I need to deal with manual signatures for documents.
  • As of October 31, 2018, Docusign had over 450,000 customers up from 350,000 customers one year earlier. Of which 50,000 are Enterprise/Commercial accounts;
  • There are hundreds of millions of users whose e-signatures are stored by the company making the network effect quite large;
  • Roughly 95% of revenue is from its SaaS product which has 80% gross margin with the rest from services where margins have improved and are now positive;
  • As a SaaS company with a stable revenue base growth is more predictable. The company exceeded revenue guidance each quarter with the October 31, 2018 quarter revenue up 37%;
  • Most customers pay annually in advance. This means cash flow from operations is positive despite the company recording an operating loss;
  • Customers expand their use resulting in retained customers growing revenue faster than decreases from churned customers making net revenue retention over 100%;
  • International expansion remains a large opportunity as international is only 18% of revenue.

Picks 6 – 10: Major Trends that will surface in 2019

I developed my primary method of stock picking at my first Wall Street firm, Stanford Bernstein. The head of research there, Chuck Cahn, emphasized that you could get small wins by correctly determining that a stock would trade up on certain news like a new product, a big customer win, and beating consensus forecasts. But larger and more predictable wins of 5X or more were possible if one identified a long-term winner riding a major trend and stuck with it for multiple years. All 5 of my stock picks fall into the latter category. I’ve been recommending Facebook, Tesla, and Amazon for 4 years or more. All 3 are now over 5X from when I first targeted them as I bought Tesla at $46 and Facebook at $24 in 2013 (before this blog) and they have been in my top 10 since. Amazon was first included in 2015 when it was at $288/share. Stitch Fix and DocuSign are riskier but if successful have substantial upside since both are early in their run of leveraging their key trends.

The next 4 picks are in early stages of trends that could lead to current and next generation companies experiencing benefits for many years. The first two go hand in hand as each describes transformation of physical retail/restaurants, namely, replacing staff with technology in a way that improves the customer experience. This is possible because we are getting closer to the tipping point where the front-end investment in technology can have a solid ROI from subsequent cost savings.

Replacing Cashiers with technology will be proven out in 2019

In October 2015 I predicted that Amazon (and others like Warby Parker) would move into physical retail between then and 2020. This has occurred with Amazon first opening bookstores and then buying Whole Foods, and Warby Parker expanding its number of physical locations to about 100 by the end of 2018. My reasoning then was simple: over 92% of purchases in the U.S. were made offline. Since Amazon had substantial share of e-commerce it would begin to have its growth limited if it didn’t create an off-line presence.

Now, for Amazon to maintain a 20% or greater revenue growth rate it’s even more important for it to increase its attack on offline commerce (now about 90% of U.S. retail) I’m not saying it won’t continue to try to increase its 50% share of online but at its current size offline offers a greater opportunity for growth.

A key to Amazon’s success has been its ability to attack new markets in ways that give it a competitive advantage. Examples of this are numerous but three of the most striking are Amazon Cloud Services (where it is the industry leader), the Kindle (allowing it to own 70% share of eBook sales) and Prime (converting millions of customers to a subscription which in turn incentivized buying more from Amazon due to free shipping).

Now the company is testing an effort to transform brick and mortar retail by replacing staff with technology and in doing so improving the buying experience. The format is called Go stores and there are currently 5 test locations. Downloading the Amazon Go App enables the user to use it to open the automated doors. The store is stocked (I think by actual people) with many of the same categories of products as a 7-Eleven, in a more modern way. Food items include La Boulangerie pastries, sushi, salads, an assortment of sandwiches and even meal kits. Like a 7-Eleven, it also has convenience items like cold medicine, aspirins, etc. The store uses cameras and sensors to track your movements, items you remove from the shelves and even whether you put an item back. When you leave, the app provides you with a digital receipt. Not only does the removal of cashiers save Amazon money but the system improves customer service by eliminating any need to wait in line. I expect Amazon to open thousands of these stores over the next 3-5 years as it perfects the concept. In the future I believe it will have locations that offer different types of inventory. While Amazon may be an early experimenter here, there is opportunity for others to offer similar locations relying on third party technology.

Replacing Cooks, Baristas and Waitstaff with robots will begin to be proven in 2019

The second step in reducing physical location staff will accelerate in 2019. There are already:

  1. Robotic coffee bars:  CafeX opened in San Francisco last year, and in them one orders drip coffee, cappuccino, latte, or hot chocolate using an app on your phone or an iPad available at a kiosk. The coffee is made and served by a robot “barista” with the charge automatically put on your credit card. Ordering, billing, and preparation are automatic, but there is still one staff member in the shop to make sure things go smoothly.
  2. The first robotic burger restaurant: Creator opened in San Francisco last June. It was in beta mode through September before opening to the general public. While a “robot” makes the burgers, Creator is not as automated as CafeX as humans prepare the sauces and prep the items that go into the machine. Creator also hasn’t automated ordering/payment. Startup Momentum Machines expects to open a robotic burger restaurant and has gotten substantial backing from well-known VCs.
  3. Robots replacing waitstaff: For example, at Robo Sushi in Toronto, a “Butlertron” escorts you to your table, you order via an iPad and a second robot delivers your meal. Unlike the robots in the coffee bar and burger restaurant these are made into cute characters rather than a machine. Several Japanese companies are investing in robotic machines that make several of the items offered at a sushi restaurant.
  4. Robotic Pizza restaurants: The furthest along in automation is the Pizza industry. Zume Pizza, a startup that uses robots to make pizzas, has recently received a $375 million investment from Softbank. Zume currently uses a mix of humans and robots to create and deliver their pizzas and is operational in the Bay Area. Pizza Hut and Dominos are working on drones and/or self-driving vehicles to deliver pizzas. And Little Caesars was just issued a patent for a robotic arm and other automated mechanisms used to create a pizza.

At CES, a robot that makes breads was announced. What all these have in common is replacing low end high turnover employees with technology for repetitive tasks. The cost of labor continues to rise while the cost of technology shrinks a la Moore’s Law. It is just a matter of time before these early experiments turn into a flood of change. I expect many of these experiments will turn into “proof points” in 2019. Successful experiments will generate substantial adoption in subsequent years. Opportunities exist to invest in both suppliers and users of many robotic technologies.

“Influencers” will be increasingly utilized to directly drive Commerce

Companies have long employed Influencers as spokespersons for products and in some cases even as brands (a la Michael Jordon and Stephan Curry basketball shoes or George Forman Grills). They appear on TV ads for products and sometimes used their social reach to tout them. Blogger, a prior Azure investment, understood how to use popular bloggers in advertising campaigns. But Blogger ads, like most TV ads did not directly offer the products to potential customers. Now we are on the verge of two major changes: tech players creating structured ways to enable fans of major influencers (with millions of followers) to use one-click to directly buy products; and technology companies that can economically harness the cumulative power of hundreds of micro-influencers (tens of thousands of fans) to replicate the reach of a major influencer. I expect to see strong growth in this method of Social Commerce this year.

The Cannabis Sector should show substantial gains in 2019

In my last post I said about the Cannabis Sector: “The industry remains at a very early stage, but numerous companies are now public, and the recent market correction has the shares of most of these at more reasonable levels. While I urge great care in stock selection, it appears that the industry has emerged as one to consider investing in.” Earlier in this post, I mentioned that riding a multi-year wave with a winning company in that segment is a way to have strong returns. I’m not knowledgeable enough regarding public Cannabis companies, so I haven’t included any among my stock recommendations. However, I expect industry wide revenue to grow exponentially. The 12 largest public Cannabis companies by descending market cap are: Canopy Growth Corp (the largest at over $11B), Tilray, Aurora Cannabis, GW Pharmaceuticals, Curealeaf Holdings, Aphria, Green Thumb Industries, Cronos Group, Medmen Enterprises, Acreage Holdings, Charlotte’s Web Holdings and Trulieve Cannabis.

I believe one or more of these will deliver major returns over the next 5 years. Last year I felt we would see good fundamentals from the industry but that stocks were inflated. Given that the North American Cannabis Index opened this year at 208 well down from its 2018 high of 386 investing now seems timely. I’ll use this index as the measure of performance of this pick.

2019 will be the Year of the Unicorn IPO

Many Unicorns went public in 2018, but this year is poised to be considerably larger and could drive the largest IPO market fund raising in at least 5 years.  Disbelievers will say: “the market is way down so companies should wait longer.” The reality is the Nasdaq is off from its all-time high in August by about 15% but is higher than its highest level at any time before 2018. Investment funds are looking for new high growth companies to invest in. It appears very likely that as many as 5 mega-players will go public this year if the market doesn’t trade off from here. Each of them is a huge brand that should have very strong individual support. Institutional investors may not be as optimistic if they are priced too high due to the prices private investors have previously paid. They are: Uber, Lyft, Airbnb, Pinterest, and Slack. Each is one of the dominant participants in a major wave, foreshadowing substantial future revenue growth. Because information has been relatively private, I have less knowledge of their business models so can’t comment on whether I would be a buyer. Assuming several of these have successful IPOs many of the other 300 or so Unicorns may rush to follow.

It will be an interesting year!

Recap of 2018 Top Ten Predictions

Have the bears finally won back control?

Oh, what a difference a month or 3 makes! If only 2018 had ended earlier…

I’m sure I’m not the only one who would have liked 2018 results to have been as of November 30th (or even better, October 1st). My stock forecasts were looking a lot better on those dates (and if I were smarter, perhaps I would have taken some of the gains at that point). My average gain was over 34% on October 1st (versus the S&P being up 8.5%) and was still holding at +10% as of November 30th with the S&P ahead 2.4%. Unfortunately, the year includes a disastrous December and my 4 stock picks ended the year at a 6.6% average loss. Since stock picks are always relative to the market, I take some solace in minutely beating the performance of the S&P which was down 7.0% for the year, especially since I favor very high beta stocks.

Before reviewing each of my picks from last year, I would like to provide a longer term view of my performance as it has now been 5 years that I’ve published my blog’s stock picks. Even with a down year in 2018 my compound gain is 310% versus an S&P gain of 38% over the same period. This translates to an average annual gain of 25% per year which coincidently is the target I set in my book (published years ago and now out of print).

Table 1: Mike’s Annual Blog Stock Pick Performance (5 Years)

Unlike last year, I certainly cannot take a victory lap for my 10 forecasts as I missed on 3 of the 10 and barely beat the S&P for my average among my 4 stock picks (all of which will be included again in my 2019 top ten). I’ve listed in bold each of my 2018 stock picks and trend forecasts below and give a personal, and only modestly biased, evaluation of how I fared on each.

  1. Tesla stock appreciation will continue to outpace the market (it opened the year at $312/share)

Tesla had an extraordinary Q3, 2018 as the model 3 launch showed how potent a player the company is becoming. In the quarter the Model 3 was the best selling car in the U.S. in terms of revenue and 5th highest by volume. This drove a greater than 100% revenue increase versus a year earlier and $1.75 in earnings per share versus a loss of $4.22 in the prior quarter. Given that the starting price for a model 3 was at $49,000, it is rather amazing that it could generate that volume of sales. Since the backlog for the Model 3 appears to remain at well over 300,000 cars and Tesla is closing in on a launch in Europe, Tesla seems assured of continued strong revenue through 2019 and likely beyond. However, much of the backlog is awaiting the lower priced (sub $40,000) version of the car which I believe will be available in Q2, 2019. As I had predicted, the Model 3 ramp up in production volume led to improved gross margins which exceeded 20% in the quarter. Despite the down market, Tesla stock was up about 7% in 2018. While we will continue recommending the stock, the phaseout of tax credits for buying an electric car has already begun. In its Q3 update Tesla stated that “better than expected Model 3 cost reductions is allowing us to bring more affordable options to the market sooner.” Yet, despite this forecast, the recently announced price decreases drove the stock down.

  1. Facebook stock appreciation will continue to outpace the market (it opened the year at $182/share).

Facebook stock did not perform well in 2018, closing the year down 28%, making this pick a losing proposition last year. This comes despite revenue growth that should be between 35% and 40%, and net income that is tracking towards about 35% growth (despite a massive increase in SG&A to spur future results).  What impacted the stock heavily was the plethora of criticism regarding privacy of user information coupled with the continuing charges of Russian usage to impact the election. Before the wave after wave of negative publicity the stock had reached a new high of $218/share in July. Because of the need to improve its reputation, Facebook is likely to continue to increase its spending to address privacy issues and to burnish its image. In summary, the fundamentals of the company remained quite sound in 2018 but the barrage of issues torpedoed the stock.

  1. Amazon stock appreciation will outpace the market (it opened the year at $1188/share).

While its stock dropped considerably from its September high of $2050, Amazon remained one of the best market performers in 2018 closing the year at over $1500/share. The company continued to execute well, growing every part of its business. It also began to leverage its scale as net income grew considerably faster than revenue and is likely to be well over triple that of 2017. Growth should be lower in Q4 2018 than earlier in the year as Q4 2017 was the first quarter that included all revenue from the acquisition of Whole Foods. Since the analyst consensus forecast already reflects Whole Foods revenue being in Q4 last year, as well as concerns over Amazon maintaining strong performance in Q4, I would not be surprised if Amazon was able to beat expectations in Q4.

  1. Stitch Fix stock appreciation will outpace the market (it opened the year at $25/share).

In my forecast I stated that this was my riskiest pick and it certainly proved the most volatile (which is saying a lot given the turbulence experience by Facebook, Tesla, and Amazon). I was feeling pretty smug when the stock reached a high of $52/share in September with a little over 3 months left in the year! Obviously, I was less sanguine as it dropped precipitously from September’s high to a low point of $17.09 by year’s end. I’m hoping that those of you who followed my advice trimmed back when the stock soared (I confess that I didn’t). The company continued to balance growth and profitability throughout the calendar year with October quarter revenue (up 24%) and earnings ($10.7 million up from $1.3 million in the prior year) both beating analyst expectations. Yet, concerns over user growth severely impacted the stock. I’m somewhat surprised by this as the users grew 22% and revenue 24% – since revenue beat expectations this means that analysts did not forecast an increase in average revenue per user. But the bottom line is, despite solid fundamentals the stock did not perform well.

  1. The stock market will rise in 2018 (the S&P opened the year at 2,696 on January 2).

When I made this forecast, I pointed out that I’m not particularly good at forecasting the overall market. My belief was based on the fact that the tax cut for corporations would mean a rise in earnings that exceeded the norm. I felt stronger earnings growth would be enough to offset the risk of the longest bull market in history turning negative. I sited the likelihood of higher interest rates being an additional risk. The market almost made it through the year as it was still up heading into December, but the combination of 4 interest rate hikes in the year coupled with considerable criticism of President Trumps behavior was just too much for the market by December. I view this as a partial victory as I had all the fundamentals right and came within less than a month of being right for the year when many felt the bears would gain control in early 2018.

  1. Battles between the federal government and states will continue over marijuana use but the cannabis industry will emerge as one to invest in.

During the year the legalization of marijuana for recreational use continued to increase on a state by state basis with the number increasing from 6 at the start of the year to 10 by years end. Use of medical marijuana is now legal in 33 states. Several other states, while not formally legalizing it have lowered restrictions on individual use. The industry remains at a very early stage, but numerous companies are now public, and the recent market correction has the shares of most of these at more reasonable levels. While I would urge great care in stock selection, it appears that the industry has emerged as one to consider investing in.

  1. At least one city will announce a new approach to urban transport.

In this prediction I cited the likelihood that at least one city would commit to testing a system of small footprint automated cars on a dedicated route (as discussed in our post on December 14, 2017) as this appears to be a more cost effective solution than rail, bus, Uber, etc. Kyoto has now announced that it signed an agreement to test the system offered by Wayfarer and the company is now out of stealth mode. Wayfarer expects to provide substantial capacity at a fraction of the cost of other alternatives: both in the initial cost of the infrastructure/equipment and the annual cost of running the system. Of course, once there is a live installation in Kyoto or one of their other prospective customers, the validity of this system will be authenticated (or not).

  1. Offline retailers will increase the velocity of moving towards omnichannel.

This forecast discussed both acquisitions of e-commerce companies by offline retailers (with Walmart leading the way) and introducing more online technology in physical stores. Walmart did continue its online buying spree in 2018 with major acquisitions of Art.com, Bare Necessities, Eloquii, Cornershop and Flipkart (the largest at $16 billion). In the case of the acquisitions that are online brands, Walmart intends to introduce these into their physical stores and continue to sell them online. Nordstrom has also moved further to integrate its online and offline business by taking valuable floor space in stores and repurposing it for online buyers to pick up and try on clothes they have purchased online. By placing the location in a very prominent spot, I’m sure Nordstrom is thinking it will help spur more customers to buy online. By having in store locations for picking up and trying on, Nordstrom should reduce returns, lower the cost of shipping, and bring additional customers into their stores (who otherwise might not visit them).

  1. Social Commerce will begin to emerge as a new category

Recall that social commerce involves the integration of social media with commerce through tactics like:

  1. A feed-based user experience
  2. Having friends’ actions impact one’s feed
  3. Following trend setters to see what they are buying, wearing, and/or favoring
  4. One click to buy

Now, about 25% – 30% of shoppers say that social platforms like Pinterest, Instagram, Facebook and Snapchat have influence over their purchases. On June 28, 2018 Snapchat began a program for its influencers to use Social Commerce through a tool that allows users to view a video from the influencer and then to swipe up on a product shown in the video to buy it. In September, The Verge reported that Instagram is developing a new app for social commerce. Pinterest and Facebook have been in the social commerce fray longer and have increasing success. It appears that 2018 was the year the social commerce wars accelerated.

  1. “The Empire Strikes Back”: automobile manufacturers will begin to take steps to reclaim use of its GPS.

Carmakers face a serious problem regarding their built-in navigation systems. Consumers are forced to pay hundreds of dollars for them and then use free apps on their phones like Waze or Google maps instead. This does not endear them to consumers. The problem is that carmakers are not great at software design but have been reluctant to use third party providers for their GPS and entertainment. Now, the Renault-Nissan-Mitsubishi Alliance has agreed to design Google’s Android OS, including Google navigation, into their next generation cars expected starting in 2021. This is a win for users as that will provide a competent GPS that utilizes the existing screen in cars as opposed to having to rely on your phone app for navigation.

In another win for consumers, Amazon and Telenav (a connected car and location based services provider) announced a significant partnership today, January 7, 2019. As part of it, Amazon’s voice assistant will now be part of Telenavs in-car navigation systems. With this included, Telenav’s next generation system will enable its customers, like General Motors, to provide a “smart assistant” thereby making the system included with cars the one to use rather than one’s phone apps.

Stay tuned for my top ten predictions for 2019…but remember that I have already said the 4 stocks recommended for 2018 will remain on the list.

Amazon HQ Award: Huge Positive for New York City and State

My December 2016 post analyzed the Trump deal to retain Carrier workers in the United States and concluded it was positive for the country and for the state of Indiana. It saved 800 jobs and had a payback to the government of more than 14X their investment. I was clear in the post that I hadn’t voted for Trump and consider myself an independent. While I remain an independent, the opportunity to analyze the recently announced deal to get Amazon to commit 25,000 – 40,000 jobs for New York City is irresistible to me as my conclusions will be in support of politicians on the opposite side of the spectrum from Trump: New York Mayor Bill de Blasio and Governor Andrew Cuomo. I believe that:

Analysis of benefits and drawbacks of any major negotiation should be politically independent.

Unfortunately, this has become less and less the case given the divisive politics that we have in our country. What was shocking to me in this case was that some members of their own party (Democrats), heavily criticized de Blasio and Cuomo.

Major Assumption: Jobs are good for a City/State if the cost to government is reasonable

One of the major responsibilities of a political leader is improving the economy in their State/City. The crux of the discussion is really the question: ‘what is a reasonable cost’ for doing so? On one hand, it can be measured in pure cash flow of moneys paid to Amazon (or any other entity a government wants to attract) versus the cash the government will receive from additional tax dollars. On the other hand, there are other factors that benefit or degrade life in the community. Since the former is more measurable, I’ll start with that.

What are the Actual Out-of-Pocket dollars New York City (NYC) and New York State (NYS) will give to Amazon?

I can’t tell if its rhetoric or a lack of clear communication, but many detractors, like state Senator Michael Gianaris, are saying “We’ve got $3 billion dollars to spend, how would you spend it? Amazon would be very low on the list of where that money would go.” To be blunt, this is a ridiculous comment. NYC is spending zero dollars in cash and while the state is providing $505 million of actual cash as a capital grant, far more money will flow back to it. The Capital grant is based on $2.5 billion that Amazon has promised to invest in New York City (to build their HQ, a 600-seat public school, affordable space for manufacturers and to develop a 3.5-acre waterfront esplanade and park).

The rest of the $3 billion falls into 3 incentive programs that have existed for many years to help woo companies to NYS. They are:

  1. The Excelsior Jobs Program was created in 2010 to replace the expiring Empire Zone Program. Like the prior program, it’s objectives are to provide job creation incentives to firms in targeted industries, like high-tech, for relocating in NYS. The credits are based on the wages added and several other factors. This program, which is available to all companies in the targeted sectors, will generate $1.2 billion in state business income tax credits for Amazon if it meets its commitments.
  2. The Relocation and Employment Assistance Program (REAP), first established in 2003, targets creating jobs in parts of the city more in need of them, rather than adding to the heavy cluster in downtown and midtown Manhattan, namely the outer boroughs or north of 96th street in Manhattan. The tax credits generated from this program total $897 million and can be used towards reducing Amazon’s New York City corporate taxes over 12 years. This credit is based on the rules of the existing law.
  3. The Industrial and Commercial Abatement Program (ICAP), which replaced a prior program, created in 2008, provides tax incentives for commercial and industrial buildings that are built, modernized, or expanded. The credits are based on the taxable value created if the city believes it is beneficial based on its location and other factors. This program is generally available and the $386 million in credits are directly tied to the rules of the law.

Table 1: Benefits to Amazon from NYS and NYC

It is important to note most of the benefits to Amazon are “as of right”, so any company can get them. Since these programs scale based on the number of employees or the amount of capital investment, the sheer size of the Amazon commitment creates a “sticker shock” given the associated benefits. The 3 programs were not created for Amazon but have been in existence for years to encourage job creation and industrial development in targeted areas. The credits under REAP and ICAP appear to be as mandated by those programs and not discretionary. It’s harder for me to tie the state tax abatement amount granted under the Excelsior program (by the state) to the law, but the calculation appears to follow it with some judgement in the cap of what is awarded. The capital grant seems to be the only discretionary part of the package and is the only portion that involves out of pocket dollars from the state (the city will not provide any cash incentives).

Could New York Have won the HQ with lesser incentives?

Given the large return on investment to NYC and NYS, the only question in my mind is whether they could have succeeded with even less incentives and generated an even greater return! A whitepaper by Reis, an analytic company for real estate evaluation, judged New York City as a top candidate without considering incentives offered to Amazon. It’s difficult to judge whether New York City would have been chosen with reduced incentives. On the one hand it has the best public transportation, strong cultural advantages, and several great Universities (as a source of employees), especially the new Cornell-Technion campus located directly next to Amazon’s HQ2 location. On the other hand, it is a very expensive place to do business which is why these incentive programs were created to begin with. As a basis of comparison, consider the bundle of incentives Wisconsin offered to get the Taiwanese technology company Foxconn to build a U.S. plant there. For the 13,000 jobs (at an average annual wage of $53,000) that Foxconn has committed to, Wisconsin plus the County and local village have provided about $3.8 billion in tax credits and breaks. The taxable wages in NY will be 6-9 times as much and the incentives are lower. Therefore, I suspect other locations offered Amazon incentives at the same or a greater level as those from New York.

How Does Revenue to the City and State Compare to the out of pocket cost?

I’m going to make the following assumptions:

  1. New York State Corporate Tax is 6.5% and NYC is 8.85% but I’m assuming the business tax incentives from Excelsior and REAP will be sufficient to preclude Amazon paying any incremental taxes to NYC or NYS (above what they currently pay) for the 12 years they apply. Subsequently, there should be substantial incremental taxes for the additional 8 years of the time horizon I’m using. Since I’m not including this income flow to the city and state, there is considerable upside to my calculations.
  2. The PILOT program payments, estimated by Deputy Mayor Alicia Glen, at $600 to $650 million are the only real estate taxes Amazon will pay. I’m not sure what it would have been without the ICAP credit but the range for the PILOT program amount appears to be known.
  3. NYS and/or NYC will benefit from income, sales and property taxes on employees hired by Amazon and taxes on any additional jobs that get created because of Amazon. I’ll assume taxes are on full wages but that employees have no other income (like interest, capital gains, etc.) and all individuals are single. This puts my model for some who are married without a working spouse at higher taxes then they will pay, but my estimates will be too low for those with a working spouse or any with other sources of income. For this purpose, I’ll use the initial 25,000 jobs plus half of the additional 15,000 (32,500) as the average number over a 20 year period. Since the incremental employment should average longer, that seemed a conservative average to use. I’ll also use an average starting salary of $150,000 for the future Amazon employees as that has been in the announcement. As another assumption, to keep my calculations below what should occur, I haven’t assumed any increases in salary. Even a 4% increase per year would cause salaries to more than double by the end of the 20 years (and NYS and NYC income taxes grow by even more). Since those involved in the project would likely have wage increases over time their income and other taxes would be considerably higher than those based on my assumptions. This coupled with the fact that the negotiators for NYC and NYS used 25 years as the horizon, means their tax calculations will be considerably higher (and more accurate) than mine for the direct employees.

I used the website Smart Asset calculator to generate estimates of NYS and NYC Income tax, sales tax, and property tax per year for each income level. As stated before, the actual numbers will be higher because many of these individuals will have other sources of income, a working spouse and will have salaries escalating over time. Table 2 shows the totals for these estimated taxes to be nearly $15B.

Table 2: NYS & NYC Tax Impact from Amazon HQ


  1. Scholars have found strong evidence of the presence of a local multiplier effect. These come from the direct employees hired, indirect jobs created from suppliers and partners and induced jobs that are a result of the spending of the direct and indirect jobs as well as each layer of induced jobs. For example, a noted scholar on the subject, Enrico Moretti, determined that when Apple Computer was employing 12,000 workers locally, an additional 60,000 jobs were created. These included 36,000 unskilled positions like restaurant or retail workers, and 24,000 skilled jobs like lawyers or doctors. If I assume this 5 to 1 ratio would hold for the highly paid Amazon workers, then 32,500 technology jobs would generate 162,500 more jobs in NYC! Based on the Apple example, 60% of these would be unskilled and 40% highly skilled. Assuming an average salary of $35,000 for the unskilled, an average of $100,00 for half of the skilled and $150,000 for the other half, taxes generated from the multiplier effect over the 20 years would be over $28 billion.

Table 3: NYS & NYC Tax Impact from Amazon HQ Multiplier Effect

  1. The $2.5 billion Amazon has committed to spend on capital projects would in turn generate further jobs in construction and an associated multiplier impact, but since this is a temporary benefit over 2-5 years, I have omitted it from the analysis.
  2. The $43 billion estimated total of these income streams to the city and state assume the tax abatements cause no incremental corporate taxes from Amazon. While Amazon will be paying rent on the land leased from the city, I also left out this benefit as I couldn’t estimate the amount. While I believe the actual benefit could be higher, consider that even if I’m off by 75% on the multiplier effect, the total would still be over $22 billion and the payback about 44X the $505 million cash outlay!

Other Benefits and Negatives of Attracting Amazon

There are a variety of more difficult factors to analyze than the straight forward financial windfall the city and state will get from this agreement. Living in the San Francisco Bay Area has taught me that what I may view as obvious might not be so to others. Becoming the Florence of the Tech World has meant that the Bay Area is incredibly wealthy, in turn generating a huge tax base for government to use to fund helping the homeless, stem research and many other perceived public good initiatives. Attracting 25,000 – 40,000 technology jobs will vault New York City into a clear contender for tech community leadership. It will lead to others following and to the creation of more startups, one or two who could become the next Amazon, Apple, Google, Facebook, or Microsoft (generating more jobs and more tax income to NYC and NYS). This is not universally celebrated in the Bay Area as it also has led to traffic congestion, higher housing prices, and increased cost of entertainment. But It has meant increased employment opportunities across the full spectrum of jobs. However, an average worker, while making more than elsewhere, can find it a difficult place to afford. In New York City these issues are partly offset for those renting apartments due to rent control and rent stabilization as over 50% of all rental units are under some form of regulation.

New York City is large enough to be able to absorb 25,000 to 40,000 workers relatively easily, but it could add to the problems for the already strained subway system. I believe it’s no accident that Amazon chose a location near the water so that its employees could take advantage of the new, highly praised, NYC Ferry system. While many of the workers may choose to live near the Amazon facilities, some may decide to buy houses in locations that require utilizing mass transit. If I were to guess, I would say a portion of the increased cash flow, to the city will be used to improve the subway system, Long Island Railroad and to add more Ferries each of which will benefit all New Yorkers.

Conclusion: The Amazon Agreement for HQ2 to be in NYC is a Huge Positive for NYC and NYS

While detractors may nitpick at the deal, it has a great ROI for the City and State, will increase employment, provide revenue to improve mass transit and follows incentives mandated by existing laws. Clearly a coup for Mayor de Blasio and Governor Cuomo.

Soundbytes

  • The SF Chronicle published an article on November 28, 2018 touting Stephan Curry’s strong credentials as a possible MVP this year. In it they used several of the statistics we discussed a year ago. Namely, how much better his teammates shoot when they play with Curry and his amazing plus/minus.
  • Sticking with sports, I can’t help ruminating on how the NFL keeps shooting itself in the foot. I won’t comment on the latest unsavory incidents among players towards women or the Kaepernick fiasco. Instead, I keep thinking about what to call the team about to leave Oakland:
    • Oakland Raiders, their current name
    • Oakland Traders, given their propensity to exchange top players for draft choices
    • Oakland Traitors, trading away their best current players, which has insured a terrible season – thus completing the betrayal of the City of Oakland and the most loyal and colorful fan base in the league

Company Valuations Implied by my Valuations Bible: Are Snap, Netflix, Square and Twitter Grossly Overvalued?

Applying the Gross Margin Multiple Method to Public Company Valuation

In my last two posts I’ve laid out a method to value companies not yet at their mature business models. The method provides a way to value unprofitable growth companies and those that are profitable but not yet at what could be their mature business model. This often occurs when a company is heavily investing in growth at the expense of near-term profits. In the last post, I showed how I would estimate what I believed the long-term model would be for Tesla, calling the result “Potential Earnings” or “PE”. Since this method requires multiple assumptions, some of which might not find agreement among investors, I provided a second, simplified method that only involved gross margin and revenue growth.

The first step was taking about 20 public companies and calculating how they were valued as a multiple of gross margin (GM) dollars. The second step was to determine a “least square line” and formula based on revenue growth and the gross margin multiple for these companies. The coefficient of 0.62 shows that there is a good correlation between Gross Margin and Revenue Growth, and one significantly better than the one between Revenue Growth and a company’s Revenue Multiple (that had a coefficient of 0.36 which is considered very modest).

Where’s the Beef?

The least square formula derived in my post for relating revenue growth to an implied multiple of Gross Margin dollars is:

GM Multiple = (24.773 x Revenue growth percent) + 4.1083

Implied Company Market Value = GM Multiple x GM Dollars

Now comes the controversial part. I am going to apply this formula to 10 companies using their data (with small adjustments) and compare the Implied Market Value (Implied MKT Cap) to their existing market Cap as of several days ago. I’ll than calculate the Implied Over (under) Valuation based on the comparison. If the two values are within 20% I view it as normal statistical variation.

Table 1: Valuation Analysis of 10 Tech Companies

  • * Includes net cash included in expected market cap
  • ** Uses adjusted GM%
  • *** Uses 1/31/18 year end
  • **** Growth rate used in the model is q4 2017 vs q4 2016.  See text

This method suggests that 5 companies are over-valued by 100% or more and a fifth, Workday, by 25%. Since Workday is close to a normal variation, I won’t discuss it further. I have added net cash for Facebook, Snap, Workday and Twitter to the implied market cap as it was material in each case but did not do so for the six others as the impact was not as material.

I decided to include the four companies I recommended, in this year’s top ten list, Amazon, Facebook, Tesla and Stitchfix, in the analysis. To my relief, they all show as under-valued with Stitchfix, (the only one below the Jan 2 price) having an implied valuation more than 100% above where it currently trades. The other three are up year to date, and while trading below what is suggested by this method, are within a normal range. For additional discussion of these four see our 2018 top Ten List.


Digging into the “Overvalued” Five

Why is there such a large discrepancy between actual market cap and that implied by this method for 5 companies? There are three possibilities:

  1. The method is inaccurate
  2. The method is a valid screen but I’m missing some adjustment for these companies
  3. The companies are over-valued and at some point, will adjust, making them risky investments

While the method is a good screen on valuation, it can be off for any given company for three reasons:  the revenue growth rate I’m using will radically change; a particular company has an ability to dramatically increase gross margins, and/or a particular company can generate much higher profit margins than their gross margin suggests. Each of these may be reflected in the company’s actual valuation but isn’t captured by this method.

To help understand what might make the stock attractive to an advocate, I’ll go into a lot of detail in analyzing Snap. Since similar arguments apply to the other 4, I’ll go into less detail for each but still point out what is implicit in their valuations.

Snap

Snap’s gross margin (GM) is well below its peers and hurts its potential profitability and implied valuation. Last year, GM was about 15%, excluding depreciation and amortization, but it was much higher in the seasonally strong Q4. It’s most direct competitor, Facebook, has a gross margin of 87%.  The difference is that Facebook monetizes its users at a much higher level and has invested billions of dollars and executed quite well in creating its own low-cost infrastructure, while Snap has outsourced its backend to cloud providers Google and Amazon. Snap has recently signed 5-year contracts with each of them to extend the relationships. Committing to lengthy contracts will likely lower the cost of goods sold.  Additionally, increasing revenue per user should also improve GM.  But, continuing to outsource puts a cap on how high margins can reach. Using our model, Snap would need 79% gross margin to justify its current valuation. If I assume that scale and the longer-term contracts will enable Snap to double its gross margins to 30%, the model still shows it as being over-valued by 128% (as opposed to the 276% shown in our table). The other reason bulls on Snap may justify its high valuation is that they expect it to continue to grow revenue at 100% or more in 2018 and beyond. What is built into most forecasts is an assumed decline in revenue growth rates over time… as that is what typically occurs. The model shows that growing revenue 100% a year for two more years without burning cash would leave it only 32% over-valued in 2 years. But as a company scales, keeping revenue growth at that high a level is a daunting task. In fact, Snap already saw revenue growth decline to 75% in Q4 of 2017.

Twitter

Twitter is not profitable.  Revenue declined in 2017 after growing a modest 15% in 2016, and yet it trades at a valuation that implies that it is a growth company of about 50%. While it has achieved such levels in the past, it may be difficult to even get back to 15% growth in the future given increased competition for advertising.

Netflix

I recommended Netflix in January 2015 as one of my stock picks for the year, and it proved a strong recommendation as the stock went up about 140% that year. However, between January 2015 and January 2018, the stock was up over 550% while trailing revenue only increased 112%.  I continue to like the fundamentals of Netflix, but my GM model indicates that the stock may have gotten ahead of itself by a fair amount, and it is unlikely to dramatically increase revenue growth rates from last year’s 32%.

Square

Square has followed what I believe to be the average pattern of revenue growth rate decline as it went from 49% growth in 2015, down to 35% growth in 2016, to under 30% growth in 2017. There is no reason to think this will radically change, but the stock is trading as if its revenue is expected to grow at a nearly 90% rate. On the GM side, Square has been improving GM each year and advocates will point out that it could go higher than the 38% it was in 2017. But, even if I use 45% for GM, assuming it can reach that, the model still implies it is 90% over-valued.

Blue Apron

I don’t want to beat up on a struggling Blue Apron and thought it might have reached its nadir, but the model still implies it is considerably over-valued. One problem that the company is facing is that investors are negative when a company has slow growth and keeps losing money. Such companies find it difficult to raise additional capital. So, before running out of cash, Blue Apron began cutting expenses to try to reach profitability. Unfortunately, given their customer churn, cutting marketing spend resulted in shrinking revenue in each sequential quarter of 2017. In Q4 the burn was down to $30 million but the company was now at a 13% decline in revenue versus Q4 of 2016 (which is what we used in our model). I assume the solution probably needs to be a sale of the company. There could be buyers who would like to acquire the customer base, supplier relationships and Blue Apron’s understanding of process. But given that it has very thin technology, considerable churn and strong competition, I’m not sure if a buyer would be willing to pay a substantial premium to its market cap.


An Alternative Theory on the Over Valued Five

I have to emphasize that I am no longer a Wall Street analyst and don’t have detailed knowledge of the companies discussed in this post, so I easily could be missing some important factors that drive their valuation.  However, if the GM multiple model is an accurate way of determining valuation, then why are they trading at such lofty premiums to implied value? One very noticeable common characteristic of all 5 companies in question is that they are well known brands used by millions (or even tens of millions) of people. Years ago, one of the most successful fund managers ever wrote a book where he told readers to rely on their judgement of what products they thought were great in deciding what stocks to own. I believe there is some large subset of personal and professional investors who do exactly that. So, the stories go:

  • “The younger generation is using Snap instead of Facebook and my son or daughter loves it”
  • “I use Twitter every day and really depend on it”
  • “Netflix is my go-to provider for video content and I’m even thinking of getting rid of my cable subscription”

Once investors substitute such inclinations for hard analysis, valuations can vary widely from those suggested by analytics. I’m not saying that such thoughts can’t prove correct, but I believe that investors need to be very wary of relying on such intuition in the face of evidence that contradicts it.

Ten Predictions for 2018

In my recap of 2017 predictions I pointed out how boring my stock predictions have been with Tesla and Facebook on my list every year since 2013 and Amazon on for two of the past three years. But what I learned on Wall Street is that sticking with companies that have strong competitive advantages in a potentially mega-sized market can create great performance over time (assuming one is correct)! So here we go again, because as stated in my January 5 post, I am again including Tesla, Facebook and Amazon in my Top ten list for 2018. I believe they each continue to offer strong upside, as explained below. I’m also adding a younger company, with a modest market cap, thus more potential upside coupled with more risk. The company is Stitch Fix, an early leader in providing women with the ability to shop for fashion-forward clothes at home. My belief in the four companies is backed up by my having an equity position in each of them.

I’m expecting the four stocks to outperform the market. So, in a steeply declining market, out-performance might occur with the stock itself being down (but less than the market). Having mentioned the possibility of a down market, I’m predicting the market will rise this year. This is a bit scary for me, as predicting the market as a whole is not my specialty.

We’ll start with the stock picks (with January 2 opening prices of stocks shown in parenthesis) and then move on to the remainder of my 10 predictions.

1. Tesla stock appreciation will continue to outpace the market (it opened the year at $312/share).

The good news and bad news on Tesla is the delays in production of the Model 3. The good part is that we can still look forward to massive increases in the number of cars the company sells once Tesla gets production ramping (I estimate the Model 3 backlog is well in excess of 500,000 units going into 2018 and demand appears to be growing). In 2017, Tesla shipped between 80,000 and 100,000 vehicles with revenue up 30% in Q3 without help from the model 3. If the company is successful at ramping capacity (and acquiring needed parts), it expects to reach a production rate of 5,000 cars per week by the end of Q1 and 10,000 by the end of the year. That could mean that the number of units produced in Q4 2018 will be more than four times that sold in Q4 2017 (with revenue about 2.0-2.5x due to the Model 3 being a lower priced car). Additionally, while it is modest compared to revenue from selling autos, the company appears to be the leader in battery production. It recently announced the largest battery deal ever, a $50 million contract (now completed on time) to supply what is essentially a massive backup battery complex for energy to Southern Australia. While this type of project is unlikely to be a major portion of revenue in the near term, it can add to Tesla’s growth rate and profitability.

2. Facebook stock appreciation will continue to outpace the market (it opened the year at $182/share).

The core Facebook user base growth has slowed considerably but Facebook has a product portfolio that includes Instagram, WhatsApp and Oculus. This gives Facebook multiple opportunities for revenue growth: Improve the revenue per DAU (daily active user) on Facebook itself; increase efforts to monetize Instagram and WhatsApp in more meaningful ways; and build the install base of Oculus. Facebook advertising rates have been increasing steadily as more mainstream companies shift budget from traditional advertising to Facebook, especially in view of declining TV viewership coupled with increased use of DVRs (allowing viewers to skip ads). Higher advertising rates, combined with modest growth in DAUs, should lead to continued strong revenue growth. And while the Oculus product did not get out of the gate as fast as expected, it began picking up steam in Q3 2017 after Facebook reduced prices. At 210,000 units for the quarter it may have contributed up to 5% of Q3 revenue. The wild card here is if a “killer app” (a software application that becomes a must have) launches that is only available on the Oculus, sales of Oculus could jump substantially in a short time.

3. Amazon stock appreciation will outpace the market (it opened the year at $1188/share).

Amazon, remarkably, increased its revenue growth rate in 2017 as compared to 2016. This is unusual for companies of this size. In 2018, we expect online to continue to pick up share in retail and Amazon to gain more share of online. The acquisition of Whole Foods will add approximately $4B per quarter in revenue, boosting year/year revenue growth of Amazon an additional 9%-11% per quarter, if Whole Foods revenue remains flattish. If Amazon achieves organic growth of 25% (in Q3 it was 29% so that would be a drop) in 2018, this would put the 3 quarters starting in Q4 2017 at about 35% growth. While we do expect Amazon to boost Whole Foods revenue, that is not required to reach those levels. In Q4 2018, reported revenue will return to organic growth levels. The Amazon story also features two other important growth drivers. First, I expect the Echo to have another substantial growth year and continue to emerge as a new platform in the home. Additionally, Amazon appears poised to benefit from continued business migration to the cloud coupled with increased market share and higher average revenue per cloud customer. This will be driven by modest price increases and introduction of more services as part of its cloud offering. The success of the Amazon Echo with industry leading voice technology should continue to provide another boost to Amazon’s revenue. Additionally, having a large footprint of physical stores will allow Amazon to increase distribution of many products.

4. Stitch Fix stock appreciation will outpace the market (it opened the year at $25/share and is at the same level as I write this post).

Stitch Fix is my riskiest stock forecast. As a new public company, it has yet to establish a track record of performance that one can depend upon. On the other hand, it’s the early leader in a massive market that will increasingly move online, at-home shopping for fashion forward clothes. The number of people who prefer shopping at home to going to a physical store is on the increase. The type of goods they wish to buy expands every year. Now, clothing is becoming a new category on the rapid rise (it grew from 11% of overall clothing retail sales in 2011 to 19% in 2016). It is important for women buying this way to feel that the provider understands what they want and facilitates making it easy to obtain clothes they prefer. Stitch Fix uses substantial data analysis to personalize each box it sends a customer. The woman can try them on, keep (and pay for) those they like, and return the rest very easily.

5. The stock market will rise in 2018 (the S&P opened the year at 2,696 on January 2).

While I have been accurate on recommending individual stocks over a long period, I rarely believe that I understand what will happen to the overall market. Two prior exceptions were after 9/11 and after the 2008 mortgage crisis generated meltdown. I was correct both times but those seemed like easy calls. So, it is with great trepidation that I’m including this prediction as it is based on logic and I know the market does not always follow logic! To put it simply, the new tax bill is quite favorable to corporations and therefore should boost after-tax earnings. What larger corporations pay is often a blend of taxes on U.S. earnings and those on earnings in various countries outside the U.S. There can be numerous other factors as well. Companies like Microsoft have lower blended tax rates because much of R&D and corporate overhead is in the United States and several of its key products are sold out of a subsidiary in a low tax location, thereby lowering the portion of pre-tax earnings here. This and other factors (like tax benefits in fiscal 2017 from previous phone business losses) led to blended tax rates in fiscal 2015, 2016 and 2017 of 34%, 15% and 8%, respectively. Walmart, on the other hand, generated over 75% of its pre-tax earnings in the United States over the past three fiscal years, so their blended rate was over 30% in each of those years

Table 1: Walmart Blended Tax Rates 2015-2017

The degree to which any specific company’s pre-tax earnings mix changes between the United States and other countries is unpredictable to me, so I’m providing a table showing the impact on after-tax earnings growth for theoretical companies instead. Table 2 shows the impact of lowering the U.S. corporate from 35% to 21% on four example companies. To provide context, I show two companies growing pre-tax earnings by 10% and two companies by 30%. If blended tax rates didn’t change, EPS would grow by the same amount as pre-tax earnings. For Companies 1 and 3, Table 2 shows what the increase in earnings would be if their blended 2017 tax rate was 35% and 2018 shifts to 21%. For companies 2 and 4, Table 2 shows what the increase in earnings would be if the 2017 rate was 30% (Walmart’s blended rate the past three years) and the 2018 blended rate is 20%.

Table 2: Impact on After-Tax Earnings Growth

As you can see, companies that have the majority of 2018 pre-tax earnings subject to the full U.S. tax rate could experience EPS growth 15%-30% above their pre-tax earnings growth. On the other hand, if a company has a minimal amount of earnings in the U.S. (like the 5% of earnings Microsoft had in fiscal 2017), the benefit will be minimal. Whatever benefits do accrue will also boost cash, leading to potential investments that could help future earnings.  If companies that have maximum benefits from this have no decline in their P/E ratio, this would mean a substantial increase in their share price, thus the forecast of an up market. But as I learned on Wall Street, it’s important to sight risk. The biggest risks to this forecast are the expected rise in interest rates this year (which usually is negative for the market) and the fact that the market is already at all-time highs.

6. Battles between the federal government and states will continue over marijuana use but the cannabis industry will emerge as one to invest in.

The battle over legalization of Marijuana reached a turning point in 2017 as polls showed that over 60% of Americans now favor full legalization (as compared to 12% in 1969). Prior to 2000, only three states (California, Oregon and Maine) had made medical cannabis legal. Now 29 states have made it legal for medical use and six have legalized sale for recreational use. Given the swing in voter sentiment (and a need for additional sources of tax revenue), more states are moving towards legalization for recreational and medical purposes. This has put the “legal” marijuana industry on a torrid growth curve. In Colorado, one of the first states to broadly legalize use, revenue is over $1 billion per year and overall 2017 industry revenue is estimated at nearly $8 billion, up 20% year/year. Given expected legalization by more states and the ability to market product openly once it is legal, New Frontier Data predicts that industry revenue will more than triple by 2025. The industry is making a strong case that medical use has compelling results for a wide variety of illnesses and high margin, medical use is forecast to generate over 50% of the 2025 revenue. Given this backdrop, public cannabis companies have had very strong performance. Despite this, in 2016, VCs only invested about $49 million in the sector. We expect that number to escalate dramatically in 2017 through 2019. While public cannabis stocks are trading at nosebleed valuations, they could have continued strong performance as market share consolidates and more states (and Canada) head towards legalization. One caveat to this is that Federal law still makes marijuana use illegal and the Trump administration is adopting a more aggressive policy towards pursuing producers, even in states that have made use legal. The states that have legalized marijuana use are gearing up to battle the federal government.

7. At least one city will announce a new approach to Urban transport

Traffic congestion in cities continues to worsen. Our post on December 14, 2017 discussed a new approach to urban transportation, utilizing small footprint automated cars (one to two passengers, no trunk, no driver) in a dedicated corridor. This appears much more cost effective than a Rapid Bus Transit solution and far more affordable than new subway lines. As discussed in that post, Uber and other ride services increase traffic and don’t appear to be a solution. The thought that automating these vehicles will relieve pressure is overly optimistic. I expect at least one city to commit to testing the method discussed in the December post before the end of this year – it is unlikely to be a U.S. city. The approach outlined in that post is one of several that is likely to be tried over the coming years as new thinking is clearly needed to prevent the traffic congestion that makes cities less livable.

8. Offline retailers will increase the velocity of moving towards omnichannel.

Retailers will adopt more of a multi-pronged approach to increasing their participation in e-commerce. I expect this to include:

  • An increased pace of acquisition of e-commerce companies, technologies and brands with Walmart leading the way. Walmart and others need to participate more heavily in online as their core offline business continues to lose share to online. In 2017, Walmart made several large acquisitions and has emerged as the leader among large retailers in moving online. This, in turn, has helped its stock performance. After a stellar 12 months in which the stock was up over 40%, it finally exceeded its January 2015 high of $89 per share (it reached $101/share as we are finalizing the post). I expect Walmart and others in physical retail to make acquisitions that are meaningful in 2018 so as to speed up the transformation of their businesses to an omnichannel approach.
  • Collaborating to introduce more online/technology into their physical stores (which Amazon is likely to do in Whole Foods stores). This can take the form of screens in the stores to order online (a la William Sonoma), having online purchases shipped to your local store (already done by Nordstrom) and adding substantial ability to use technology to create personalized items right at the store, which would subsequently be produced and shipped by a partner.

9. Social commerce will begin to emerge as a new category.

Many e-commerce sites have added elements of social, and many social sites have begun trying to sell various products. But few of these have a fully integrated social approach to e-commerce. The elements of a social approach to e-commerce include:

  • A feed-based user experience
  • Friends’ actions impact your feed
  • Following trend setters to see what they are buying, wearing, and favoring
  • Notifications based on your likes and tastes
  • One click to buy
  • Following particular stores and/or friends

I expect to see existing e-commerce players adding more elements of social, existing social players improving their approach to commerce and a rising trend of emerging companies focused on fully integrated social commerce.

10. “The Empire Strikes Back”: automobile manufacturers will begin to take steps to reclaim use of its GPS.

It is almost shameful that automobile manufacturers, other than Tesla, have lost substantial usage of their onboard GPS systems as many people use their cell phones or a small device to run Google, Waze (owned by Google) or Garmin instead of the larger screen in their car. In the hundreds of times I’ve taken an Uber or Lyft, I’ve never seen the driver use their car’s system. To modernize their existing systems, manufacturers may need to license software from a third party. Several companies are offering next generation products that claim to replicate the optimization offered by Waze but also add new features that go beyond it like offering to order coffee and other items to enable the driver to stop at a nearby location and have the product prepaid and waiting for them. In addition to adding value to the user, this also leads to a lead-gen revenue opportunity. In 2018, I expect one or more auto manufacturers to commit to including a third-party product in one or more of their models.

Soundbytes

Tesla model 3 sample car generates huge buzz at Stanford Mall in Menlo Park California. This past weekend my wife and I experienced something we had not seen before – a substantial line of people waiting to check out a car, one of the first Model 3 cars seen live. We were walking through the Stanford Mall where Tesla has a “Guide Store” and came upon a line of about 60 people willing to wait a few hours to get to check out one of the two Model 3’s available for perusal in California (the other was in L.A.). An hour later we came back, and the line had grown to 80 people. To be clear, the car was not available for a test drive, only for seeing it, sitting in it, finding out more info, etc. Given the buzz involved, it seems to me that as other locations are given Model 3 cars to look at, the number of people ordering a Model 3 each week might increase faster than Tesla’s capacity to fulfill.

Re-cap of 2017 Top Ten Predictions

I started 2017 by saying:

When I was on Wall Street I became very boring by having the same three strong buy recommendations for many years…  until I downgraded Compaq in 1998 (it was about 30X the original price at that point). The other two, Microsoft and Dell, remained strong recommendations until I left Wall Street in 2000. At the time, they were each well over 100X the price of my original recommendation. I mention this because my favorite stocks for this blog include Facebook and Tesla for the 4th year in a row. They are both over 5X what I paid for them in 2013 ($23 and $45, respectively) and I continue to own both. Will they get to 100X or more? This is not likely, as companies like them have had much higher valuations when going public compared with Microsoft or Dell, but I believe they continue to offer strong upside, as explained below.

Be advised that my top ten for 2018 will continue to include all three picks from 2017. I’m quite pleased that I continue to be fortunate, as the three were up an average of 53% in 2017. Furthermore, each of my top ten forecasts proved pretty accurate, as well!

I’ve listed in bold the 2017 stock picks and trend forecasts below, and give a personal evaluation of how I fared on each. For context, the S&P was up 19% and the Nasdaq 28% in 2017.

  1. Tesla stock appreciation will continue to outpace the market. Tesla, once again, posted very strong performance.  While the Model 3 experienced considerable delays, backorders for it continued to climb as ratings were very strong. As of mid-August, Tesla was adding a net of 1,800 orders per day and I believe it probably closed the year at over a 500,000-unit backlog. So, while the stock tailed off a bit from its high ($385 in September), it was up 45% from January 3, 2017 to January 2, 2018 and ended the year at 7 times the original price I paid in 2013 when I started recommending it. Its competitors are working hard to catch up, but they are still trailing by quite a bit.
  2. Facebook stock appreciation will continue to outpace the market. Facebook stock appreciated 57% year/year and opened on January 2, 2018 at $182 (nearly 8 times my original price paid in 2013 when I started recommending it). This was on the heels of 47% revenue growth (through 3 quarters) and even higher earnings growth.
  3. Amazon stock appreciation will outpace the market. Amazon stock appreciated 57% in 2017 and opened on January 2, 2018 at $1,188 per share. It had been on my recommended list in 2015 when it appreciated 137%. Taking it off in 2016 was based on Amazon’s stock price getting a bit ahead of itself (and revenue did catch up that year growing 25% while the stock was only up about 12%). In 2017, the company increased its growth rate (even before the acquisition of Whole Foods) and appeared to consolidate its ability to dominate online retail.
  4. Both online and offline retailers will increasingly use an omnichannel approach. Traditional retailers started accelerating the pace at which they attempted to blend online and offline in 2017. Walmart led, finally realizing it had to step up its game to compete with Amazon. While its biggest acquisition was Jet.com for over $3 billion, it also acquired Bonobos, Modcloth.com, Moosejaw, Shoebuy.com and Hayneedle.com, creating a portfolio of online brands that could also be sold offline. Target focused on becoming a leader in one-day delivery by acquiring Shipt and Grand Junction, two leaders in home delivery. While I had not predicted anything as large as a Whole Foods acquisition for Amazon, I did forecast that they would increase their footprint of physical locations (see October 2016 Soundbytes). The strategy for online brands to open “Guide” brick and mortar stores ( e.g. Tesla, Warby Parker, Everlane, etc.) continued at a rapid pace.
  5. A giant piloted robot will be demo’d as the next form of entertainment. As expected, Azure portfolio company, Megabots, delivered on this forecast by staging an international fight with a giant robot from Japan. The fight was not live as the robots are still “temperamental” (meaning they occasionally stop working during combat). However, interest in this new form of entertainment was incredible as the video of the fight garnered over 5 million views (which is in the range of an average prime-time TV show). There is still a large amount of work to be done to convert this to an ongoing form of entertainment, but all the ingredients are there.
  6. Virtual and Augmented reality products will escalate. Sales of VR/AR headsets appear to have well exceeded 10 million units for the year with some market gain for higher-end products. The types of applications have expanded from gaming to room design (and viewing), travel, inventory management, education, healthcare, entertainment and more. While the actual growth in unit sales fell short of what many expected, it still was substantial. With Apple’s acquisition of Vrvana (augmented reality headset maker) it seems clear that Apple plans to launch multiple products in the category over the next 2-3 years, and with Facebook’s launch of ArKIT, it’s social AR development platform, there is clearly a lot of focus and growth ahead.
  7. Magic Leap will disappoint in 2017. Magic Leap, after 5 years of development and $1.5 billion of investment, did not launch a product in 2017. But, in late December they announced that their first product will launch in 2018. Once again, the company has made strong claims for what its product will do, and some have said early adopters (at a very hefty price likely to be in the $1,500 range) are said to be like those who bought the first iPod. So, while it disappointed in 2017, it is difficult to tell whether or not this will eventually be a winning company as it’s hard to separate hype from reality.
  8. Cable companies will see a slide in adoption. According to eMarketer, “cord cutting”, i.e. getting rid of cable, reached record proportions in 2017, well exceeding their prior forecast. Just as worrisome to providers, the average time watching TV dropped as well, implying decreased dependence on traditional consumption. Given the increase now evident in cord cutting, UBS (as I did a year ago) is now forecasting substantial acceleration of the decline in subscribers. While the number of subscribers bounced around a bit between 2011 and 2015, when all was said and done, the aggregate drop in that four-year period was less than 0.02%. UBS now forecasts that between the end of 2016 and the end of 2018 the drop will be 7.3%. The more the industry tries to offset the drop by price increases, the more they will accelerate the pace of cord cutting.
  9. Spotify will either postpone its IPO or have a disappointing one. When we made this forecast, Spotify was expected to go public in Q2 2017. Spotify postponed its IPO into 2018 while working on new contracts with the major music labels to try to improve its business model. It was successful in these negotiations in that the labels all agreed to new terms. Since the terms were not announced, we’ll need to see financials for Q1 2018 to better understand the magnitude of improvement. In the first half of the year, Spotify reported that gross margins improved from 16% to 22%, but this merely cut its loss level rather than move the company to profitability. It has stated that it expects to do a non-traditional IPO (a direct listing without using an investment bank) in the first half of 2018. If the valuation approaches its last private round, I would caution investors to stay away, as that valuation, coupled with 22% gross margins (and over 12% of revenue in sales and marketing cost to acquire customers), implies net margin in the mid-single digits at best (assuming they can reduce R&D and G&A as a percent of revenue). This becomes much more challenging in the face of a $1.6 billion lawsuit filed against it for illegally offering songs without compensating the music publisher. Even if they managed to successfully fight the lawsuit and improve margin, Spotify would be valued at close to 100 times “potential earnings” and these earnings may not even materialize.
  10. Amazon’s Echo will gain considerable traction in 2017. Sales of the Echo exploded in 2017 with Amazon announcing that it “sold 10s of millions of Alexa-enabled devices” exceeding our aggressive forecast of 2-3x the 4.4 million units sold in 2016. The Alexa app was also the top app for both Android and iOS phones. It clearly has carved out a niche as a new major platform.

Stay tuned for my top 10 predictions of 2018!


SoundBytes

  • In our December 20, 2017 post, I discussed just how much Steph Curry improves teammate performance and how effective a shooter he is. I also mentioned that Russell Westbrook leading the league in scoring in the prior season might have been detrimental to his team as his shooting percentage falls well below the league average. Now, in his first game returning to the lineup, Curry had an effective shooting percentage that exceeded 100% while scoring 38 points (this means scoring more than 2 points for every shot taken). It would be interesting to know if Curry is the first player ever to score over 35 points with an effective shooting percentage above 100%! Also, as of now, the Warriors are scoring over 15 points more per game this season with Curry in the lineup than they did for the 11 games he was out (which directly ties to the 7.4% improvement in field goal percentage that his teammates achieve when playing with Curry as discussed in the post).

Will Grocery Shopping Ever be the Same?

Will grocery shopping ever be the same?

Dining and shopping today is very different than in days gone by – the Amazon acquisition of Whole Foods is a result

“I used to drink it,” said Andy Warhol once of Campbell’s soup. “I used to have the same lunch every day, for 20 years, I guess, the same thing over and over again.” In Warhol’s signature medium, silkscreen, the artist reproduced his daily Campbell’s soup can over and over again, changing only the label graphic on each one.

When I was growing up I didn’t have exactly the same thing over and over like Andy Warhol, but virtually every dinner was at home, at our kitchen table (we had no dining room in the 4-room apartment). Eating out was a rare treat and my father would have been abhorred if my mom brought in prepared food. My mom, like most women of that era, didn’t officially work, but did do the bookkeeping for my dad’s plumbing business. She would shop for food almost every day at a local grocery and wheel it home in her shopping cart.

When my wife and I were raising our kids, the kitchen remained the most important room in the house. While we tended to eat out many weekend nights, our Sunday through Thursday dinners were consumed at home, but were sprinkled with occasional meals brought in from the outside like pizza, fried chicken, ribs, and Chinese food. Now, given a high proportion of households where both parents work, eating out, fast foods and prepared foods have become a large proportion of how Americans consume dinner. This trend has reached the point where some say having a traditional kitchen may disappear as people may cease cooking at all.

In this post, I discuss the evolution of our eating habits, and how they will continue to change. Clearly, the changes that have already occurred in shopping for food and eating habits were motivations for Amazon’s acquisition of Whole Foods.

The Range of How We Dine

Dining can be broken into multiple categories and families usually participate in all of them. First, almost 60% of dinners eaten at home are still prepared there. While the percentage has diminished, it is still the largest of the 4 categories for dinners. Second, many meals are now purchased from a third party but still consumed at home. Given the rise of delivery services and greater availability of pre-cooked meals at groceries, the category spans virtually every type of food. Thirdly, many meals are purchased from a fast food chain (about 25% of Americans eat some type of fast food every day1) and about 20% of meals2 are eaten in a car. Finally, a smaller percentage of meals are consumed at a restaurant. (Sources: 1Schlosser, Eric. “Americans Are Obsessed with Fast Food: The Dark Side of the All-American Meal.” CBSNews. Accessed April 14, 2014 / 2Stanford University. “What’s for Dinner?” Multidisciplinary Teaching and Research at Stanford. Accessed April 14, 2014).

The shift to consuming food away from home has been a trend for the last 50 years as families began going from one worker to both spouses working. The proportion of spending on food consumed away from home has consistently increased from 1965-2014 – from 30% to 50%.

Source: Calculated by the Economic Research Service, USDA, from various data sets from the U.S. Census Bureau and the Bureau of Labor Statistics.

With both spouses working, the time available to prepare food was dramatically reduced. Yet, shopping in a supermarket remained largely the same except for more availability of prepared meals. Now, changes that have already begun could make eating dinner at home more convenient than eating out with a cost comparable to a fast food chain.

Why Shopping for Food Will Change Dramatically over the Next 30 Years

Eating at home can be divided between:

  1. Cooking from scratch using ingredients from general shopping
  2. Buying prepared foods from a grocery
  3. Cooking from scratch from recipes supplied with the associated ingredients (meal kits)
  4. Ordering meals that have previously been prepared and only need to be heated up
  5. Ordering meals from a restaurant that are picked up or delivered to your home
  6. Ordering “fast food” type meals like pizza, ribs, chicken, etc. for pickup or delivery.

I am starting with the assumption that many people will still want to cook some proportion of their dinners (I may be romanticizing given how I grew up and how my wife and I raised our family). But, as cooking for yourself becomes an even smaller percentage of dinners, shopping for food in the traditional way will prove inefficient. Why buy a package of saffron or thyme or a bag of onions, only to see very little of it consumed before it is no longer usable? And why start cooking a meal, after shopping at a grocery, only to find you are missing an ingredient of the recipe? Instead, why not shop by the meal instead of shopping for many items that may or may not end up being used.

Shopping by the meal is the essential value proposition offered by Blue Apron, Plated, Hello Fresh, Chef’d and others. Each sends you recipes and all the ingredients to prepare a meal. There is little food waste involved (although packaging is another story). If the meal preparation requires one onion, that is what is included, if it requires a pinch of saffron, then only a pinch is sent. When preparing one of these meals you never find yourself missing an ingredient. It takes a lot of the stress and the food waste out of the meal preparation process. But most such plans, in trying to keep the cost per meal to under $10, have very limited choices each week (all in a similar lower cost price range) and require committing to multiple meals per week. Chef’d, one of the exceptions to this, allows the user to choose individual meals or to purchase a weekly subscription. They also offer over 600 options to choose from while a service like Blue Apron asks the subscriber to select 3 out of 6 choices each week.

Blue Apron meals portioned perfectly for the amount required for the recipes

My second assumption is that the number of meals that are created from scratch in an average household will diminish each year (as it already has for the past 50 years). However, many people will want to have access to “preferred high quality” meals that can be warmed up and eaten, especially in two-worker households. This will be easier and faster (but perhaps less gratifying) than preparing a recipe provided by a food supplier (along with all the ingredients). I am talking about going beyond the pre-cooked items in your average grocery. There are currently sources of such meals arising as delivery services partner with restaurants to provide meals delivered to your doorstep. But this type of service tends to be relatively expensive on a per meal basis.

I expect new services to arise (we’ve already seen a few) that offer meals that are less expensive prepared by “home chefs” or caterers and ordered through a marketplace (this is category 4 in my list). The marketplace will recruit the chefs, supply them with packaging, take orders, deliver to the end customers, and collect the money. Since the food won’t be from a restaurant, with all the associated overhead, prices can be lower. Providing such a service will be a source of income for people who prefer to work at home. Like drivers for Uber and Lyft, there should be a large pool of available suppliers who want to work in this manner. It will be very important for the marketplaces offering such service to curate to ensure that the quality and food safety standards of the product are guaranteed. The availability of good quality, moderately priced prepared meals of one’s choice delivered to the home may begin shifting more consumption back to the home, or at a minimum, slow the shift towards eating dinners away from home.

Where will Amazon be in the Equation?

In the past, I predicted that Amazon would create physical stores, but their recent acquisition of Whole Foods goes far beyond anything I forecast by providing them with an immediate, vast network of physical grocery stores. It does make a lot of sense, as I expect omnichannel marketing to be the future of retail.  My reasoning is simple: on the one hand, online commerce will always be some minority of retail (it currently is hovering around 10% of total retail sales); on the other hand, physical retail will continue to lose share of the total market to online for years to come, and we’ll see little difference between e-commerce and physical commerce players.  To be competitive, major players will have to be both, and deliver a seamless experience to the consumer.

Acquiring Whole Foods can make Amazon the runaway leader in categories 1 and 2, buying ingredients and/or prepared foods to be delivered to your home.  Amazon Fresh already supplies many people with products that are sourced from grocery stores, whether they be general food ingredients or traditional prepared foods supplied by a grocery. They also have numerous meal kits that they offer, and we expect (and are already seeing indications) that Amazon will follow the Whole Foods acquisition by increasing its focus on “meal kits” as it attempts to dominate this rising category (3 in our table).

One could argue that Whole Foods is already a significant player in category 4 (ordering meals that are prepared, and only need to be heated up), believing that category 4 is the same as category 2 (buying prepared meals from a grocery). But it is not. What we envision in the future is the ability to have individuals (who will all be referred to as “Home Chefs” or something like that) create brands and cook foods of every genre, price, etc. Customers will be able to order a set of meals completely to their taste from a local home chef. The logical combatants to control this market will be players like Uber and Lyft, guys like Amazon and Google, existing recipe sites like Blue Apron…and new startups we’ve never heard of.