Recap of 2018 Top Ten Predictions

Have the bears finally won back control?

Oh, what a difference a month or 3 makes! If only 2018 had ended earlier…

I’m sure I’m not the only one who would have liked 2018 results to have been as of November 30th (or even better, October 1st). My stock forecasts were looking a lot better on those dates (and if I were smarter, perhaps I would have taken some of the gains at that point). My average gain was over 34% on October 1st (versus the S&P being up 8.5%) and was still holding at +10% as of November 30th with the S&P ahead 2.4%. Unfortunately, the year includes a disastrous December and my 4 stock picks ended the year at a 6.6% average loss. Since stock picks are always relative to the market, I take some solace in minutely beating the performance of the S&P which was down 7.0% for the year, especially since I favor very high beta stocks.

Before reviewing each of my picks from last year, I would like to provide a longer term view of my performance as it has now been 5 years that I’ve published my blog’s stock picks. Even with a down year in 2018 my compound gain is 310% versus an S&P gain of 38% over the same period. This translates to an average annual gain of 25% per year which coincidently is the target I set in my book (published years ago and now out of print).

Table 1: Mike’s Annual Blog Stock Pick Performance (5 Years)

Unlike last year, I certainly cannot take a victory lap for my 10 forecasts as I missed on 3 of the 10 and barely beat the S&P for my average among my 4 stock picks (all of which will be included again in my 2019 top ten). I’ve listed in bold each of my 2018 stock picks and trend forecasts below and give a personal, and only modestly biased, evaluation of how I fared on each.

  1. Tesla stock appreciation will continue to outpace the market (it opened the year at $312/share)

Tesla had an extraordinary Q3, 2018 as the model 3 launch showed how potent a player the company is becoming. In the quarter the Model 3 was the best selling car in the U.S. in terms of revenue and 5th highest by volume. This drove a greater than 100% revenue increase versus a year earlier and $1.75 in earnings per share versus a loss of $4.22 in the prior quarter. Given that the starting price for a model 3 was at $49,000, it is rather amazing that it could generate that volume of sales. Since the backlog for the Model 3 appears to remain at well over 300,000 cars and Tesla is closing in on a launch in Europe, Tesla seems assured of continued strong revenue through 2019 and likely beyond. However, much of the backlog is awaiting the lower priced (sub $40,000) version of the car which I believe will be available in Q2, 2019. As I had predicted, the Model 3 ramp up in production volume led to improved gross margins which exceeded 20% in the quarter. Despite the down market, Tesla stock was up about 7% in 2018. While we will continue recommending the stock, the phaseout of tax credits for buying an electric car has already begun. In its Q3 update Tesla stated that “better than expected Model 3 cost reductions is allowing us to bring more affordable options to the market sooner.” Yet, despite this forecast, the recently announced price decreases drove the stock down.

  1. Facebook stock appreciation will continue to outpace the market (it opened the year at $182/share).

Facebook stock did not perform well in 2018, closing the year down 28%, making this pick a losing proposition last year. This comes despite revenue growth that should be between 35% and 40%, and net income that is tracking towards about 35% growth (despite a massive increase in SG&A to spur future results).  What impacted the stock heavily was the plethora of criticism regarding privacy of user information coupled with the continuing charges of Russian usage to impact the election. Before the wave after wave of negative publicity the stock had reached a new high of $218/share in July. Because of the need to improve its reputation, Facebook is likely to continue to increase its spending to address privacy issues and to burnish its image. In summary, the fundamentals of the company remained quite sound in 2018 but the barrage of issues torpedoed the stock.

  1. Amazon stock appreciation will outpace the market (it opened the year at $1188/share).

While its stock dropped considerably from its September high of $2050, Amazon remained one of the best market performers in 2018 closing the year at over $1500/share. The company continued to execute well, growing every part of its business. It also began to leverage its scale as net income grew considerably faster than revenue and is likely to be well over triple that of 2017. Growth should be lower in Q4 2018 than earlier in the year as Q4 2017 was the first quarter that included all revenue from the acquisition of Whole Foods. Since the analyst consensus forecast already reflects Whole Foods revenue being in Q4 last year, as well as concerns over Amazon maintaining strong performance in Q4, I would not be surprised if Amazon was able to beat expectations in Q4.

  1. Stitch Fix stock appreciation will outpace the market (it opened the year at $25/share).

In my forecast I stated that this was my riskiest pick and it certainly proved the most volatile (which is saying a lot given the turbulence experience by Facebook, Tesla, and Amazon). I was feeling pretty smug when the stock reached a high of $52/share in September with a little over 3 months left in the year! Obviously, I was less sanguine as it dropped precipitously from September’s high to a low point of $17.09 by year’s end. I’m hoping that those of you who followed my advice trimmed back when the stock soared (I confess that I didn’t). The company continued to balance growth and profitability throughout the calendar year with October quarter revenue (up 24%) and earnings ($10.7 million up from $1.3 million in the prior year) both beating analyst expectations. Yet, concerns over user growth severely impacted the stock. I’m somewhat surprised by this as the users grew 22% and revenue 24% – since revenue beat expectations this means that analysts did not forecast an increase in average revenue per user. But the bottom line is, despite solid fundamentals the stock did not perform well.

  1. The stock market will rise in 2018 (the S&P opened the year at 2,696 on January 2).

When I made this forecast, I pointed out that I’m not particularly good at forecasting the overall market. My belief was based on the fact that the tax cut for corporations would mean a rise in earnings that exceeded the norm. I felt stronger earnings growth would be enough to offset the risk of the longest bull market in history turning negative. I sited the likelihood of higher interest rates being an additional risk. The market almost made it through the year as it was still up heading into December, but the combination of 4 interest rate hikes in the year coupled with considerable criticism of President Trumps behavior was just too much for the market by December. I view this as a partial victory as I had all the fundamentals right and came within less than a month of being right for the year when many felt the bears would gain control in early 2018.

  1. Battles between the federal government and states will continue over marijuana use but the cannabis industry will emerge as one to invest in.

During the year the legalization of marijuana for recreational use continued to increase on a state by state basis with the number increasing from 6 at the start of the year to 10 by years end. Use of medical marijuana is now legal in 33 states. Several other states, while not formally legalizing it have lowered restrictions on individual use. The industry remains at a very early stage, but numerous companies are now public, and the recent market correction has the shares of most of these at more reasonable levels. While I would urge great care in stock selection, it appears that the industry has emerged as one to consider investing in.

  1. At least one city will announce a new approach to urban transport.

In this prediction I cited the likelihood that at least one city would commit to testing a system of small footprint automated cars on a dedicated route (as discussed in our post on December 14, 2017) as this appears to be a more cost effective solution than rail, bus, Uber, etc. Kyoto has now announced that it signed an agreement to test the system offered by Wayfarer and the company is now out of stealth mode. Wayfarer expects to provide substantial capacity at a fraction of the cost of other alternatives: both in the initial cost of the infrastructure/equipment and the annual cost of running the system. Of course, once there is a live installation in Kyoto or one of their other prospective customers, the validity of this system will be authenticated (or not).

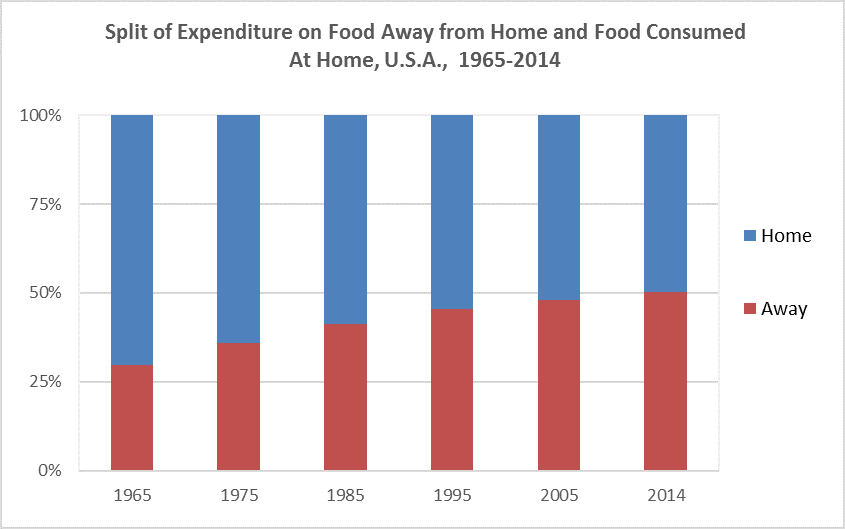
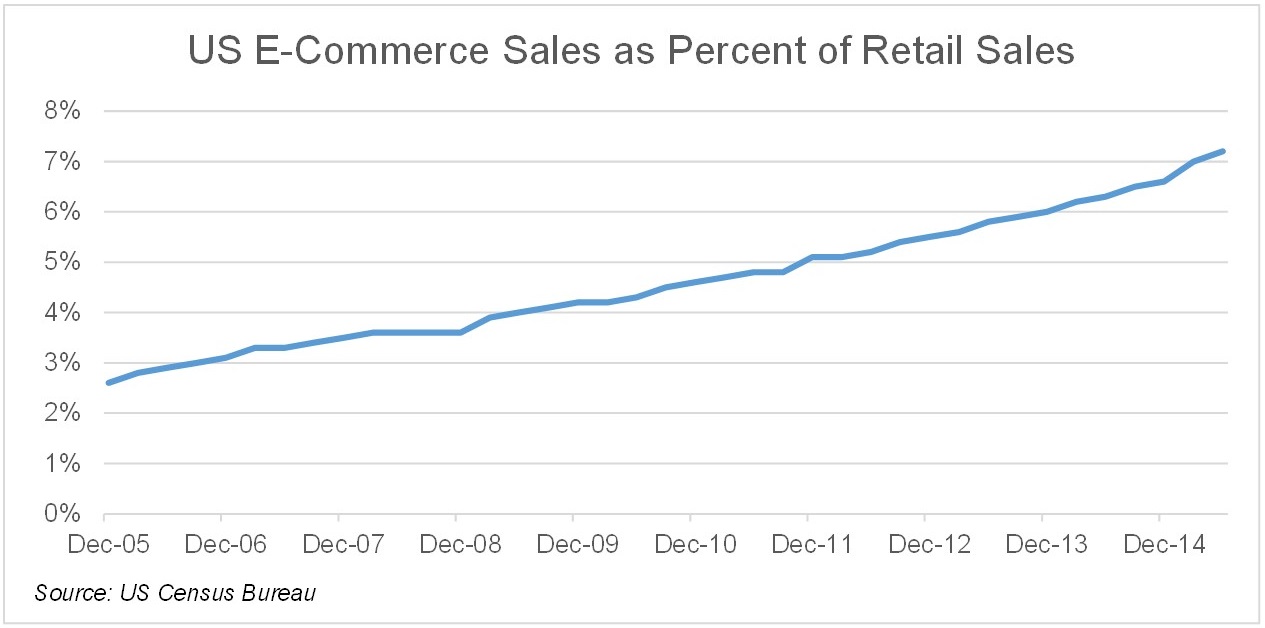
  1. Offline retailers will increase the velocity of moving towards omnichannel.

This forecast discussed both acquisitions of e-commerce companies by offline retailers (with Walmart leading the way) and introducing more online technology in physical stores. Walmart did continue its online buying spree in 2018 with major acquisitions of Art.com, Bare Necessities, Eloquii, Cornershop and Flipkart (the largest at $16 billion). In the case of the acquisitions that are online brands, Walmart intends to introduce these into their physical stores and continue to sell them online. Nordstrom has also moved further to integrate its online and offline business by taking valuable floor space in stores and repurposing it for online buyers to pick up and try on clothes they have purchased online. By placing the location in a very prominent spot, I’m sure Nordstrom is thinking it will help spur more customers to buy online. By having in store locations for picking up and trying on, Nordstrom should reduce returns, lower the cost of shipping, and bring additional customers into their stores (who otherwise might not visit them).

  1. Social Commerce will begin to emerge as a new category

Recall that social commerce involves the integration of social media with commerce through tactics like:

  1. A feed-based user experience
  2. Having friends’ actions impact one’s feed
  3. Following trend setters to see what they are buying, wearing, and/or favoring
  4. One click to buy

Now, about 25% – 30% of shoppers say that social platforms like Pinterest, Instagram, Facebook and Snapchat have influence over their purchases. On June 28, 2018 Snapchat began a program for its influencers to use Social Commerce through a tool that allows users to view a video from the influencer and then to swipe up on a product shown in the video to buy it. In September, The Verge reported that Instagram is developing a new app for social commerce. Pinterest and Facebook have been in the social commerce fray longer and have increasing success. It appears that 2018 was the year the social commerce wars accelerated.

  1. “The Empire Strikes Back”: automobile manufacturers will begin to take steps to reclaim use of its GPS.

Carmakers face a serious problem regarding their built-in navigation systems. Consumers are forced to pay hundreds of dollars for them and then use free apps on their phones like Waze or Google maps instead. This does not endear them to consumers. The problem is that carmakers are not great at software design but have been reluctant to use third party providers for their GPS and entertainment. Now, the Renault-Nissan-Mitsubishi Alliance has agreed to design Google’s Android OS, including Google navigation, into their next generation cars expected starting in 2021. This is a win for users as that will provide a competent GPS that utilizes the existing screen in cars as opposed to having to rely on your phone app for navigation.

In another win for consumers, Amazon and Telenav (a connected car and location based services provider) announced a significant partnership today, January 7, 2019. As part of it, Amazon’s voice assistant will now be part of Telenavs in-car navigation systems. With this included, Telenav’s next generation system will enable its customers, like General Motors, to provide a “smart assistant” thereby making the system included with cars the one to use rather than one’s phone apps.

Stay tuned for my top ten predictions for 2019…but remember that I have already said the 4 stocks recommended for 2018 will remain on the list.

Re-cap of 2017 Top Ten Predictions

I started 2017 by saying:

When I was on Wall Street I became very boring by having the same three strong buy recommendations for many years…  until I downgraded Compaq in 1998 (it was about 30X the original price at that point). The other two, Microsoft and Dell, remained strong recommendations until I left Wall Street in 2000. At the time, they were each well over 100X the price of my original recommendation. I mention this because my favorite stocks for this blog include Facebook and Tesla for the 4th year in a row. They are both over 5X what I paid for them in 2013 ($23 and $45, respectively) and I continue to own both. Will they get to 100X or more? This is not likely, as companies like them have had much higher valuations when going public compared with Microsoft or Dell, but I believe they continue to offer strong upside, as explained below.

Be advised that my top ten for 2018 will continue to include all three picks from 2017. I’m quite pleased that I continue to be fortunate, as the three were up an average of 53% in 2017. Furthermore, each of my top ten forecasts proved pretty accurate, as well!

I’ve listed in bold the 2017 stock picks and trend forecasts below, and give a personal evaluation of how I fared on each. For context, the S&P was up 19% and the Nasdaq 28% in 2017.

  1. Tesla stock appreciation will continue to outpace the market. Tesla, once again, posted very strong performance.  While the Model 3 experienced considerable delays, backorders for it continued to climb as ratings were very strong. As of mid-August, Tesla was adding a net of 1,800 orders per day and I believe it probably closed the year at over a 500,000-unit backlog. So, while the stock tailed off a bit from its high ($385 in September), it was up 45% from January 3, 2017 to January 2, 2018 and ended the year at 7 times the original price I paid in 2013 when I started recommending it. Its competitors are working hard to catch up, but they are still trailing by quite a bit.
  2. Facebook stock appreciation will continue to outpace the market. Facebook stock appreciated 57% year/year and opened on January 2, 2018 at $182 (nearly 8 times my original price paid in 2013 when I started recommending it). This was on the heels of 47% revenue growth (through 3 quarters) and even higher earnings growth.
  3. Amazon stock appreciation will outpace the market. Amazon stock appreciated 57% in 2017 and opened on January 2, 2018 at $1,188 per share. It had been on my recommended list in 2015 when it appreciated 137%. Taking it off in 2016 was based on Amazon’s stock price getting a bit ahead of itself (and revenue did catch up that year growing 25% while the stock was only up about 12%). In 2017, the company increased its growth rate (even before the acquisition of Whole Foods) and appeared to consolidate its ability to dominate online retail.
  4. Both online and offline retailers will increasingly use an omnichannel approach. Traditional retailers started accelerating the pace at which they attempted to blend online and offline in 2017. Walmart led, finally realizing it had to step up its game to compete with Amazon. While its biggest acquisition was Jet.com for over $3 billion, it also acquired Bonobos, Modcloth.com, Moosejaw, Shoebuy.com and Hayneedle.com, creating a portfolio of online brands that could also be sold offline. Target focused on becoming a leader in one-day delivery by acquiring Shipt and Grand Junction, two leaders in home delivery. While I had not predicted anything as large as a Whole Foods acquisition for Amazon, I did forecast that they would increase their footprint of physical locations (see October 2016 Soundbytes). The strategy for online brands to open “Guide” brick and mortar stores ( e.g. Tesla, Warby Parker, Everlane, etc.) continued at a rapid pace.
  5. A giant piloted robot will be demo’d as the next form of entertainment. As expected, Azure portfolio company, Megabots, delivered on this forecast by staging an international fight with a giant robot from Japan. The fight was not live as the robots are still “temperamental” (meaning they occasionally stop working during combat). However, interest in this new form of entertainment was incredible as the video of the fight garnered over 5 million views (which is in the range of an average prime-time TV show). There is still a large amount of work to be done to convert this to an ongoing form of entertainment, but all the ingredients are there.
  6. Virtual and Augmented reality products will escalate. Sales of VR/AR headsets appear to have well exceeded 10 million units for the year with some market gain for higher-end products. The types of applications have expanded from gaming to room design (and viewing), travel, inventory management, education, healthcare, entertainment and more. While the actual growth in unit sales fell short of what many expected, it still was substantial. With Apple’s acquisition of Vrvana (augmented reality headset maker) it seems clear that Apple plans to launch multiple products in the category over the next 2-3 years, and with Facebook’s launch of ArKIT, it’s social AR development platform, there is clearly a lot of focus and growth ahead.
  7. Magic Leap will disappoint in 2017. Magic Leap, after 5 years of development and $1.5 billion of investment, did not launch a product in 2017. But, in late December they announced that their first product will launch in 2018. Once again, the company has made strong claims for what its product will do, and some have said early adopters (at a very hefty price likely to be in the $1,500 range) are said to be like those who bought the first iPod. So, while it disappointed in 2017, it is difficult to tell whether or not this will eventually be a winning company as it’s hard to separate hype from reality.
  8. Cable companies will see a slide in adoption. According to eMarketer, “cord cutting”, i.e. getting rid of cable, reached record proportions in 2017, well exceeding their prior forecast. Just as worrisome to providers, the average time watching TV dropped as well, implying decreased dependence on traditional consumption. Given the increase now evident in cord cutting, UBS (as I did a year ago) is now forecasting substantial acceleration of the decline in subscribers. While the number of subscribers bounced around a bit between 2011 and 2015, when all was said and done, the aggregate drop in that four-year period was less than 0.02%. UBS now forecasts that between the end of 2016 and the end of 2018 the drop will be 7.3%. The more the industry tries to offset the drop by price increases, the more they will accelerate the pace of cord cutting.
  9. Spotify will either postpone its IPO or have a disappointing one. When we made this forecast, Spotify was expected to go public in Q2 2017. Spotify postponed its IPO into 2018 while working on new contracts with the major music labels to try to improve its business model. It was successful in these negotiations in that the labels all agreed to new terms. Since the terms were not announced, we’ll need to see financials for Q1 2018 to better understand the magnitude of improvement. In the first half of the year, Spotify reported that gross margins improved from 16% to 22%, but this merely cut its loss level rather than move the company to profitability. It has stated that it expects to do a non-traditional IPO (a direct listing without using an investment bank) in the first half of 2018. If the valuation approaches its last private round, I would caution investors to stay away, as that valuation, coupled with 22% gross margins (and over 12% of revenue in sales and marketing cost to acquire customers), implies net margin in the mid-single digits at best (assuming they can reduce R&D and G&A as a percent of revenue). This becomes much more challenging in the face of a $1.6 billion lawsuit filed against it for illegally offering songs without compensating the music publisher. Even if they managed to successfully fight the lawsuit and improve margin, Spotify would be valued at close to 100 times “potential earnings” and these earnings may not even materialize.
  10. Amazon’s Echo will gain considerable traction in 2017. Sales of the Echo exploded in 2017 with Amazon announcing that it “sold 10s of millions of Alexa-enabled devices” exceeding our aggressive forecast of 2-3x the 4.4 million units sold in 2016. The Alexa app was also the top app for both Android and iOS phones. It clearly has carved out a niche as a new major platform.

Stay tuned for my top 10 predictions of 2018!


SoundBytes

  • In our December 20, 2017 post, I discussed just how much Steph Curry improves teammate performance and how effective a shooter he is. I also mentioned that Russell Westbrook leading the league in scoring in the prior season might have been detrimental to his team as his shooting percentage falls well below the league average. Now, in his first game returning to the lineup, Curry had an effective shooting percentage that exceeded 100% while scoring 38 points (this means scoring more than 2 points for every shot taken). It would be interesting to know if Curry is the first player ever to score over 35 points with an effective shooting percentage above 100%! Also, as of now, the Warriors are scoring over 15 points more per game this season with Curry in the lineup than they did for the 11 games he was out (which directly ties to the 7.4% improvement in field goal percentage that his teammates achieve when playing with Curry as discussed in the post).

Will Grocery Shopping Ever be the Same?

Will grocery shopping ever be the same?

Dining and shopping today is very different than in days gone by – the Amazon acquisition of Whole Foods is a result

“I used to drink it,” said Andy Warhol once of Campbell’s soup. “I used to have the same lunch every day, for 20 years, I guess, the same thing over and over again.” In Warhol’s signature medium, silkscreen, the artist reproduced his daily Campbell’s soup can over and over again, changing only the label graphic on each one.

When I was growing up I didn’t have exactly the same thing over and over like Andy Warhol, but virtually every dinner was at home, at our kitchen table (we had no dining room in the 4-room apartment). Eating out was a rare treat and my father would have been abhorred if my mom brought in prepared food. My mom, like most women of that era, didn’t officially work, but did do the bookkeeping for my dad’s plumbing business. She would shop for food almost every day at a local grocery and wheel it home in her shopping cart.

When my wife and I were raising our kids, the kitchen remained the most important room in the house. While we tended to eat out many weekend nights, our Sunday through Thursday dinners were consumed at home, but were sprinkled with occasional meals brought in from the outside like pizza, fried chicken, ribs, and Chinese food. Now, given a high proportion of households where both parents work, eating out, fast foods and prepared foods have become a large proportion of how Americans consume dinner. This trend has reached the point where some say having a traditional kitchen may disappear as people may cease cooking at all.

In this post, I discuss the evolution of our eating habits, and how they will continue to change. Clearly, the changes that have already occurred in shopping for food and eating habits were motivations for Amazon’s acquisition of Whole Foods.

The Range of How We Dine

Dining can be broken into multiple categories and families usually participate in all of them. First, almost 60% of dinners eaten at home are still prepared there. While the percentage has diminished, it is still the largest of the 4 categories for dinners. Second, many meals are now purchased from a third party but still consumed at home. Given the rise of delivery services and greater availability of pre-cooked meals at groceries, the category spans virtually every type of food. Thirdly, many meals are purchased from a fast food chain (about 25% of Americans eat some type of fast food every day1) and about 20% of meals2 are eaten in a car. Finally, a smaller percentage of meals are consumed at a restaurant. (Sources: 1Schlosser, Eric. “Americans Are Obsessed with Fast Food: The Dark Side of the All-American Meal.” CBSNews. Accessed April 14, 2014 / 2Stanford University. “What’s for Dinner?” Multidisciplinary Teaching and Research at Stanford. Accessed April 14, 2014).

The shift to consuming food away from home has been a trend for the last 50 years as families began going from one worker to both spouses working. The proportion of spending on food consumed away from home has consistently increased from 1965-2014 – from 30% to 50%.

Source: Calculated by the Economic Research Service, USDA, from various data sets from the U.S. Census Bureau and the Bureau of Labor Statistics.

With both spouses working, the time available to prepare food was dramatically reduced. Yet, shopping in a supermarket remained largely the same except for more availability of prepared meals. Now, changes that have already begun could make eating dinner at home more convenient than eating out with a cost comparable to a fast food chain.

Why Shopping for Food Will Change Dramatically over the Next 30 Years

Eating at home can be divided between:

  1. Cooking from scratch using ingredients from general shopping
  2. Buying prepared foods from a grocery
  3. Cooking from scratch from recipes supplied with the associated ingredients (meal kits)
  4. Ordering meals that have previously been prepared and only need to be heated up
  5. Ordering meals from a restaurant that are picked up or delivered to your home
  6. Ordering “fast food” type meals like pizza, ribs, chicken, etc. for pickup or delivery.

I am starting with the assumption that many people will still want to cook some proportion of their dinners (I may be romanticizing given how I grew up and how my wife and I raised our family). But, as cooking for yourself becomes an even smaller percentage of dinners, shopping for food in the traditional way will prove inefficient. Why buy a package of saffron or thyme or a bag of onions, only to see very little of it consumed before it is no longer usable? And why start cooking a meal, after shopping at a grocery, only to find you are missing an ingredient of the recipe? Instead, why not shop by the meal instead of shopping for many items that may or may not end up being used.

Shopping by the meal is the essential value proposition offered by Blue Apron, Plated, Hello Fresh, Chef’d and others. Each sends you recipes and all the ingredients to prepare a meal. There is little food waste involved (although packaging is another story). If the meal preparation requires one onion, that is what is included, if it requires a pinch of saffron, then only a pinch is sent. When preparing one of these meals you never find yourself missing an ingredient. It takes a lot of the stress and the food waste out of the meal preparation process. But most such plans, in trying to keep the cost per meal to under $10, have very limited choices each week (all in a similar lower cost price range) and require committing to multiple meals per week. Chef’d, one of the exceptions to this, allows the user to choose individual meals or to purchase a weekly subscription. They also offer over 600 options to choose from while a service like Blue Apron asks the subscriber to select 3 out of 6 choices each week.

Blue Apron meals portioned perfectly for the amount required for the recipes

My second assumption is that the number of meals that are created from scratch in an average household will diminish each year (as it already has for the past 50 years). However, many people will want to have access to “preferred high quality” meals that can be warmed up and eaten, especially in two-worker households. This will be easier and faster (but perhaps less gratifying) than preparing a recipe provided by a food supplier (along with all the ingredients). I am talking about going beyond the pre-cooked items in your average grocery. There are currently sources of such meals arising as delivery services partner with restaurants to provide meals delivered to your doorstep. But this type of service tends to be relatively expensive on a per meal basis.

I expect new services to arise (we’ve already seen a few) that offer meals that are less expensive prepared by “home chefs” or caterers and ordered through a marketplace (this is category 4 in my list). The marketplace will recruit the chefs, supply them with packaging, take orders, deliver to the end customers, and collect the money. Since the food won’t be from a restaurant, with all the associated overhead, prices can be lower. Providing such a service will be a source of income for people who prefer to work at home. Like drivers for Uber and Lyft, there should be a large pool of available suppliers who want to work in this manner. It will be very important for the marketplaces offering such service to curate to ensure that the quality and food safety standards of the product are guaranteed. The availability of good quality, moderately priced prepared meals of one’s choice delivered to the home may begin shifting more consumption back to the home, or at a minimum, slow the shift towards eating dinners away from home.

Where will Amazon be in the Equation?

In the past, I predicted that Amazon would create physical stores, but their recent acquisition of Whole Foods goes far beyond anything I forecast by providing them with an immediate, vast network of physical grocery stores. It does make a lot of sense, as I expect omnichannel marketing to be the future of retail.  My reasoning is simple: on the one hand, online commerce will always be some minority of retail (it currently is hovering around 10% of total retail sales); on the other hand, physical retail will continue to lose share of the total market to online for years to come, and we’ll see little difference between e-commerce and physical commerce players.  To be competitive, major players will have to be both, and deliver a seamless experience to the consumer.

Acquiring Whole Foods can make Amazon the runaway leader in categories 1 and 2, buying ingredients and/or prepared foods to be delivered to your home.  Amazon Fresh already supplies many people with products that are sourced from grocery stores, whether they be general food ingredients or traditional prepared foods supplied by a grocery. They also have numerous meal kits that they offer, and we expect (and are already seeing indications) that Amazon will follow the Whole Foods acquisition by increasing its focus on “meal kits” as it attempts to dominate this rising category (3 in our table).

One could argue that Whole Foods is already a significant player in category 4 (ordering meals that are prepared, and only need to be heated up), believing that category 4 is the same as category 2 (buying prepared meals from a grocery). But it is not. What we envision in the future is the ability to have individuals (who will all be referred to as “Home Chefs” or something like that) create brands and cook foods of every genre, price, etc. Customers will be able to order a set of meals completely to their taste from a local home chef. The logical combatants to control this market will be players like Uber and Lyft, guys like Amazon and Google, existing recipe sites like Blue Apron…and new startups we’ve never heard of.

Next Gen Selling vs Old (or “Traditional”) Methods

In this post I want to compare the buying experiences I’ve had recently when purchasing from an older generation company vs a newer one. I think it highlights the fact that ecommerce based models can create a much better buying experience than traditional brick and mortar sellers when coupled with a multi-channel approach. The two companies I want to highlight are Tesla (where my wife recently purchased a car) and Warby Parker (where I recently bought a pair of glasses). I’ll compare them to Mercedes and LensCrafters but you should understand it almost doesn’t matter which older gen companies I compared them to, so just consider the ones I’ve chosen (due to recent personal experience) as representative of their industries.

Controlling the buying experience

Warby Parker began opening retail “Guideshops” a few years ago. I recently went into one and was very pleased with the experience. They displayed all the frames they have and there were only two price categories which included the prescription lenses and the frames, $95 and $145. I selected a frame, went over to the desk and received assistance in completing the transaction. The person assisting me took one measurement of my eyes and then suggested I get slightly better lenses for a charge of $30 which I think was only necessary due to my particular prescription. There were no other charges, no salesperson, no other upsells, no waiting while the glasses are being made. Once I paid by credit card, the glasses were put in their cue to be made at their factory and shipped to my home within 10 days (with no shipping charge) and my receipt was sent by email rather than printed. From the time I entered the store until I left was about 10 minutes.

Compare this experience to buying a pair of glasses at LensCrafters. At LensCrafters the price range of frames is all over the map without any apparent reason except many carry a designer brand logo (but are unlikely to have been designed by that designer). To me the Warby Parker frames are as good or better looking as far more expensive ones at LensCrafters.  Even if you select a frame at LensCrafters that costs $95-$300 or more, the lenses are not included. A salesperson then sits with you and begins the upselling process. Without going into all the details, suffice it to say that it is very difficult to discern what is really needed and therefore it is hard to walk out of the store without spending $100-$300 more than the cost of the frame. Further, since the glasses are made at the store you come back in a few hours to pick them up (of course this is a positive if you want them right away; I usually don’t care).  I have typically spent well over an hour in the buying process plus going for a coffee for the 2 hours or so it took for them to make the lenses.

Tesla has been very adamant about owning and controlling their physical retail outlets rather than having their cars sold by independent dealerships. This gives them multiple advantages as they completely control the buying experience, eliminate competition between dealers, reduce distribution cost and can decide what the purpose of each location is and how it should look. They have also eliminated having cars to sell on the lot but instead use an ecommerce model where you order a car exactly the way you want it and it gets produced for you and brought to the Tesla physical location you want for pickup. Essentially, they have designed two types of physical stores: one that has a few demo models to enable test drives and one that also has a customer service department. This means that the latter is a much smaller size than a traditional car dealership (as it doesn’t need space for new car inventory on the lot) and the former is much smaller than that. The showroom approach occupies such a small footprint that Tesla has been able to locate showrooms in high foot traffic (high cost per foot) locations like malls.  In their sites at the Stanford Mall and on Santana Row (two of the most expensive per square foot), Tesla kept the cars for test drives in the parking lots (at a fraction of the cost of store footage). When my wife decided to buy her second Tesla (trading in the older one) we spent about an hour at the dealer as there was no negotiation on price, the car could be configured to her exact specification on a screen at the dealership (or at home) and would be manufactured for her. There were no upsell attempts, no competing dealers to visit, and really no salesperson but rather a facilitator (much like at Warby Parker) that answered questions.

I bought my new car from Mercedes and had a much less pleasant buying experience. It starts with the fact that the price on the car isn’t the real price. This means that one needs to try to go to multiple dealers as well as online to get a better handle on what the real price is as the dealers are difficult to trust. Each dealer now has its own online person (or team) but this is actually still buying from a dealer. There is also a strong encouragement to buy a car in inventory (on the lot) and the idea of configuring the way one wants and ordering it is discouraged. The cars on the lot are frequently configured with costly (highly profitable) options that are unnecessary so that even with a discount from list one typically spends more than ordering it with only options you want and paying closer to list. After multiple days (and many, many hours) spent online and visiting dealerships I decided to replicate the Tesla concept and order a 2016 model to be built exactly how I wanted. Because I spent many hours shopping around, I still was able to get a price that was an extra $4,000 off list from what I had been offered if I bought a 2015 off the lot. The car was the color I wanted, only had the options I wanted and would have a higher resale value because of being a 2016. Since the list price had not increased and there were no unneeded options on the car I actually saved about $10,000 vs taking one off the lot with the lower discount even though all additional options I wanted were bundled with it.

Receiving the product

In the Warby Parker example, the glasses were shipped to my home in a very well designed box that enhanced their brand. The box contained an upscale case and a card that said: “For every pair of glasses sold, a pair is distributed to someone in need.” Buying at LensCrafters meant returning to the store for the glasses. The case included was a very cheap looking one (creating an upsell if one wanted a nicer case) and there was no packaging other than the case. However, I did get the glasses the same day and someone sat with me to make sure they fit well on my ears (fit was not an issue for me for the Warby Parker glasses but could be for some people).

On the automobile side, the car pickup at Tesla was a much better experience than the one at Mercedes. At Tesla, my wife and I spent a little over an hour at the pickup. We spent about 20 minutes on paperwork and 45 minutes getting a walk through on how various options on the car work. There were no attempts to upsell us on anything. At Mercedes the car pickup experience took nearly 4 hours and was very painful as over 3 hours of it was spent on paperwork and attempts at a variety of upsells. To be fair, we had decided to lease this car and that time occupied a portion of the paperwork. But the attempted upsells were extreme. The most ludicrous was trying to get us to buy an extended warranty when the included warranty exceeded the length of the lease. I could understand that it might be of value to some but, in our case, we told the lease person that we were only doing the lease so we wouldn’t own the car at the end of it. There were also upsells on various online services, and a number of other items. The time this took meant we did not have enough time left to go over all the features of the car. This process was clearly the way each person had been trained and was not a function of the particular people we dealt with. The actual salesperson who sold me the car was extremely nice but was working within a system that is not geared towards the customer experience as dealers can’t count on buyers returning even if they buy the same brand again.

Summary

There is a significant advantage being created by new models of doing business which control the complete distribution chain. Their physical locations have a much smaller footprint than traditional competitors which allow them to put their shops in high traffic locations without incurring commensurate cost. They consolidate inventory into a centralized location which reduces inventory cost, storage and obsolescence. They completely control the buying experience and understand that customer satisfaction leads to higher life time value of a customer.


SoundBytes

In my SoundByte post dated April 9, I discussed several of the metrics that caused me to conclude that Stephen Curry should be the 2014-15 season MVP. He subsequently received the award but it still appeared that many did not fully understand his value. I thought it was well captured in the post by looking at EFG, or effective shooting percentage (where a three point shot made counts as 1.5 two point shots made since its worth 50% more points), plus/minus and several other statistics not widely publicized. This year, Curry has become even better and I realized one other statistic might help highlight his value in an even better way, points created above the norm (PAN).

I define PAN as the extra points created versus an average NBA player through more effective shooting. It is calculated using this formula:

PAN= 2 x (the players average number of shots per game) x (players EFG- league norm EFG)

The league’s effective shooting percentage as of December 6 is 49.0%. Since Curry’s effective shooting percentage is 66.1% as of today date, the difference is 17.1%. Curry has been averaging 20.2 shots per game this year so his PAN = 2 x 20.2 x 17.1%= 6.9. This means Curry’s shooting alone (excluding foul shots) adds about 7 points per game to his team versus an average shooter. But, because Curry is unselfish and is often double teamed, he also contributes heavily to helping the team as a whole be more effective shooters. This leads to a team PAN of 14.0. Which means the Warriors score an extra 14 points a game due to more effective shooting.

Interestingly, when you compare this statistic to other league leaders and NBA stars, Curry’s contribution becomes even more remarkable. While Curry add about 7 points per game to his team versus an average shooter, James Harden, Dwayne Wade and Kobe Bryant are all contributing less than the average player. Given Curry’s wildly superior efficiency he is contributing almost twice as much as Kevin Durant.

Efficiency

With Curry’s far superior individual and team contribution to shooting efficiency, it is not surprising that the Warriors are outscoring their opponents by such record breaking margins.

To further emphasize how much Curry’s PAN impacts his team we compared him to Kobe Bryant. The difference in their PANs is 11.8 points per game. How much would it change the Lakers record if they had these extra 11.8 points per game and all else was equal? It would move the Lakers from the second worst point differential (only Philadelphia trails them) to 10th in the league and 4th among Western conference teams. Since point differential correlates closely to team record, that might mean the Lakers would be competing for home court in the playoffs instead of the worst record in the league!

OmniChannel Selling

The latest trend in retail is the concept of “OmniChannel” selling. While many players have been engaged in this arena for some time, there has been acceleration in the practice. Online retailers are now attempting to find ways to add an in-store experience and many brands, larger retailers, and numerous smaller ones have added more of a push towards e-tail. Additionally, direct sales through TV (QVC, Home Shopping, etc.), telemarketing and consumer-to-consumer fill out the spectrum of options.

The concept of selling through multiple and diverse channels is not a new concept, but the increased integration of in-store and e-tail channels is becoming more sophisticated. With 93% of consumer sales still occurring offline, many e-tailers understand that a physical presence can help escalate sales. Similarly, with this percentage shrinking and with $1.6 trillion in e-commerce sales expected this year, brick and mortar cannot ignore the importance of being online. Earlier this year, Square, in partnership with Bigcommerce, announced a new integration that provides merchants with a simple and seamless way to expand their businesses online. Similarly, Shopify’s POS system allows physical retailers to easily sell online.

US retail sales

E-Tailers Move to Physical Retail

This post focuses on the trend of e-tailers moving into physical retail and when and why it can work. E-tailers fall into three categories: those that only sell other company’s brands, those that are creating their own brand, and those that sell other brands as well as their own.

The dominant player in the first category is Amazon. ver time, it has built an overwhelming network of distribution centers geared towards efficiently shipping one or more items to an individual consumer. Now it has begun experimenting with physical locations, the first of which opened on the Purdue campus in February with additional locations being planned on other college campuses. There are also reports that it will follow this with other types of store openings. Given its widespread distribution centers, the company already has significant capability to inexpensively pick and pack goods for an individual consumer. But, despite limiting most shipments to one zone, there is still a relatively large cost to deliver a single order to an individual household. If it can begin getting non-Amazon Prime customers to come to a convenient location for pickup (Amazon locker or store), shipping cost could be reduced quite a bit. Further, having physical locations will undoubtedly add to the company’s sales and its brand. Since it would not need to stock the stores the way a traditional retailer does, it could capture the efficiency associated with centralized inventory locations combined with the brick-and-mortar efficiency of shipping a large number of goods to one location (probably in an Amazon-owned truck). I expect to see a major expansion of Amazon into physical locations over the next 5 years.

Trading High Shipping Cost for Brick and Mortar Cost

In e-commerce companies that we know well, fulfillment (picking and packing) and shipping can be as much as 40% or more of COGS.  Moving to one’s own physical retail stores adds substantial cost but removes shipping cost. Most e-tailers now offer some version of free shipping, but whether the seller or the customer pays for shipping, it is a major factor. What this means is that such an e-tailer can spend that money on its own stores or by offering to discount its products to a third-party brick and mortar reseller without necessarily incurring any loss in gross margin dollars (of course a larger discount may be required). Even if gross margins are lower when partnering with a third party brick and mortar retailer, it can still be as profitable as the e-tailer’s online sales since  brick and mortar stores already attract many customers whereas online sales normally require a marketing spend to create greater volume.

The OmniChannel Approach for Branded Product

Amazon is in a unique position because of its size. Although there are other e-tailers of third-party products with sufficient size to open their own physical locations, the bigger opportunity to increase sales resides with e-tailers that have their own branded product. A great example of this is Warby Parker, an emerging brand in eyewear. About 2 ½ years ago it opened its first brick and mortar store in New York City. What it found is that this not only added to its client base through in-store purchases, but also drove additional online sales. Why would this occur? Besides the obvious fact that many people still prefer buying from a physical location, trying on a pair of frames and having them fitted to your needs improves the experience. The inability to do this online may have inhibited some customers from purchasing. But once you have had the opportunity to have eyeglasses fitted to your requirements, it is much easier to buy subsequent pairs online with the knowledge that the fit should be appropriate.  The same issue of good fit applies to shoes and clothes.

Fit is one reason why Bonobos, an online e-tailer of men’s clothes, began opening shops.  But unlike Warby Parker, the Bonobos shops are “Guideshops” (where clothing can be tried on and then ordered for delivery). By taking this approach, Bonobos keeps inventory centralized and the stores much smaller (only requiring one unit of each SKU) but gains the benefit of addressing people less comfortable with shopping online and also insuring that the clothes fit. By locating the shops in malls and other high traffic areas, Bonobos gains exposure to a fair amount of foot traffic making the stores another customer acquisition vehicle. Note that the stores we expect Amazon to open are essentially Guideshops but on a much larger scale.

Online Brands Partnering with Brick and Mortar Retailers Will Continue to Increase

Bonobos has also partnered with Nordstrom but in its case it’s simply as another brand offered in Nordstrom stores.  In August, Warby Parker announced their first retail partnership with Nordstrom. Once Nordstrom saw the benefits of OmniChannel brands, it acquired Trunk Club (another men’s clothing e-tailer). Subsequent to the acquisition, it began adding space in some of its stores for men to come in, get fitted and talk to a stylist about preferences. The stylist then acts as a personal shopper and picks Trunk Club clothes for the customer to try. This results in a much larger average order than online sales for Trunk Club. In this case the customer takes the clothes with him. Again, once this occurs, buying subsequent items online becomes easier as there is more confidence that the fit will be good. Now Trunk Club is entering the women’s clothing market to compete with the successful online brand, Stitchfix.

Shoes are even more difficult to buy without trying on than eyeglasses or clothes. As a result, Shoes of Prey, which offers women the ability to design their own custom shoes, has also opened Guideshops but in their case they are in known retailers like Nordstrom. This makes sense to me as I prefer buying my first pair of shoes in a store and “refills” online. And now most brands that once were only available in brick and mortar stores can be purchased online. For the first pair I sometimes try on 8-10 styles/sizes before finding one that satisfies my needs (this is a major problem for Zappos who appears to have about a 35% return rate. If I try to buy a second pair a few months later from the same store, odds are they won’t have it. Instead, it’s seamless to go online for the follow-on pair. With the acquisition of Trunk Club, Nordstrom has taken a strong initiative in blending the online/offline experience.

Notice the difference between Warby Parker and Bonobos versus Trunk Club. Warby Parker and Bonobos, in addition to being another brand at third party retailers, opened their own branded stores whereas Trunk Club began expanding into an existing major retailer (albeit its new parent) as a service to customers. Opening your own stores can involve substantial capital expenditures and large ongoing operating cost. The alternative of getting one’s online branded product to be carried by a retailer reduces risk and saves substantial fixed cost. But, there’s a trade-off; the brand gives up margin as the third-party retailer will be buying at a discount. Merely getting into stores does not guarantee added success. In the store, the control of the purchase experience moves to the retailer so it becomes very important that the brand is comfortable with the way the retailer will position its products in terms of shelf space and point of purchase marketing through materials and/or sales people in the store. Julep, a successful online brand in the cosmetics space, has partly solved the issue of positioning by partnering with QVC as well as several brick and mortar retailers including Nordstrom. A strong advantage of a QVC partnership is that “shelf space” allocated to the brand consists of a brand spokesperson going on the TV show to market the brand to a very large audience. Resulting sales occur immediately through QVC but other channels also benefit.

Advantages to the Retailer of Carrying Online Brands in Their Physical Stores

An online brand should have substantial information regarding customer demand. It knows the geographies in which its products sell best, the demographics of its customers, which of its products will be in greater demand, etc. It also may have very substantial traffic to its site, to which it can offer the alternative of buying at physical retail. Furthermore, unlike physical retail, e-commerce retailers have a deeper understanding of customer acquisition metrics and customer conversion funnel, and can readily A/B test various elements on their site. Such insights can help a physical store decide which items to carry, volumes needed in different geographies and more.  It can also mean the online brand will drive additional customers to their store. A brand like Le Tote, one of Azure’s portfolio companies, which offers women a subscription that entitles them to rent everyday clothes, has even more data as an average customer will have worn over 50 of their clothing items over the course of a year. Since the company receives ongoing feedback on most of the items it ships, it has very substantial data on customer preferences regarding third party brands as well as house brands. The company believes that it is likely to form one or more partnerships with brick and mortar retailers to begin selling its “house” brands.

Intelligently Moving to OmniChannel Selling Makes Sense for Many Players

Given the growing synergism between online and offline retail, there is substantial opportunity for heightened growth for startups that are able to intelligently emerge from an e-tail only model to one that uses both online and brick and mortar distribution. If the e-tailer has its own branded goods, then this can be done through partnering with existing stores. In executing this strategy, it is important to ensure that the presentation and knowledge of the products placed in such stores are sufficient to enable customers of the store to adequately learn about the products. In turn, the e-tailer can provide a deeper understanding of the customer in order to accelerate growth and improve sales conversions in all channels. The abundance of data being provided from online channels as well as in-store tracking can provide significant insight to retailers, and startups that best capitalize on this information are better positioned for success.  Startups that are able to capitalize on this trend can experience a significant escalation in growth.

SoundBytes

  • The recent acquisition of EMC by Dell brought back memories of my thesis while still on Wall Street as a top analyst covering technology. In 1999 I predicted that successful PC companies would hit roadblocks to growth and profitability if they didn’t move “Beyond the Box”. As we’ve seen the prediction proved true as Apple thrived by doing so and others like Compaq, Dell, Gateway and HP ran into difficulty. I’m not as close to it now but the merger of these two companies seems to create obvious cross-selling opportunities and numerous efficiencies that should benefit the combined entity.