The Warriors Revisited

It’s been a while since I posted, so I’m going to try to get 2 new ones out over the next 30 days. This one will be a return to my favorite sports team: The Warriors (or simply “Dubs”). It addresses several topics that have been heavily discussed in the media:

  • Should The Dubs trade Kuminga?
  • Have the The Dubs have abandoned their “2-track timeline (2TT)”?
  • Why did The Dubs trade Poole and others for Chris Paul?
  • What are the chances that The Dubs will win the title this upcoming season?

Should The Dubs trade Kuminga: Why Suggested Kuminga Trades Don’t Make Sense

A number of suggested trades that include Kuminga (and often Chris Paul) have been suggested in the media. We regard all the ones we’ve seen as substantially sub-optimal. First, any suggested trade that includes Paul would likely prevent the team from getting to their financial target (of under the luxury tax second apron) in the 24-25 season. If they don’t get under that apron, they will be heavily restricted in signing free agents and in what types of trades they can do.

Kuminga has progressed substantially. He was especially good in the final part of last season and should be better this year. He appears on the road to being a star in the NBA. Most of the suggested trades were for players who have been in the league a lot longer, are on larger contracts that were not about to expire (defeating the Dubs ability to get under the second apron penalty level in 2024-25), or for players that I believe Kuminga is already as good as or better then. Given that he is still early in his career we believe that he is likely to significantly improve from here. The fact that Kerr barely played him in last year’s playoffs is the reason trades are being suggested. The “experts” who are suggesting them are ignoring how good he was defensively and offensively in the second half of last season.  I think Kerr not using him in the playoffs was an error but motivated by the fact he is still very young, and Kerr wanted to add motivation for him to improve his rebounding.

All statistics from the Basketball Reference Guide

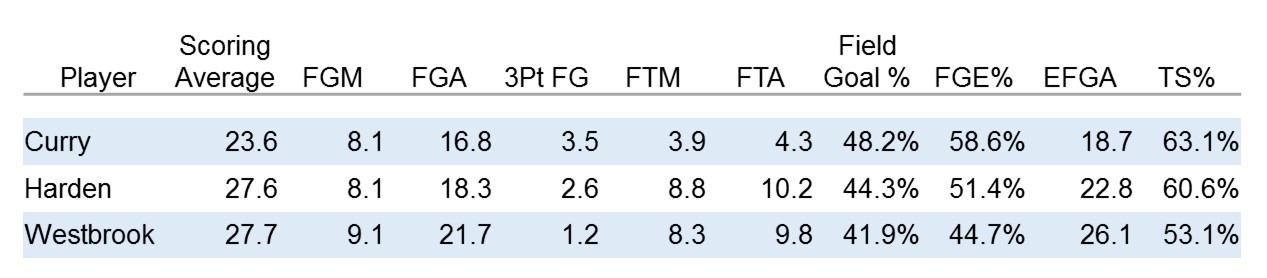
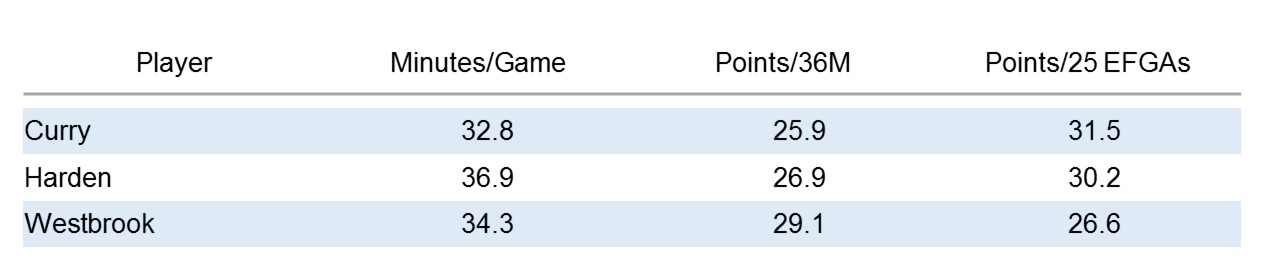
There are so many suggestions to trade Kuminga that it’s impossible to review them all. Instead, I’ll provide 2 typical examples to illustrate why they don’t make sense for the Warriors. One example is a proposed trade for Anunoby. Since Anunoby will make $12M more than Kuminga next season, the Warriors would also need to give up Moody and Payton (to match salaries). If they do that the cap rules would require signing minimum salary replacements who likely would be of lower quality than Moody and Payton, a major negative of such a trade. But even comparing Kuminga to Anunoby straight up is interesting. Since Anunoby played almost 36 minutes per game last year and Kuminga less than 21, the fairest comparison is to use stats per 36 minutes. Assuming they played the same amount of time each game, Kuminga would have averaged more points, rebounds and assists than Anunoby despite being 6 years younger and only in his second season (whereas Anunoby was in his 6th ). Since most young players improve dramatically between their 2nd and 6th seasons, Kuminga likely has significantly more upside than Anunoby. Kuminga also had a higher effective field goal average, trailed Anunoby slightly in 3-point % for the season but shot a much higher 49% from 3 in his last 19 games (and increased his rebounds and overall shooting as well). The one area where Anunoby is currently better is on defense (he was named to the NBA’s second team All-Defensive Team last season). But Kuminga, while not yet at an All-NBA level, became an outstanding defensive player in the latter part of last season. The statistics show that Kuminga is already a more efficient scorer, a better rebounder and better passer. Since Anunoby is ahead as a defensive player, they appear pretty equal already with Kuminga likely to surpass Anunoby this season or next.

A second example is a proposed trade for Thybulle. The suggestion includes the Warriors also giving up Cory Joseph and Tryce Jackson-Davis plus the teams swapping first round picks in 2029. The swap is so far out that it is hard to tell who would benefit so I think of it as the Warriors giving up Kuminga plus some extra for Thybulle. While Thybulle is a very strong defensive presence, that is a minor plus since Kuminga is already very strong defensively and should improve. On offense there is no comparison. Kuminga scores over 90% more points per 36 minutes, garners 30% more rebounds, generates over 75% more assists and maintains a higher shooting %. Combine this with a lower salary and how much better Kuminga was in the latter part of last season, this suggestion seems ludicrous as are most others that have been made by so-called “experts”.

I have used these examples as they typify how under-valued Kuminga is in speculated trades. That does not mean the Warriors would never trade him but at this point in time it seems to me to be extremely unlikely as he represents a high-quality player with unlimited potential at a low salary cost for the next 2 years. I view Moody as another potentially high-quality player (at a low cost) with strong upside but probably not quite as much upside potential as Kuminga. Unlike the beginning of last season, they both seem ready to emerge and become important cogs in a possible title run this year.

Have the The Dubs have abandoned their “2-track timeline (2TT)”: Two Track Timeline Very Much Alive!

Trading both Wiseman and Poole as well as several of last year’s rookie class has stirred a hornet’s nest of comments that the 2TT has been abandoned. We disagree and believe that it is still in play but modified to a more realistic timing for Track 2. Instead of thinking 8-10 years out, why not have:

Track 1 be the next 3 years (remainder of Curry contract).

Track 2 be the subsequent 3 years.

Let’s face it, even 6 years is a lifetime for the NBA as every one of the players below will have the opportunity to be a free agent within that period. And after 6 years all of them will have a second opportunity for free agency. So, trying to think beyond that is unrealistic as too many things can happen. With that in mind, here are the key players for track 2. Bear in mind this assumes everyone mentioned below will sign at least one new contract with the Warriors. Curry, Thompson, and Green will be 38, 36 and 36, respectively, at the start of the 2026-27 season. They are not included below but, of course, it’s somewhat likely that one or more of those 3 will still be a solid player that contributes to Track 2.

Track 2 – Potential Players from Current Roster (ages at beginning of 2026-27 season)

  1. Andrew Wiggins (31)
  2. Kevin Looney (30)
  3. Gary Payton II (33)
  4. Jonathan Kuminga (24)
  5. Moses Moody (24)
  6. Lester Quinones (25)
  7. Brandin Podziemski (23)
  8. Trayce Jackson-Davis (26)
  9. Gui Santos (24)
  10. Subsequent draft picks ?

Including Wiggins, Looney and Payton is quite realistic as they will all be in their peak years. In addition, the Dubs currently have 6 players that would be between 23 and 26 when we reach Track 2. Santos and Quinones are included because the high quality of their play in the G League indicates that they are currently better than last year’s rookies that were traded. But while both are under contract, neither is currently on the roster. Much has been made of the trades of Wiseman and Poole, but I believe that neither trade signifies abandoning the future as long as the Dubs keep Kuminga and Moody on the team. Wiseman was traded because he was a disappointment. Poole became a liability after signing a very rich 4-year contract a year ago (that would begin in the 2023-24 season) and then regressed significantly during last season.

In addition to improving the Track 1 team by trading Poole for Chris Paul (who is currently better), the Dubs also put themselves in a stronger position to acquire additional talent after the 2023-2024 season as they can get under the salary cap second apron in the 2024-25 season since Paul’s contract of $30M is not guaranteed for that year. The benefit of this is quite obvious when we consider the fact that the team might have kept DiVincenzo or signed a high-quality free agent if they had the flexibility that being under the second apron provides. Additionally, assuming several of the 6 players emerge as stars, the timetable for when they would need to be paid has a better spread than before since 4 of the 6 are rookies this year or next. The other 2, Moody and Kuminga, won’t be eligible for a contract extension until the 25-26 season giving the Warriors the opportunity for a cap reset in 24-25. When this is combined with the jump in cap expected in 2025 (due to a new TV contract) the Dubs can remain under the second apron in the 2025-26 season even if they need to substantially increase what they pay the two of them.

We are not suggesting that all 9 of these players will be on the team for Track 2 but rather that there is a strong potential available young core. While I firmly believe Kuminga and Moody can be stars this is not a given. If they fail to emerge then Track 2 may require the signing of a star free agent.

Why did The Dubs trade Poole and others for Chris Paul? We believe the Chris Paul for Poole trade was a positive for the Warriors this season.

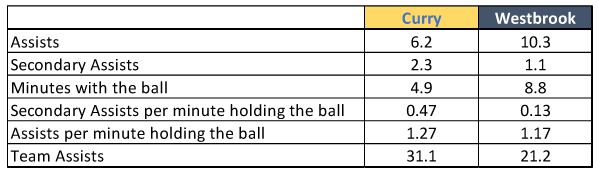
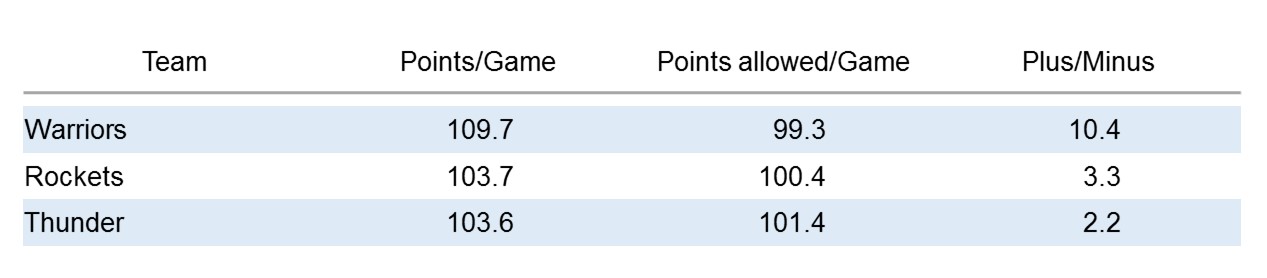
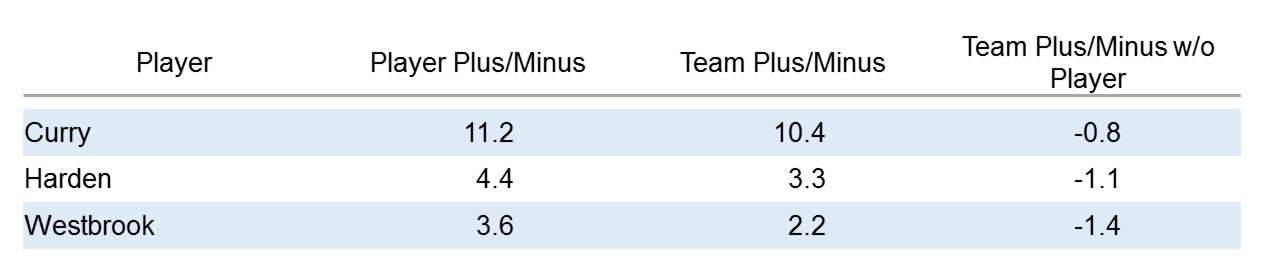
One way to compare the offensive value of each player is to compare Poole (in the 21-22 championship season) to Chris Paul last year using “net points generated” shown in the table below. It adds together the point value of assists and steals to the player’s scoring average and then subtracts the lost opportunity from turnovers to establish one overall number. While this will certainly be far from exact, using Chris Paul’s averages from last season in the comparison seems the best approximation of what he might do this season. We used the numbers from Poole in the championship season so we have a basis of comparison of the current team to the one that year, but it should be noted that while Poole scored more last season than the year before, it was due to taking more shots since his field goal efficiency declined (to below the league average) and he also had less rebounds and more turnovers last year.

In this past season, 38.5% of Dubs-made field goals were 3- point shots. That means an average field goal was worth 2.385 points. They also made .371 foul shots for every field goal made. Assuming passes generate .371 made foul shots for every assist that would mean an assist would generate an average total of 2.385 + .371 (2.756)  points for the Warriors. The foul shots would come from passes where the recipient made the shot and was fouled plus those where the recipient missed the shot but was fouled. We believe the passer helped generate the foul shots in both cases and that there is a strong correlation between assists and passes that resulted in a missed assist because the recipient was fouled. We believe the points generated per assist are more valuable than unassisted field goals as it seems logical that an assist, on average would lead to a higher shooting percentage than unassisted shots and there would be more frequent times that no assist was recorded because the player was fouled.

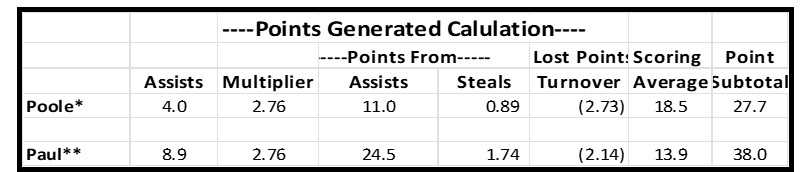
*Poole stats for the 21-22 championship season  **Paul stats for 22-23 season.  Base Data from Basketball Reference guide   

In this past season the Warriors averaged 118.94 points per game and had about 105.6 possessions per game. This means they score 1.126 points per possession. If we assume a steal generates an average possession, then each steal would be worth 1.126 extra points to a team (we think it actually generates more than 1.126 points as many steals lead to uncontested shots – a higher number favors Paul). Using this value in points per steal provides the points from steals in the above table. Finally, every turnover takes away a possession from your team. So, using the same logic the above table subtracts the point value of those lost possessions. Summing the numbers shows that Chris Paul generated over 10 more points per game last year than Jordan Poole did in the championship year.

Paul shot a higher percentage from 3-point range and is a better defender than Poole. The main advantage Poole has over him is his explosive ability to get by defenders resulting in a higher 2-point field goal percentage. This analysis shows that Paul generates over 10 more points of offense than Poole per game. Even if that number turns out to be off by half when he joins the Warriors, the extra 5 points should mean a lot more wins! To me, it seems clear that the Dubs will be a better team with Paul this coming season. The risk to the trade is that Poole has a lot of talent and if he improves his defense and becomes more disciplined on offense, he could become a star in the future whereas Chris Paul is at the tail end of his career.

Can The Warriors make a Title run?

Let me start by saying this Warriors team appears better than the 21-22 title team. Comparing:

  1. Klay was finding his legs when he returned mid-season in 21-22 from a 2 ½ year absence.
  2. Kuminga and Moody were rookies, and they are both significantly better now.
  3. Gary Payton II was just emerging, and the team had to learn how to maximize his value.
  4. Kevin Looney is better now than he was in the Championship season and Kerr also is better at how to use him.
  5. Wiggins missed a major part of last season but is reaching the peak years of his career. He should be as good or better than the 21-22 season on both offense and defense.
  6. In the championship year, Jordan Poole was excellent on offense but was quite weak on defense and had a lot of turnovers.
  7. This season Chris Paul will replace Poole and will likely generate more points of offense due to his assists, steals, rebounds, and fewer turnovers. Despite his no longer being at his peak on defense he still should provide better defense than Poole.
  8. A key player in 21-22 was Otto Porter Jr. I believe Saric is as good.
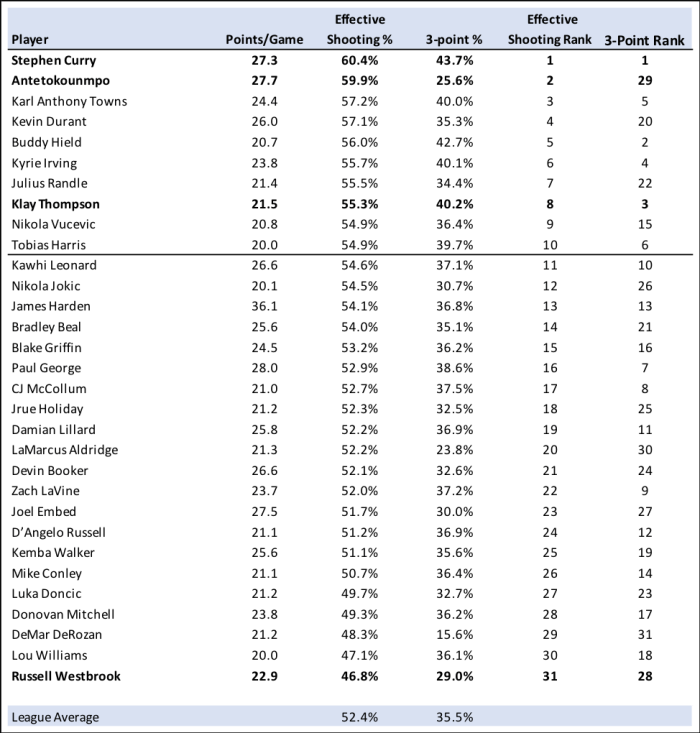
  9. While other role players matter, they will get little court time in the playoffs, so if Curry and Green are as good this coming season as they were in the championship year then the Warriors will be much better. Last season Curry and Green were both better than the 2021-22 season. Curry scored more, had a higher 2-point and 3-point shooting percent, garnered more rebounds, and had roughly the same average number of assists per game. He also was a better defensive player than the year earlier. Last year, Green improved his scoring, had higher 2-point and 3-point shooting percentages and almost the same rebounds and assists per game while finishing 4th in the voting for Defensive player of the year.

Putting the above together leads me to believe the Warriors are better equipped to win the championship than in the 21-22 season. However, the competition is stronger this coming season than in the 21-22 season.

In the West:

  • Denver was missing Jamal Murray in 21-22 but had him back last year when they won.
  • Arizona now has Durant and Beale, 2 great players to go along with Booker and Ayton.
  • The Lakers added Gabe Vincent and Cam Reddish to a solid roster.

In the East:

  • The Celtics added Porzingis but gave up Smart – still probably makes them better.
  • The Bucks added Malik Beasley and Robin Lopez plus kept every one of their core 7 players.

Sacramento is a young team on the rise and could also contend. If the competition had not improved, I’d be picking the Warriors outright to win this year. Even with improved competition, I believe the Warriors can win this year (I didn’t think so last year) but they will need to be healthy come playoffs and playing their best ball.

Soundbytes

Just a quick reminder that I will be posting again within 30 days. The topic will be a deep dive into electric vehicles with mostly an emphasis on Tesla and some thoughts on Rivian and Lucid.

2020 Top Ten Predictions

I wanted to start this post by repeating something I discussed in my top ten lists in 2017 and 2018 which I learned while at Sanford Bernstein in my Wall Street days: “Owning companies that have strong competitive advantages and a great business model in a potentially mega-sized market can create the largest performance gains over time (assuming one is correct).” It does make my stock predictions somewhat boring (as they were on Wall Street where my top picks, Dell and Microsoft each appreciated over 100X over the ten years I was recommending them).

Let’s do a little simple math. Suppose one can generate an IRR of 26% per year (my target is to be over 25%) over a long period of time.  The wonder of compounding is that at 26% per year your assets will double every 3 years. In 6 years, this would mean 4X your original investment dollars and in 12 years the result would be 16X. For comparison purposes, at 5% per year your assets would only be 1.8X in 12 years and at 10% IRR 3.1X.  While 25%+ IRR represents very high performance, I have been fortunate enough to consistently exceed it (but always am worried that it can’t keep up)! For my recommendations of the past 6 years, the IRR is 34.8% and since this exceeds 26%, the 6-year performance  is roughly 6X rather than 4X.

What is the trick to achieving 25% plus IRR? Here are a few of my basic rules:

  1. Start with companies growing revenue 20% or more, where those closer to 20% also have opportunity to expand income faster than revenue
  2. Make sure the market they are attacking is large enough to support continued high growth for at least 5 years forward
  3. Stay away from companies that don’t have profitability in sight as companies eventually should trade at a multiple of earnings.
  4. Only choose companies with competitive advantages in their space
  5. Re-evaluate your choices periodically but don’t be consumed by short term movement

As I go through each of my 6 stock picks I have also considered where the stock currently trades relative to its growth and other performance metrics. With that in mind, as is my tendency (and was stated in my last post), I am continuing to recommend Tesla, Facebook, Amazon, Stitch Fix and DocuSign. I am adding Zoom Video Communications (ZM) to the list. For Zoom and Amazon I will recommend a more complex transaction to achieve my target return.

2020 Stock Recommendations:

1. Tesla stock appreciation will continue to outperform the market (it closed last year at $418/share)

Tesla is likely to continue to be a volatile stock, but it has so many positives in front of it that I believe it wise to continue to own it. The upward trend in units and revenue should be strong in 2020 because:

  • The model 3 continues to be one of the most attractive cars on the market. Electric Car Reviews has come out with a report stating that Model 3 cost of ownership not only blows away the Audi AS but is also lower than a Toyota Camry! The analysis is that the 5-year cost of ownership of the Tesla is $0.46 per mile while the Audi AS comes in 70% higher at $0.80 per mile. While Audi being more expensive is no surprise, what is shocking is how much more expensive it is. The report also determined that Toyota Camry has a higher cost as well ($0.49/mile)! Given the fact that the Tesla is a luxury vehicle and the Camry is far from that, why would anyone with this knowledge decide to buy a low-end car like a Camry over a Model 3 when the Camry costs more to own?  What gets the Tesla to a lower cost than the Camry is much lower fuel cost, virtually no maintenance cost and high resale value. While the Camry purchase price is lower, these factors more than make up for the initial price difference
  • China, the largest market for electronic vehicles, is about to take off in sales. With the new production facility in China going live, Tesla will be able to significantly increase production in 2020 and will benefit from the car no longer being subject to import duties in China.  
  • European demand for Teslas is increasing dramatically. With its Chinese plant going live, Tesla will be able to partly meet European demand which could be as high as the U.S. in the future. The company is building another factory in Europe in anticipation. The earliest indicator of just how much market share Tesla can reach has occurred in Norway where electric cars receive numerous incentives. Tesla is now the best selling car in that country and demand for electric cars there now exceeds gas driven vehicles.

While 2020 is shaping up as a stairstep uptick in sales for Tesla given increased capacity and demand, various factors augur continued growth well beyond 2020. For example, Tesla is only partway towards having a full lineup of vehicles. In the future it will add:

  • Pickup trucks – where pre-orders and recent surveys indicate it will acquire 10-20% of that market
  • A lower priced SUV – at Model 3 type pricing this will be attacking a much larger market than the Model X
  • A sports car – early specifications indicate that it could rival Ferrari in performance but at pricing more like a Porsche
  • A refreshed version of the Model S
  • A semi – where the lower cost of fuel and maintenance could mean strong market share.

2. Facebook stock appreciation will continue to outperform the market (it closed last year at $205/share)

Facebook, like Tesla, continues to have a great deal of controversy surrounding it and therefore may sometimes have price drops that its financial metrics do not warrant. This was the case in 2018 when the stock dropped 28% in value during that year. While 2019 partly recovered from what I believe was an excessive reaction, it’s important to note that the 2019 year-end price of $205/share was only 16% higher than at the end of 2017 while trailing revenue will have grown by about 75% in the 2-year period. The EPS run rate should be up in a similar way after a few quarters of lower earnings in early 2019. My point is that the stock remains at a low price given its metrics. I expect Q4 to be quite strong and believe 2020 will continue to show solid growth.

The Facebook platform is still increasing the number of active users, albeit by only about 5%-6%. Additionally, Facebook continues to increase inventory utilization and pricing. In fact, given what I anticipate will be added advertising spend due to the heated elections for president, senate seats, governorships etc., Facebook advertising inventory usage and rates could increase faster (see prediction 7 on election spending).  

Facebook should also benefit by an acceleration of commerce and increased monetization of advertising on Instagram. Facebook started monetizing that platform in 2017 and Instagram revenue has been growing exponentially and is likely to close out 2019 at well over $10 billion. A wild card for growth is potential monetization of WhatsApp. That platform now has over 1.5 billion active users with over 300 million active every day. It appears close to beginning monetization.

The factors discussed could enable Facebook to continue to grow revenue at 20% – 30% annually for another 3-5 years making it a sound longer term investment.

3. DocuSign stock appreciation will continue to outperform the market (it closed last year at $74/share)

DocuSign is the runaway leader in e-signatures facilitating multiple parties signing documents in a secure, reliable way for board resolutions, mortgages, investment documents, etc. Being the early leader creates a network effect, as hundreds of millions of people are in the DocuSign e-signature database. The company has worked hard to expand its scope of usage for both enterprise and smaller companies by adding software for full life-cycle management of agreements. This includes the process of generating, redlining, and negotiating agreements in a multi-user environment, all under secure conditions. On the small business side, the DocuSign product is called DocuSign Negotiate and is integrated with Salesforce.

The company is a SaaS company with a stable revenue base of over 560,000 customers at the end of October, up well over 20% from a year earlier. Its strategy is one of land and expand with revenue from existing customers increasing each year leading to a roughly 40% year over year revenue increase in the most recent quarter (fiscal Q3). SaaS products account for over 95% of revenue with professional services providing the rest. As a SaaS company, gross margins are high at 79% (on a non-GAAP basis).

The company has now reached positive earnings on a non-GAAP basis of $0.11/share versus $0.00 a year ago. I use non-GAAP as GAAP financials distort actual results by creating extra cost on the P&L if the company’s stock appreciates. These costs are theoretic rather than real.

My only concern with this recommendation is that the stock has had a 72% runup in 2019 but given its growth, move to positive earnings and the fact that SaaS companies trade at higher multiples of revenue than others I still believe it can outperform this year.

4. Stitch Fix Stock appreciation will continue to outperform the market (it closed last year at $25.66/share)

Stitch Fix offers customers, who are primarily women, the ability to shop from home by sending them a box with several items selected based on sophisticated analysis of her profile and prior purchases. The customer pays a $20 “styling fee” for the box which can be applied towards purchasing anything in the box. The company is the strong leader in the space with revenue approaching a $2 billion run rate. Unlike many of the recent IPO companies, it has shown an ability to balance growth and earnings. The stock had a strong 2019 ending the year at $25.66 per share up 51% over the 2018 closing price. Despite this, our valuation methodology continues to show it to be substantially under valued and it remains one of my picks for 2020. The likely cause of what I believe is a low valuation is a fear of Amazon making it difficult for Stitch Fix to succeed. As the company gets larger this fear should recede helping the multiple to expand.  

Stitch Fix continues to add higher-end brands and to increase its reach into men, plus sizes and kids. Its algorithms to personalize each box of clothes it ships keeps improving. Therefore, the company can spend less on acquiring new customers as it has increased its ability to get existing customers to spend more and come back more often. Stitch Fix can continue to grow its revenue from women in the U.S. with expansion opportunities in international markets over time. I believe the company can continue to grow by roughly 20% or more in 2020 and beyond.

Stitch Fix revenue growth (of over 21% in the latest reported quarter) comes from a combination of increasing the number of active clients by 17% to 3.4 million, coupled with driving higher revenue per active client. The company accomplished this while generating profits on a non-GAAP basis.

5. Amazon stock strategy will outpace the market (it closed last year at $1848/share).

Amazon shares increased by 23% last year while revenue in Q3 was up 24% year over year. This meant the stock performance mirrored revenue growth. Growth in the core commerce business has slowed but Amazon’s cloud and echo/Alexa businesses are strong enough to help the company maintain roughly 20% growth in 2020. The company continues to invest heavily in R&D with a push to create automated retail stores one of its latest initiatives. If that proves successful, Amazon can greatly expand its physical presence and potentially increase growth through the rollout of numerous brick and mortar locations. But at its current size, it will be difficult for the company to maintain over 20% revenue growth for many years (excluding acquisitions) so I am suggesting a more complex investment in this stock:

  1. Buy X shares of the stock (or keep the ones you have)
  2. Sell Amazon puts for the same number of shares with the puts expiring on January 15, 2021 and having a strike price of $1750. The most recent sale of these puts was for over $126
  3. So, net out of pocket cost would be reduced to $1722
  4. A 20% increase in the stock price (roughly Amazon’s growth rate) would mean 29% growth in value since the puts would expire worthless
  5. If the stock declined 226 points the option sale would be a break-even. Any decline beyond that and you would lose additional dollars.
  6. If the options still have a premium on December 31, I will measure their value on January 15, 2021 for the purposes of performance.

6. I’m adding Zoom Video Communications to the list but with an even more complex investment strategy (the stock is currently at $72.20)

I discussed Zoom Video Communications (ZM) in my post on June 24, 2019. In that post I described the reasons I liked Zoom for the long term:

  1. Revenue retention of a cohort was about 140%
  2. It acquires customers very efficiently with a payback period of 7 months as the host of a Zoom call invites various people to participate in the call and those who are not already Zoom users can be readily targeted by the company at little cost
  3. Gross Margins are over 80% and could increase
  4. The product has been rated best in class numerous times
  5. Its compression technology (the key ingredient in making video high quality) appears to have a multi-year lead over the competition
  6. Adding to those reasons it’s important to note that ZM is improving earnings and was slightly profitable in its most recent reported quarter

The fly in the ointment was that my valuation technology showed that it was overvalued. However, I came up with a way of “future pricing” the stock. Since I expected revenue to grow by about 150% over the next 7 quarters (at the time it was growing over 100% year over year) “future pricing” would make it an attractive stock. This was possible due to the extremely high premiums for options in the stock. So far that call is working out. Despite the company growing revenue in the 3 quarters subsequent to my post by over 57%, my concern about valuation has proven correct and the stock has declined from $76.92 to $72.20. If I closed out the position today by selling the stock and buying back the options (see Table 1) my return for less than 7.5 months would be a 42% profit. This has occurred despite the stock declining slightly due to shrinkage in the premiums.

Table 1: Previous Zoom trade and proposed trade

I typically prefer using longer term options for doing this type of trade as revenue growth of this magnitude should eventually cause the stock to rise, plus the premiums on options that are further out are much higher, reducing the risk profile, but I will construct this trade so that the options expire on January 15, 2021 to be able to evaluate it in one year. In measuring my performance we’ll use the closing stock price on the option expiration date, January 15, 2021 since premiums in options persist until their expiration date so the extra 2 weeks leads to better optimization of the trade.

So, here is the proposed trade (see table 1):

  1. Buy X shares of the stock at $72.20 (today’s price)
  2. Sell Calls for X shares expiring January 15, 2021 at a strike of $80/share for $11.50 (same as last price it traded)
  3. Sell puts for X shares expiring January 15, 2021 with strike of $65/share for $10.00 (same as last price it traded)

I expect revenue growth of 60% or more 4 quarters out. I also expect the stock to rise some portion of that, as it is now closer to its value than when I did the earlier transaction on May 31, 2019. Check my prior post for further analysis on Zoom, but here are 3 cases that matter at December 31, 2020:

  • Stock closes over $80/share (up 11% or more) at end of the year: the profit would be 58% of the net cost of the transaction
    • This would happen because the stock would be called, and you would get $80/share
    • The put would expire worthless
    • Since you paid a net cost of $50.70, net profit would be $29.30
  • Stock closes flat at $72.20:  your profit would be $21.50 (42%)
    • The put and the call would each expire worthless, so you would earn the original premiums you received when you sold them
    • The stock would be worth the same as what you paid
  • Stock closes at $57.85 on December 31: you would be at break even. If it closed lower, then losses would accumulate twice as quickly:
    • The put holder would require you to buy the stock at the put exercise price of $65, $7.15 more than it would be worth
    • The call would expire worthless
    • The original stock would have declined from $72.20 to $57.85, a loss of $14.35
    • The loss on the stock and put together would equal $21.50, the original premiums you received for those options

Outside of my stock picks, I always like to make a few non-stock predictions for the year ahead.

7. The major election year will cause a substantial increase in advertising dollars spent

According to Advertising Analytics political spending has grown an average of 27% per year since 2012. Both the rise of Super PACs and the launch of online donation tools such as ActBlue have substantially contributed to this growth. While much of the spend is targeted at TV, online platforms have seen an increasing share of the dollars, especially Facebook and Google. The spend is primarily in even years, as those are the ones with senate, house and gubernatorial races (except for minor exceptions). Of course, every 4th year this is boosted by the added spend from presidential candidates. The Wall Street Journal projects the 2020 amount will be about $9.9 billion…up nearly 60% from the 2016 election year. It should be noted that the forecast was prior to Bloomberg entering the race and if he remains a viable candidate an additional $2 billion or more could be added to this total.

The portion targeted at the digital world is projected to be about $2.8 billion or about 2.2% of total digital ad spending. Much of these dollars will likely go to Facebook and Google. This spend has a dual impact: first it adds to the revenue of each platform in a direct way, but secondly it can also cause the cost of advertising on those platforms to rise for others as well.

8. Automation of Retail will continue to gain momentum

This will happen in multiple ways, including:

  1. More Brick & Mortar locations will offer some or all the SKUs in the store for online purchase through Kiosks (assisted by clerks/sales personnel). By doing this, merchants will be able to offer a larger variety of items, styles, sizes and colors than can be carried in any one outlet. In addition, the consolidation of inventory achieved in this manner will add efficiency to the business model. In the case of clothing, such stores will carry samples of items so the customer can try them on, partly to optimize fit but also to determine whether he or she likes the way it looks and feels on them. If one observes the massive use of Kiosks at airports it becomes obvious that they reduce the number of employees needed and can speed up checking in. One conclusion is this will be the wave of the future for multiple consumer-based industries.
  2. Many more locations will begin incorporating technology to eliminate the number of employees needed in their stores. Amazon will likely be a leader in this, but others will also provide ways to reduce the cost of ordering, picking goods, checking out and receiving information while at the store.

9. The Warriors will come back strong in the 2020/21 season

Let me begin by saying that this prediction is not being made because I have been so humbled by my miss in the July post where I predicted that the Warriors could edge into the 2020 playoffs and then contend for a title if Klay returned in late February/early March. Rather, it is based on analysis of their opportunity for next season and also an attempt to add a little fun to my Top Ten List!  The benefit of this season:

  • Klay and Curry are getting substantial time off after 5 seasons of heavy stress. They should be refreshed at the start of next season
  • Russell, assuming he doesn’t keep missing games with injuries, is learning the Warriors style of play
  • Because of the injuries to Klay, Curry, Looney, and to a lesser extent Green and Russell, several of the younger members of the team are getting experience at a much more rapid rate than would normally be possible and the Warriors are able to have more time to evaluate them as potential long-term assets
  • If the Warriors continue to lose at their current rate, they will be able to get a high draft choice for the first time since 2012 when they drafted Harrison Barnes with the 7th pick. Since then their highest pick has been between the 28th and 30th player chosen (30 is the lowest pick in the first round)
  • The Warriors will have more cap space available to sign a quality veteran
  • Andre Iguodala might re-sign with the team, and while this is not necessary for my prediction it would be great for him and for the team
  • The veterans should be hungry again after several years of almost being bored during the regular season

I am assuming the Warriors will be relatively healthy next season for this to occur.

10. At least one of the major Unicorns will be acquired by a larger player

In 2019, there was a change to the investing environment where most companies that did not show a hint of potential profitability had difficulty maintaining their market price. This was particularly true of highly touted Unicorns, which mostly struggled to increase their share price dramatically from the price each closed on the day of their IPO. Table 2 shows the 9 Unicorns whose IPOs we highlighted in our last post. Other than Beyond Meat, Zoom and Pinterest, they all appear some distance from turning a proforma profit. Five of the other six are below their price on the first day’s close. A 6th, Peloton, is slightly above the IPO price (and further above the first days close). Beyond Meat grew revenue 250% in its latest quarter and moved to profitability as well. Its stock jumped on the first day and is even higher today.  While Pinterest is showing an ability to be profitable it is still between the price of the IPO and its close on the first day of trading.  Zoom, which is one of our recommended buys, was profitable (on a Non-GAAP basis) and grew revenue 85% in its most recent quarter. A 10th player, WeWork, had such substantial losses that it was unable to have a successful IPO.

Table 2: Recent Unicorn IPOs Stock Price & Profitability Comparisons

Something that each of these companies have in common is that they are all growing revenue at 30% or more, are attacking large markets, and are either in the leadership position in that market or are one of two in such a position. Because of this I believe one or more of these (and comparable Unicorns) could be an interesting acquisition for a much larger company who is willing to help make them profitable. For such an acquirer their growth and leadership position could be quite attractive.

The Warriors Ain’t Dead Yet!

Why the team is still a contender

My long term readers know that every so often the blog wanders into the sports arena. In doing so, I apply the same type of analysis that I do for public stocks and for VC investments to sports, and usually, basketball. Given all the turmoil that has occurred in the NBA this off-season, including the Warriors losing Durant, Iguodala, Livingston, Cousins and several other players, I thought it would be interesting to evaluate the newly changed team. Both ESPN and CBS power rankings have them 7th in the West and 11th in the NBA. I find that an overreaction as the Warriors may have beaten the Raptors if Klay Thompson not been injured, they swept Portland, and won the last 2 Rockets games without Durant. At the time this drove a lot of chatter that the team might be better off without Durant (I disagree).

But rather then compare the revised roster to last year’s, it seems more closely matched with the 2014-15 team, as that was a championship team that did not include Kevin Durant. I will make 2 key assumptions:

  1. Klay Thompson will return by the end of February and be as effective as he was before his injury
  2. The Warriors will make the playoffs despite missing Thompson for the majority of the season

It all starts with Curry

A third key assumption that has been proven over and over again is that players that come to the Warriors usually perform better as they benefit from the “Curry Effect”, namely, getting more shots without having someone closely guarding them, (The Curry Effect), resulting in an average improved shooting percentage of over 5%. In all fairness, it really is the “Curry plus Thompson Effect” as the extreme focus on preventing the two of them from taking 3 point shots is what frees up others. It helps that Curry is unselfish and readily passes the ball when he is double or triple teamed. Thompson’s passing has improved substantially but since he gets his shot off so quickly, he has less need to pass it. Last year both shot over 40% from 3 despite defensive efforts focused on preventing each of them from taking those shots.

Starting Teams: 2019-20 vs 2014-15

Table 1

Curry, Thompson and Green, the heart and soul of the Warriors, all remain from the 2014-15 roster, and now are at their peaks. In the 2014-15 season when Green first became a starter, Curry was one year away from reaching his peak and Thompson was just coming into his own especially on defense. I believe each of them is better today then they were at that time. At his best, Bogut may have been better than Cauley-Stein, but by 2014 Bogut had been through a number of injuries. Last year Cauley-Stein averaged nearly double the points of 2014 Bogut (11.9 vs 6.3), took slightly more rebounds per game and was a better free throw shooter. Stein, much like Bogut, is also considered a solid pick setter and defender. Russell is someone who should benefit greatly from playing with Curry. Even without that, last season he averaged over twice as many points per game as 2014 Barnes (21.1 vs 10.1) which should take considerable pressure off Curry (and Klay when he returns). However, Barnes was a better defender in 2014 than Russell is today. I give the edge to all 5 starters on the 2019 starting team compared to the 5 that started in 2014-15.

Thompson may be the most underrated player in the league!

It’s unfortunate that Thompson was injured in game 6 of the 2019 finals as he was once again proving just how good he can be. Not only was he playing lockdown defense, but he also drove the offense in what has been referred to as a typical Klay game 6. In just 32 minutes, before getting injured, he scored 30 points on 83% effective shooting percentage (67% on 3s), went 10 for 10 on free throws, and had 5 rebounds and 2 steals. I believe Golden State, even without Durant, would have forced a game 7 if Thompson did not get injured.

It boggles my mind that one of the websites could refer to Thompson as “an average player” who did not merit a max contract. This is bordering on the ridiculous and has a lot to do with the fact that the most important measure of shooting, effective shooting percentage (where each 3 made counts as 1½ 2 point shots made) does not normally get reported (or even noticed). In Table 2, I list the top 31 scorers from last season (everyone who averaged at least 20 points per game) and rank them by effective shooting. Thompson is number 8 in effective shooting and number 3 in 3-point percentage among this group. So, if effective shooting percentage was regularly published, Thompson would show up consistently helping the perception of his value. When this is coupled with his being a third team all-defensive player (i.e., one of the top 15 defenders in the league) it appears clear that he should be considered one of the top 15 players in the league.

Table 2: Top Scorers 2018-2019 Season

6th Man 2019-20 vs 2014-15

Kevon Looney has emerged as a potential star in the works. While he may not yet be the defensive presence of Iguodala, he is getting close. His scoring per minute played was higher than Andre’s 2014-15 numbers and his rebounds per minute were more than twice as much. While Iguodala had greater presence and could run the team as well as assist others in scoring, Looney at least partly makes up for this in his ability to set screens. Looney also has a much higher effective shooting percentage (62.7% vs 54.0%) than Andre had in 2014-15. While Kevon doesn’t shoot 3s he gets many points by putting back offensive rebounds and dunking lob passes. Overall, I give the edge to Iguodala based on the Looney of last season but given Looney’s potential to improve this might be dead even in the coming one.

Rest of the Bench for the 2 teams

It is the bench that is hardest to evaluate. Unlike last year’s bench, the 2014-15 bench was quite strong which spawned the Warrior logo “Strength in Numbers”. It included quality veteran players like Leandro Barbosa, David Lee, Mareese Sprouts and Shaun Livingston, who was playing at a much higher level than last season. The four of these together averaged over 26 points per game.  This coming year’s bench is much younger and more athletic. It includes Alec Burks, Glenn Robinson, Alfonzo McKinnie and Omari Spellman, plus several rookies and Jacob Evans III. The first four are all capable of scoring and are solid 3-point shooters (they could increase to well above average once with the Warriors). I expect that group, coupled with one or two of the others, to exceed the 2014-15 bench in defense…but may not have as much scoring fire power. The team is likely to give one or two of the rookies as well as Evans opportunities to earn minutes as well. The bench is an improvement over last year but may not be as strong as the 2014-15 squads.

Overall Assessment

I believe the 2019-2020 squad is better than the championship team of 2015. The starting lineup features the core 3 players who have improved since then, D’Angelo Russell who was an all-star last year, and a solid center in Willie Cauley-Stein making the edge substantial. Looney as 6th man is already giving evidence of future stardom. While he was not quite the Andre Iguodala of 2014-15, the difference is modest, and Looney continues to improve. The 2014-15 bench appears superior to that of next season, but the edge is not great as the newer group should be stronger defensively and is not far off the older group as scorers – the question will be how well they gel and how much the Curry/Klay factor improves their scoring. Finally, I think Kerr is a better coach today than he was given the last 5 years of experience.

They May Have Improved vs 2014-15, but so has the Competition

ESPN and CBS power rankings reflect the fact that multiple teams have created new “super star” two-somes:

  • Lakers: Lebron and Anthony Davis
  • Clippers: Kawhi Leonard and Paul George
  • Houston: Harden and Westbrook (in place of Chris Paul)
  • Nets: Kyrie Irving and Durant

Contenders also include improving young teams like Boston, Philadelphia, Denver, and Utah plus an improved Portland squad. This makes the landscape much tougher than when the Warriors won their 2015 championship. Yet, none of these teams seem better than the Cleveland team (led by a younger LeBron, Kyrie Irving and Kevin Love) the Warriors beat in 2015. So, assuming Klay returns by late February and is back to par, I believe the Warriors will remain strong contenders given the starting team with four all-stars augmented by Willie Cauley-Stein and an improving Kevon Looney as 6th man. However, it will be much tougher going in the early rounds in the playoffs, making getting to the finals longer odds than in each of the past 5 years.

SoundBytes

  1. An examination of Table 2 reveals several interesting facts:
  2. Curry, once again is the leader among top scorers in effective shooting and the only one over 60%
  3. Antetokounmpo is only slightly behind despite being a very poor 3-point shooter. If he can improve his distance shooting, he may become unstoppable
  4. Russell Westbrook, once again, had the worst effective shooting percent of anyone who averaged 20 points or more. In fact, he was significantly below the league average. Part of the reason is despite being a very poor 3-point shooter he continues to take too many distance shots. Whereas most players find that taking 3s increases their effective shooting percent, for Westbrook it lowers it. I haven’t been able to check this, but one broadcaster stated that he has the lowest 3-point percentage of any player in history that has taken over 2500 3-point shots!
  5. I believe that Westbrook has a diminished chance to accumulate as many triple doubles next season as he has in the past. There is only one ball and both he and Harden tend to hold it most of the time. When Chris Paul came to the Rockets his assists per game decreased by about 15% compared to his prior 3 season average.

The Valuation Bible

Facebook valuation image

After many years of successfully picking public and private companies to invest in, I thought I’d share some of the core fundamentals I use to think about how a company should be valued. Let me start by saying numerous companies defy the logic that I will lay out in this post, often for good reasons, sometimes for poor ones. However, eventually most companies will likely approach this method, so it should at least be used as a sanity check against valuations.

When a company is young, it may not have any earnings at all, or it may be at an earnings level (relative to revenue) that is expected to rise. In this post, I’ll start by considering more mature companies that are approaching their long-term model for earnings to establish a framework, before addressing how this framework applies to less mature companies. The post will be followed by another one where I apply the rules to Tesla and discuss how it carries over into private companies.

Growth and Earnings are the Starting Points for Valuing Mature Companies

When a company is public, the most frequently cited metric for valuation is its price to earnings ratio (PE). This may be done based on either a trailing 12 months or a forward 12 months. In classic finance theory a company should be valued based on the present value of future cash flows. What this leads to is our first rule:

Rule 1: Higher Growth Rates should result in a higher PE ratio.

When I was on Wall Street, I studied hundreds of growth companies (this analysis does not apply to cyclical companies) over the prior 10-year period and found that there was a very strong correlation between a given year’s revenue growth rate and the next year’s revenue growth rate. While the growth rate usually declined year over year if it was over 10%, on average this decline was less than 20% of the prior year’s growth rate. What this means is that if we took a group of companies with a revenue growth rate of 40% this year, the average organic growth for the group would likely be about 33%-38% the next year. Of course, things like recessions, major new product releases, tax changes, and more could impact this, but over a lengthy period of time this tended to be a good sanity test. As of January 2, 2018, the average S&P company had a PE ratio of 25 on trailing earnings and was growing revenue at 5% per year. Rule 1 implies that companies growing faster should have higher PEs and those growing slower, lower PEs than the average.

Graph 1: Growth Rates vs. Price Earnings Ratios

graph

The graph shows the correlation between growth and PE based on the valuations of 21 public companies. Based on Rule 1, those above the line may be relatively under-priced and those below relatively over-priced. I say ‘may be’ as there are many other factors to consider, and the above is only one of several ways to value companies. Notice that most of the theoretically over-priced companies with growth rates of under 5% are traditional companies that have long histories of success and pay a dividend. What may be the case is that it takes several years for the market to adjust to their changed circumstances or they may be valued based on the return from the dividend. For example, is Coca Cola trading on: past glory, its 3.5% dividend, or is there something about current earnings that is deceptive (revenue growth has been a problem for several years as people switch from soda to healthier drinks)? I am not up to speed enough to know the answer. Those above the line may be buys despite appearing to be highly valued by other measures.

Relatively early in my career (in 1993-1995) I applied this theory to make one of my best calls on Wall Street: “Buy Dell sell Kellogg”. At the time Dell was growing revenue over 50% per year and Kellogg was struggling to grow it over 4% annually (its compounded growth from 1992 to 1995, this was partly based on price increases). Yet Dell’s PE was about half that of Kellogg and well below the S&P average. So, the call, while radical at the time, was an obvious consequence of Rule 1. Fortunately for me, Dell’s stock appreciated over 65X from January 1993 to January 2000 (and well over 100X while I had it as a top pick) while Kellogg, despite large appreciation in the overall stock market, saw its stock decline slightly over the same 7-year period (but holders did receive annual dividends).

Rule 2: Predictability of Revenue and Earnings Growth should drive a higher trailing PE

Investors place a great deal of value on predictability of growth and earnings, which is why companies with subscription/SaaS models tend to get higher multiples than those with regular sales models. It is also why companies with large sales backlogs usually get additional value. In both cases, investors can more readily value the companies on forward earnings since they are more predictable.

Rule 3: Market Opportunity should impact the Valuation of Emerging Leaders

When one considers why high growth rates might persist, the size of the market opportunity should be viewed as a major factor. The trick here is to make sure the market being considered is really the appropriate one for that company. In the early 1990s, Dell had a relatively small share of a rapidly growing PC market. Given its competitive advantages, I expected Dell to gain share in this mushrooming market. At the same time, Kellogg had a stable share of a relatively flat cereal market, hardly a formula for growth. In recent times, I have consistently recommended Facebook in this blog for the very same reasons I had recommended Dell: in 2013, Facebook had a modest share of the online advertising, a market expected to grow rapidly. Given the advantages Facebook had (and they were apparent as I saw every Azure ecommerce portfolio company moving a large portion of marketing spend to Facebook), it was relatively easy for me to realize that Facebook would rapidly gain share. During the time I’ve owned it and recommended it, this has worked out well as the share price is up over 8X.

How the rules can be applied to companies that are pre-profit

As a VC, it is important to evaluate what companies should be valued at well before they are profitable. While this is nearly impossible to do when we first invest (and won’t be covered in this post), it is feasible to get a realistic range when an offer comes in to acquire a portfolio company that has started to mature. Since they are not profitable, how can I apply a PE ratio?

What needs to be done is to try to forecast eventual profitability when the company matures. A first step is to see where current gross margins are and to understand whether they can realistically increase. The word realistic is the key one here. For example, if a young ecommerce company currently has one distribution center on the west coast, like our portfolio company Le Tote, the impact on shipping costs of adding a second eastern distribution center can be modeled based on current customer locations and known shipping rates from each distribution center. Such modeling, in the case of Le Tote, shows that gross margins will increase 5%-7% once the second distribution center is fully functional. On the other hand, a company that builds revenue city by city, like food service providers, may have little opportunity to save on shipping.

  • Calculating variable Profit Margin

Once the forecast range for “mature” gross margin is estimated, the next step is to identify other costs that will increase in some proportion to revenue. For example, if a company is an ecommerce company that acquires most of its new customers through Facebook, Google and other advertising and has high churn, the spend on customer acquisition may continue to increase in direct proportion to revenue. Similarly, if customer service needs to be labor intensive, this can also be a variable cost. So, the next step in the process is to access where one expects the “variable profit margin” to wind up. While I don’t know the company well, this appears to be a significant issue for Blue Apron: marketing and cost of goods add up to about 90% of revenue. I suspect that customer support probably eats up (no pun intended) 5-10% of what is left, putting variable margins very close to zero. If I assume that the company can eventually generate 10% variable profit margin (which is giving it credit for strong execution), it would need to reach about $4 billion in annual revenue to reach break-even if other costs (product, technology and G&A) do not increase. That means increasing revenue nearly 5-fold. At their current YTD growth rate this would take 9 years and explains why the stock has a low valuation.

  • Estimating Long Term Net Margin

Once the variable profit margin is determined, the next step would be to estimate what the long-term ratio of all other operating cost might be as a percent of revenue. Using this estimate I can determine a Theoretic Net Earnings Percent. Applying this percent to current (or next years) revenue yields a Theoretic Earnings and a Theoretic PE (TPE):

TPE= Market Cap/Theoretic Earnings     

To give you a sense of how I successfully use this, review my recap of the Top Ten Predictions from 2017 where I correctly predicted that Spotify would not go public last year despite strong top line growth as it was hard to see how its business model could support more than 2% or so positive operating margin, and that required renegotiating royalty deals with record labels.  Now that Spotify has successfully negotiated a 3% lower royalty rate from several of the labels, it appears that the 16% gross margins in 2016 could rise to 19% or more by the end of 2018. This means that variable margins (after marketing cost) might be 6%. This would narrow its losses, but still means it might be several years before the company achieves the 2% operating margins discussed in that post. As a result, Spotify appears headed for a non-traditional IPO, clearly fearing that portfolio managers would not be likely to value it at its private valuation price since that would lead to a TPE of over 200. Since Spotify is loved by many consumers, individuals might be willing to overpay relative to my valuation analysis.

Our next post will pick up this theme by walking through why this leads me to believe Tesla continues to have upside, and then discussing how entrepreneurs should view exit opportunities.


SoundBytes

I’ve often written about effective shooting percentage relative to Stephen Curry, and once again he leads the league among players who average 15 points or more per game. What also accounts for the Warriors success is the effective shooting of Klay Thompson, who is 3rd in the league, and Kevin Durant who is 6th. Not surprisingly, Lebron is also in the top 10 (4th). The table below shows the top ten among players averaging 15 points or more per game.  Of the top ten scorers in the league, 6 are among the top 10 effective shooters with James Harden only slightly behind at 54.8%. The remaining 3 are Cousins (53.0%), Lillard (52.2%), and Westbrook, the only one below the league average of 52.1% at 47.4%.

Table: Top Ten Effective Shooters in the League

table

*Note: Bolded players denote those in the top 10 in Points per Game

Ending the Year on a High Note…or should I say Basketball Note

Deeper analysis on what constitutes MVP Value

Blog 35 photo

In my blog post dated February 3, 2017, I discussed several statistics that are noteworthy in analyzing how much a basketball player contributes to his team’s success. In it, I compared Stephen Curry and Russell Westbrook using several advanced statistics that are not typically highlighted.

The first statistic: Primary plus Secondary Assists per Minute a player has the ball. Time with the ball equates to assist opportunity, so holding the ball most of the time one’s team is on offense reduces the opportunity for others on the team to have assists. This may lead to fewer assisted baskets for the whole team, but more for the individual player. As of the time of the post, Curry had 1.74 assists (primary plus secondary) per minute he had the ball, while Westbrook only had 1.30 assists per minute. Curry’s efficiency in assists is one of the reasons the Warriors total almost 50% more assists per game than the Thunder, make many more easy baskets, and lead the league in field goal percentage.

The second statistic: Effective Field Goal Percentages (where making a 3-point shot counts the same as making 1 ½ 2-point shots). Again, Curry was vastly superior to Westbrook at 59.1% vs 46.4%. What this means is that Westbrook scores more because he takes many more shots, but these shots are not very efficient for his team, as Westbrook’s shooting percentage continued to be well below the league average of 45.7% (Westbrook’s was 42.5% last season and is 39.6% this season to date).

The third statistic: Plus/Minus.  Plus/Minus reflects the number of points your team outscores opponents while you are on the floor.  Curry led the league in this in 2013, 2014, and 2016 and leads year-to-date this season. In 2015 he finished second by a hair to a teammate. Westbrook has had positive results, but last year averaged 3.2 per 36 minutes vs Curry’s 13.8. One challenge to the impressiveness of this statistic for Curry is whether his leading the league in Plus/Minus is due to the quality of players around him. In refute, it is interesting to note that he led the league in 2013 when Greene was a sub, Durant wasn’t on the team and Thompson was not the player he is today.

The background shown above brings me to today’s post which outlines another way of looking at a player’s value. The measurement I’m advocating is: How much does he help teammates improve? My thesis is that if the key player on a team creates a culture of passing the ball and setting up teammates, everyone benefits. Currently the value of helping teammates is only measured by the number of assists a player records. But, if I’m right, and the volume of assists is the wrong measure of helping teammates excel (as sometimes assists are the result of holding the ball most of the time) then I should be able to verify this through teammate performance. If most players improve their performance by getting easier shots when playing with Westbrook or Curry, then this should translate into a better shooting percentage. That would mean we should be able to see that most teammates who played on another team the year before or the year after would show a distinct improvement in shooting percentage while on his team. This is unlikely to apply across the board as some players get better or worse from year to year, and other players on one’s team also impact this data. That being said, looking at this across players that switch teams is relevant, especially if there is a consistent trend.

To measure this for Russell Westbrook, I’ve chosen 5 of the most prominent players that recently switched teams to or from Oklahoma City: Victor Oladipo, Kevin Durant, Carmelo Anthony, Paul George and Enes Kantor. Three left Oklahoma City and two went there from another team. For the two that went there, Paul George and Carmelo Anthony, I’ll compare year-to-date this season (playing with Westbrook) vs their shooting percentage last year (without Westbrook). For Kantor and Oladipo, the percentage last year will be titled “with Westbrook” and this year “without Westbrook” and for Durant, the seasons in question are the 2015-16 season (with Westbrook) vs the 2016-17 season (without Westbrook).

Shooting Percentage

Table 0

Given that the league average is to shoot 45.7%, shooting below that can hurt a team, while shooting above that should help. An average team takes 85.4 shots per game, so a 4.0% swing translates to over 8.0 points a game. To put that in perspective, the three teams with the best records this season are the Rockets, Warriors and Celtics and they had first, second and fourth best Plus/Minus for the season at +11.0, +11.0 and +5.9, respectively. The Thunder came in at plus 0.8. If they scored 8 more points a game (without giving up more) their Plus/Minus would have been on a par with the top three teams, and their record likely would be quite a bit better than 12 and 14.

Curry and His Teammates Make Others Better

How does Curry compare? Let’s look at the same statistics for Durant, Andrew Bogut, Harrison Barnes, Zaza Pachulia and Ian Clark (the primary player who left the Warriors). For Barnes, Bogut, Pachulia and Durant I’ll compare the 2015 and 2016 seasons and for Clark I’ll use 2016 vs this season-to-date.

Table 1

So, besides being one of the best shooters to play the game, Curry also has a dramatic impact on the efficiency of other players on his team. Perhaps it’s because opponents need to double team him, which allows other players to be less guarded. Perhaps it’s because he bought into Kerr’s “spread the floor, move the ball philosophy”. Whatever the case, his willingness to give up the ball certainly has an impact. And that impact, plus his own shooting efficiency, clearly leads to the Warriors being an impressive scoring machine. As an aside, recent Warrior additions Casspi and Young are also having the best shooting percentages of their careers.

Westbrook is a Great Player Who Could be Even Better

I want to make it clear that I believe Russell Westbrook is a great player. His speed, agility and general athleticism allow him to do things that few other players can match. He can be extremely effective driving to the basket when it is done under control. But, he is not a great outside shooter and could help his team more by taking fewer outside shots and playing less one/one basketball. Many believed that the addition of George and Anthony would make Oklahoma City a force to be reckoned with, but to date this has not been the case. Despite the theoretic offensive power these three bring to the table, the team is 24th in the league in scoring at 101.8 per game, 15 points per game behind the league leading Warriors. This may change over the course of the season but I believe that each of them playing less one/one basketball would help.

They got it right: Why Stephen Curry deserves to be a First Team All-Star

Curry vs. Westbrook

Much has been written about the fact that Russell Westbrook was not chosen for the first team on the Western All-Stars. The implication appears to be that he was more deserving than Curry. I believe that Westbrook is one of the greatest athletes to play the game and one of the better players currently in the league. Yet, I also feel strongly that so much weight is being placed on his triple doubles that he is being unfairly anointed as the more deserving player. This post takes a deeper dive into the available data and, I believe, shows that Curry has a greater impact on winning games and is deserving of the first team honor. So, as is my want to analyze everything, I spent some time dissecting the comparison between the two.  It is tricky comparing the greatest shooter to ever play the game to one of the greatest athletes to ever play, but I’ll attempt it, statistic by statistic.


Rebounding

Westbrook is probably the best rebounding guard of all time (with Oscar Robertson and Magic Johnson close behind). This season he is averaging 10.4 rebounds per game while Curry is at 4.3. There is no question that Westbrook wins hands down in this comparison with Curry, who is a reasonably good rebounding point guard.  But on rebounds per 36 minutes played this season, Westbrook’s stats are even better than Oscar’s in his best year. In that year, Robertson averaged 12.5 rebounds playing over 44 minutes a game which equates to 10.2 per 36 minutes vs Westbrook’s 10.8 per 36 minutes (Magic never averaged 10 rebounds per game for a season).


Assists

You may be surprised when I say that Curry is a better assist producer than Westbrook this season. How can this be when Westbrook averages 10.3 assists per game and Curry only 6.2?  Since Oklahoma City plays a very different style of offense than the Warriors, Westbrook has the ball in his hands a much larger percentage of the time. They both usually bring the ball up the court but once over half court, the difference is striking. Curry tends to pass it off a high proportion of the time while Westbrook holds onto it far longer. Because of the way Curry plays, he leads the league in secondary assists (passes that set up another player to make an assist) at 2.3 per game while Westbrook is 35th in the league at 1.1 per game. The longer one holds the ball the more likely they will shoot it, commit a turnover or have an assist and the less likely they will get a secondary assist. The reason is that if they keep the ball until the 24 second clock has nearly run out before passing, the person they pass it to needs to shoot (even if the shot is a poor one) rather than try to set up someone else who has an easier shot. For example, if a player always had the ball for the first 20 seconds of the 24 second clock, they would likely have all assists for the team while on the court.

Table 1: Assist Statistic Comparison

Curry vs. Westbrook Assists
*NBA.com statistics average per game through Feb 1st, 2017

When in the game, Westbrook holds the ball about 50% of the time his team is on offense, he gets a large proportion of the team’s assists. But that style of play also means that the team winds up with fewer assists in total. In fact, while the Warriors rank #1 in assists as a team by a huge margin at 31.1 per game (Houston is second at 25.6), Oklahoma City is 20th in the league at 21.2 per game. If you agree that the opportunity to get an assist increases with the number of minutes the ball is in the player’s possession, then an interesting statistic is the number of assists per minute that a player possesses the ball (see Table 1). If we compare the two players from that perspective, we see that Curry has 1.27 assists per minute and Westbrook 1.17. Curry also has 0.47 secondary assists per minute while Westbrook only 0.13. This brings the total primary and secondary assist comparison to 1.74 per minute of possession for Curry and 1.30 for Westbrook, a fairly substantial difference. It also helps understand why the Warriors average so many more assists per game than Oklahoma City and get many more easy baskets. This leads to them having the highest field goal percentage in the league, 50.1%.


Shooting

Russell Westbrook leads the league in scoring, yet his scoring is less valuable to his team than Stephen Curry’s is to the Warriors. This sounds counterintuitive but it is related to the shooting efficiency of the player: Curry is extremely efficient and Westbrook is inefficient as a shooter. To help understand the significance of this I’ll use an extreme example. Suppose the worst shooter on a team took every one of a team’s 80 shots in a game and made 30% of them including two 3-point shots. He would score 24 baskets and lead the league in scoring by a mile at over 50 points per game (assuming he also got a few foul shots). However, his team would only average 50 or so points per game and likely would lose every one of them. If, instead, he took 20 of the 80 shots and players who were 50% shooters had the opportunity to take the other 60, the team’s field goals would increase from 24 to 36. Westbrook’s case is not the extreme of our example but none-the-less Westbrook has the lowest efficiency of the 7 people on his team who play the most minutes. So, I believe his team overall would score more points if other players had more shooting opportunities. Let’s look at the numbers.

Table 2: Shot Statistic Comparison

shots-table
*NBA.com statistics average per game through Feb 1st, 2017

Westbrook’s shooting percentage of 42.0% is lower than the worst shooting team in the league, Memphis at 43.2%, and, as mentioned is the lowest of the 7 people on his team that play the most minutes. Curry has a 5.5% higher percentage than Westbrook. But the difference in their effectiveness is even greater as Curry makes far more three point shots. Effective shooting percentage adjusts for 3 point shots made by considering them equal to 1½ two point shots. Curry’s effective shooting percentage is 59.1% and Westbrook’s is 46.4%, an extraordinary difference. However, Westbrook gets to the foul line more often and “true shooting percent” takes that into account by assuming about 2.3 foul shots have replaced one field goal attempt (2.3 is used rather than 2.0 to account for 3 point plays and being fouled on a 3-point shot). Using the “true shooting percentage” brings Westbrook’s efficiency slightly closer to Curry’s, but it is still nearly 10% below Curry (see table 2). What this means is very simple – if Curry took as many shots as Westbrook he would score far more. In fact, at his efficiency level he would average 36.1 points per game versus Westbrook’s 30.7. While it is difficult to prove this, I believe if Westbrook reduced his number of shots Oklahoma City would score more points, as other players on his team, with a higher shooting percentage, would have the opportunity to shoot more. And he might be able to boost his efficiency as a shooter by eliminating some ill-advised shots.


Turnovers vs Steals

This comparison determines how many net possessions a player loses for his team by committing more turnovers than he has steals. Stephen Curry averages 2.9 turnovers and 1.7 steals per game, resulting in a net loss of 1.2 possessions per game. Russell Westbrook commits about 5.5 turnovers per game and has an average of 1.6 steals, resulting in a net loss of 3.9 possessions per game, over 3 times the amount for Curry.


Plus/Minus

In many ways, this statistic is the most important one as it measures how much more a player’s team scores than its opponents when that player is on the floor. However, the number is impacted by who else is on your team so the quality of your teammates clearly will contribute.  Nonetheless, the total impact Curry has on a game through high effective shooting percent and assists/minute with the ball is certainly reflected in the average point differential for his team when he is on the floor. Curry leads the league in plus/minus for the season as his team averages 14.5 more points than its opponents per 36 minutes he plays.  Westbrook’s total for the season is 41st in the league and his team averages +3.4 points per 36 minutes.


Summing Up

While Russell Westbrook is certainly a worthy all-star, I believe that Stephen Curry deserves having been voted a starter (as does James Harden but I don’t think Harden’s selection has been questioned). Westbrook stands out as a great rebounding guard, but other aspects of his amazing triple double run are less remarkable when compared to Curry. Curry is a far more efficient scorer and any impartial analysis shows that he would average more points than Westbrook if he took the same number of shots. At the same time, Curry makes his teammates better by forcing opponents to space the floor, helping create more open shots for Durant, Thompson and others. He deserves some of the credit for Durant becoming a more efficient scorer this year than any time in his career. While Westbrook records a far larger number of assists per game than Curry, Curry is a more effective assist creator for the time he has the ball, helping the Warriors flirt with the 32-year-old record for team assists per game while Oklahoma City ranks 20th of the 30 current NBA teams with 10 less assists per game than the Warriors.

Next Gen Selling vs Old (or “Traditional”) Methods

In this post I want to compare the buying experiences I’ve had recently when purchasing from an older generation company vs a newer one. I think it highlights the fact that ecommerce based models can create a much better buying experience than traditional brick and mortar sellers when coupled with a multi-channel approach. The two companies I want to highlight are Tesla (where my wife recently purchased a car) and Warby Parker (where I recently bought a pair of glasses). I’ll compare them to Mercedes and LensCrafters but you should understand it almost doesn’t matter which older gen companies I compared them to, so just consider the ones I’ve chosen (due to recent personal experience) as representative of their industries.

Controlling the buying experience

Warby Parker began opening retail “Guideshops” a few years ago. I recently went into one and was very pleased with the experience. They displayed all the frames they have and there were only two price categories which included the prescription lenses and the frames, $95 and $145. I selected a frame, went over to the desk and received assistance in completing the transaction. The person assisting me took one measurement of my eyes and then suggested I get slightly better lenses for a charge of $30 which I think was only necessary due to my particular prescription. There were no other charges, no salesperson, no other upsells, no waiting while the glasses are being made. Once I paid by credit card, the glasses were put in their cue to be made at their factory and shipped to my home within 10 days (with no shipping charge) and my receipt was sent by email rather than printed. From the time I entered the store until I left was about 10 minutes.

Compare this experience to buying a pair of glasses at LensCrafters. At LensCrafters the price range of frames is all over the map without any apparent reason except many carry a designer brand logo (but are unlikely to have been designed by that designer). To me the Warby Parker frames are as good or better looking as far more expensive ones at LensCrafters.  Even if you select a frame at LensCrafters that costs $95-$300 or more, the lenses are not included. A salesperson then sits with you and begins the upselling process. Without going into all the details, suffice it to say that it is very difficult to discern what is really needed and therefore it is hard to walk out of the store without spending $100-$300 more than the cost of the frame. Further, since the glasses are made at the store you come back in a few hours to pick them up (of course this is a positive if you want them right away; I usually don’t care).  I have typically spent well over an hour in the buying process plus going for a coffee for the 2 hours or so it took for them to make the lenses.

Tesla has been very adamant about owning and controlling their physical retail outlets rather than having their cars sold by independent dealerships. This gives them multiple advantages as they completely control the buying experience, eliminate competition between dealers, reduce distribution cost and can decide what the purpose of each location is and how it should look. They have also eliminated having cars to sell on the lot but instead use an ecommerce model where you order a car exactly the way you want it and it gets produced for you and brought to the Tesla physical location you want for pickup. Essentially, they have designed two types of physical stores: one that has a few demo models to enable test drives and one that also has a customer service department. This means that the latter is a much smaller size than a traditional car dealership (as it doesn’t need space for new car inventory on the lot) and the former is much smaller than that. The showroom approach occupies such a small footprint that Tesla has been able to locate showrooms in high foot traffic (high cost per foot) locations like malls.  In their sites at the Stanford Mall and on Santana Row (two of the most expensive per square foot), Tesla kept the cars for test drives in the parking lots (at a fraction of the cost of store footage). When my wife decided to buy her second Tesla (trading in the older one) we spent about an hour at the dealer as there was no negotiation on price, the car could be configured to her exact specification on a screen at the dealership (or at home) and would be manufactured for her. There were no upsell attempts, no competing dealers to visit, and really no salesperson but rather a facilitator (much like at Warby Parker) that answered questions.

I bought my new car from Mercedes and had a much less pleasant buying experience. It starts with the fact that the price on the car isn’t the real price. This means that one needs to try to go to multiple dealers as well as online to get a better handle on what the real price is as the dealers are difficult to trust. Each dealer now has its own online person (or team) but this is actually still buying from a dealer. There is also a strong encouragement to buy a car in inventory (on the lot) and the idea of configuring the way one wants and ordering it is discouraged. The cars on the lot are frequently configured with costly (highly profitable) options that are unnecessary so that even with a discount from list one typically spends more than ordering it with only options you want and paying closer to list. After multiple days (and many, many hours) spent online and visiting dealerships I decided to replicate the Tesla concept and order a 2016 model to be built exactly how I wanted. Because I spent many hours shopping around, I still was able to get a price that was an extra $4,000 off list from what I had been offered if I bought a 2015 off the lot. The car was the color I wanted, only had the options I wanted and would have a higher resale value because of being a 2016. Since the list price had not increased and there were no unneeded options on the car I actually saved about $10,000 vs taking one off the lot with the lower discount even though all additional options I wanted were bundled with it.

Receiving the product

In the Warby Parker example, the glasses were shipped to my home in a very well designed box that enhanced their brand. The box contained an upscale case and a card that said: “For every pair of glasses sold, a pair is distributed to someone in need.” Buying at LensCrafters meant returning to the store for the glasses. The case included was a very cheap looking one (creating an upsell if one wanted a nicer case) and there was no packaging other than the case. However, I did get the glasses the same day and someone sat with me to make sure they fit well on my ears (fit was not an issue for me for the Warby Parker glasses but could be for some people).

On the automobile side, the car pickup at Tesla was a much better experience than the one at Mercedes. At Tesla, my wife and I spent a little over an hour at the pickup. We spent about 20 minutes on paperwork and 45 minutes getting a walk through on how various options on the car work. There were no attempts to upsell us on anything. At Mercedes the car pickup experience took nearly 4 hours and was very painful as over 3 hours of it was spent on paperwork and attempts at a variety of upsells. To be fair, we had decided to lease this car and that time occupied a portion of the paperwork. But the attempted upsells were extreme. The most ludicrous was trying to get us to buy an extended warranty when the included warranty exceeded the length of the lease. I could understand that it might be of value to some but, in our case, we told the lease person that we were only doing the lease so we wouldn’t own the car at the end of it. There were also upsells on various online services, and a number of other items. The time this took meant we did not have enough time left to go over all the features of the car. This process was clearly the way each person had been trained and was not a function of the particular people we dealt with. The actual salesperson who sold me the car was extremely nice but was working within a system that is not geared towards the customer experience as dealers can’t count on buyers returning even if they buy the same brand again.

Summary

There is a significant advantage being created by new models of doing business which control the complete distribution chain. Their physical locations have a much smaller footprint than traditional competitors which allow them to put their shops in high traffic locations without incurring commensurate cost. They consolidate inventory into a centralized location which reduces inventory cost, storage and obsolescence. They completely control the buying experience and understand that customer satisfaction leads to higher life time value of a customer.


SoundBytes

In my SoundByte post dated April 9, I discussed several of the metrics that caused me to conclude that Stephen Curry should be the 2014-15 season MVP. He subsequently received the award but it still appeared that many did not fully understand his value. I thought it was well captured in the post by looking at EFG, or effective shooting percentage (where a three point shot made counts as 1.5 two point shots made since its worth 50% more points), plus/minus and several other statistics not widely publicized. This year, Curry has become even better and I realized one other statistic might help highlight his value in an even better way, points created above the norm (PAN).

I define PAN as the extra points created versus an average NBA player through more effective shooting. It is calculated using this formula:

PAN= 2 x (the players average number of shots per game) x (players EFG- league norm EFG)

The league’s effective shooting percentage as of December 6 is 49.0%. Since Curry’s effective shooting percentage is 66.1% as of today date, the difference is 17.1%. Curry has been averaging 20.2 shots per game this year so his PAN = 2 x 20.2 x 17.1%= 6.9. This means Curry’s shooting alone (excluding foul shots) adds about 7 points per game to his team versus an average shooter. But, because Curry is unselfish and is often double teamed, he also contributes heavily to helping the team as a whole be more effective shooters. This leads to a team PAN of 14.0. Which means the Warriors score an extra 14 points a game due to more effective shooting.

Interestingly, when you compare this statistic to other league leaders and NBA stars, Curry’s contribution becomes even more remarkable. While Curry add about 7 points per game to his team versus an average shooter, James Harden, Dwayne Wade and Kobe Bryant are all contributing less than the average player. Given Curry’s wildly superior efficiency he is contributing almost twice as much as Kevin Durant.

Efficiency

With Curry’s far superior individual and team contribution to shooting efficiency, it is not surprising that the Warriors are outscoring their opponents by such record breaking margins.

To further emphasize how much Curry’s PAN impacts his team we compared him to Kobe Bryant. The difference in their PANs is 11.8 points per game. How much would it change the Lakers record if they had these extra 11.8 points per game and all else was equal? It would move the Lakers from the second worst point differential (only Philadelphia trails them) to 10th in the league and 4th among Western conference teams. Since point differential correlates closely to team record, that might mean the Lakers would be competing for home court in the playoffs instead of the worst record in the league!

The Argument for Curry as a Unicorn

In our previous post we posed the potential for Stephen Curry to become a Unicorn (in venture this is a company that reaches $1 billion in value). While it was mostly for fun, on reflection we decided that it actually could prove valid. This post will walk you through why an athlete like Curry (or potentially James Harden, Russell Westbrook or Anthony Davis) could become a Unicorn should they be elevated to the elite status of a LeBron James.

curry unicorn

The Precedent for Creating a Corporation Owning an Athlete’s Earnings Exists

In April 2014, Vernon Davis offered stock in his future earnings via a venture with Fantex, Inc. as part of a new financial instrument being sold by Fantex. Davis offered a 10% share of all future earnings from his brand marketing company to Fantex, which would then turn around and divide it into shares of a tracking stock that can be traded within their own exchange. The offering was 421,100 shares, valued at $10 each, for a total of $4.2 million. This implied a total value of the “Vernon Davis Corporation” of $42 million. Davis’ current salary is $4.7 million and endorsement income about $1.75 million for a total income of $6.5 million. Given that the longevity of football players is rarely into their mid-thirties coupled with Davis being over 30 at the time, it seems likely that he had no more than 3-4 years left in his playing career. Putting those facts together makes it appear that Davis was unlikely to earn much more than $42 million going forward and might earn less as we would expect his income to drop precipitously once he retired. So buying the stock was probably viewed as more of a symbol of support for Davis and its “market cap” appears about equal to his expected future earnings.

NBA Stars are Among the Highest Earning Athletes’

The current highest earner of endorsements in the NBA is LeBron James at about $44 million per year (Kevin Durant is second at $35 million). The highest contract in the league is Kobe Bryant at about $23 million per year (and had been $30 million previously) with the 10 highest players in the league making an average of over $21 million. Given the new TV contract scheduled to go into effect in the 2016-2017 season, it’s been projected that the cap will increase from about  $63 million today to $90 million in 2017 and be nearly $140 million by 2025 (10 years from now, at age 37, Curry should still be playing). Let’s make the following assumptions:

  1. Curry’s salary will go from a current level of $11 million in 2015 and 12 million in 2016 (4 other Warriors will be paid more that year) to about $30 million in 2017 assuming the top salaries tend to be about 1/3 of their team’s cap as they are today.
  2. It will be up to $40 million in 2025, or less than 1/3 the projected $140 million cap.
  3. His endorsements will reach midway between the current levels experienced by LeBron and Durant, to about $40 million by 2017 (they are currently at about $5.5 million from Under Armour)
  4. His endorsement income will rise by about 10%/year subsequently, through 2025 to reach $92 million in 2025
  5. He will continue to earn endorsement income (but will retire from playing) subsequent to the 2025 season.
  6. The level post 2025 will average $60 million per year for 10 years and then go to zero.

The last assumption is based on observing the income of retired stars like Michael Jordan (earning $100 million/year 12 years after retirement), David Beckham (earned about $75 million the first year after retiring), Arnold Palmer (earned $42 million/year 40 years after winning his last tournament), Shaq ($21 million), Magic Johnson is now worth over $500 million. Each are making more now than the total they made while playing and, in several cases, more per year than in their entire playing careers. So assuming Curry’s income will drop by 1/3 after retirement is consistent with these top earners.

chart

This puts his total income from 2016 through the end of 2035 at over $1.5 billion. All of the above assumptions can prove true if Curry continues to ascend to super-star status, which would be helped if the Warriors win the championship this year. They could even prove low if Curry played longer and/or remained an icon for longer than 10 years after retiring. Thankfully, Curry has remained relatively injury free and our analysis assumes that he remains healthy. Curry is not only one of the most exciting players to watch, but is also becoming the most popular player with fans around the league. Curry now ranks second overall in total uniform sales, behind LeBron James.

So while the concept of Stephen Curry as a Unicorn (reaching $1 billion in value) started as a fun one to contemplate with our last post, further analysis reveals that it is actually possible that Fantex or some other entity could create a tracking stock that might reach that type of valuation.

As a VC, I would love to invest in him!

SoundBytes:

  • In the recent game against the Blazers there was further validation of Curry’s MVP bid. Curry delivered eight 3-pointers, hit 17 of 23 shots and went 7-of-7 in his 19-point fourth quarter. His last two threes were a combined distance of 55 feet, setting a new record for threes in a season and breaking his own record!
  • To understand just how well Curry shot, his Field Goal Efficiency was 91% (he had 8 threes bringing his equivalent field goals to 21/23). Not only was this higher than anyone who scored 40 points this year or took at least 20 shots in a game, we believe it may be among the highest ever for someone taking 20 shots in a game.
  • As a comparison, the two Portland stars, Aldredge and Lillian, each had strong games and scored 27 and 20 points, respectively. But, to do that, they took 46 shots between them (double that of Curry) and only scored 2 more points in total for the extra 23 shots!
  • The 4th quarter performance by Curry, cited above, translates to a 114% FGE rating, which is averaging more than 100% shooting as he scored 16 points on 7 shots. When foul shots are taken into account, his True Shooting % was 137% as he scored 19 points on 8 field goal attempts (counting the one on which he was fouled).To draw a comparison, when Russell Westbrook scored 54 points against Portland on April 12 he took 43 shots, 20 more than Curry (23 more if we include shots that led to foul shots).

Is Stephen Curry Becoming a Unicorn?

Why Curry should be the clear NBA MVP

Much has been written about the importance of discovering and investing early in “Unicorns”, companies that eventually cross the $1 billion valuation threshold. In basketball, teams make tough decisions as to whether to sign individual players to contracts that can be worth as much as $120 million or more over six years. The top few players can earn a billion dollars over their career when endorsements are added to the equation, assuming they can last as long as a Kobe Bryant or Tim Duncan. Clearly part of the road to riches is getting the recognition as one of the elite. This year, several players previously thought of as “quite good” are emerging in the quest to be thought of as “great”. Nothing can help a player put his stamp on such a claim as much as winning the MVP. In the spirit of trying to identify a future “Unicorn” in professional basketball, I thought it would be fun to analyze the current crop of contenders.

Given an unusual emergence of multiple stars, this year’s NBA MVP race is one of the most hotly contested in years. There are five legitimate candidates: Stephen Curry, Russell Westbrook, James Harden, Anthony Davis and LeBron James. All of them are having spectacular seasons and in most years that would be good enough for them to win. But only one can take the MVP crown. LeBron is the reigning king of the league and has long ago hoisted his flag atop the mountain. But, he has won the MVP title a number of times and while he remains a solid choice, he is not a clear choice. Therefore, it appears almost certain that most voters will favor a candidate who has yet to win. In the last few weeks Davis seems to have faded from consideration so, in this post, I will provide the analysis that has led me to determine that Curry is a more worthy recipient than Westbrook and Harden.

Scoring

Basketball columnists and analysts often focus too much of their evaluation of success on a player’s scoring average. In an attempt to help understand a player’s full value, John Hollinger created a Player Efficiency Rating (PER) that incorporates several statistics in the hope it provides a single rating that determines the best player. While it is a truly worthy effort, we feel there is quite a bit of judgement incorporated in what value to place on different statistics.  For example, it rewards players who take more shots even when the extra shots are 2-pointers at a low field goal percentage (taking extra 2-point shots at over a 31% increases the rating even though that is well below what the rest of his team would likely shoot). We would place more value on giving the ball up (and having a lower scoring average) than taking a low percentage shot.

I am surprised that the simplest calculation of scoring efficiency does not surface as a regularly reported statistic. Some sources occasionally report an “Adjusted Field Goal Percentage” (AFG%) that counts a 3-point field goal as worth 1.5 times a 2-point field goal. We believe this is the correct way of viewing a shooter’s effectiveness and called it field goal efficiency (FGE%). It calculates the percentage as the equivalent of 2-point field goals made per field goal attempt (FGA):

FGE% = (2-point shots made + 1.5 x 3-point shots made)/FGA

There is one statistic that analysts call True Shooting Percentage (TS%) that goes one step further. It also takes foul shots into account. It assumes that 1 of every 9 foul shots is part of a 3-point (or 4-point) play and therefore considers 2.25 foul shots as the same as one field goal attempt (since most pairs of foul shots replace a field goal attempt). TS% is calculated by adding the field goal attempt equivalent of foul shots to normal field goal attempts to determine the equivalent number of attempts used by a player. By dividing points scored by 2 we know how points scored equates to 2-point field goals made (FGME). This translated to the following formula for TS%:

Equivalent field goal attempts (EFGA) = FGA + FTA/2.25

FGME = points scored/2

TS% =FGME/EFGA

Now let’s compare Curry, Harden and Westbrook based on these statistics all on a per game basis:

Slide1

Harden and Westbrook are neck-and-neck in scoring average, each about four points per game higher than Curry. But Curry plays fewer minutes per game and takes fewer shots. His shooting efficiency at 58.6% is by far the highest of the three by a significant amount (a full 14% higher than Westbrook and 7% higher than Harden). It is also the highest in the league for players that have taken at least 8 shots per game (which includes all of the top 100 players by scoring average). At over 90%, Curry is the number one foul shooter in the league. But Harden and Westbrook are also hitting roughly 85% of their foul shots. Therefore, the fact that they get fouled much more than Curry brings each of their TS%s closer to Curry’s. Still, Curry is a whopping 10% higher than Westbrook and 2.5% higher than Harden. It is apparent that the scoring average advantage is more a function of Curry playing fewer minutes and being more selective in his shots.

To see the impact of this we calculated their scoring average per 36 minutes played (which we consider about average for a team’s star) and points scored per 25 equivalent field goals attempts:

Slide2

So, even if he played the same amount of time as Harden and Westbrook, Curry would trail in average points per game, primarily because he still would take fewer shots. But if he took the same number of equivalent shots he’d have a higher scoring average than both.

A Few Other Statistical Comparisons

While scoring efficiency is an important measure of a players value to his team, several other statistics like assists, rebounds, and steals are also considered quite relevant. To make comparisons fair, we adjusted to the average per 36 minutes for each:

Slide3

For steals, Westbrook and Curry are close to dead even with Harden about 11% behind. However, Westbrook is the clear leader in rebounds and has 7% more assists than Curry with both well ahead of Harden.

Each of these three players leads their team’s offense. They all control the ball attempting to score themselves or assist others in scoring without turning the ball over, as every turnover is a lost scoring opportunity. The ratio of assists to turnovers helps capture effectiveness as a guard. On the defensive end they each can compensate for a portion of their turnovers by stealing the ball. The ratio of steals to turnovers captures how well they are able defensively to partly compensate for depriving their team of a scoring opportunity. But attempts to steal the ball can lead to more personal fouls. The ratio of steals to personal fouls helps understand defensive effectiveness. Here are the comparisons:

Slide4

Harden and Westbrook are 25%-40% behind Curry in all of these categories. What the first ratio tells us is that Curry passes the ball more accurately and/or takes less risk so that he gets his assists without turning the ball over as frequently as the others. Another way of looking at it is that the extra 0.6 assists that Westbrook averages per 36 minutes comes at the expense of one extra turnover vs Curry.  The steal/turnover ratio tells us that for every 3 turnovers Curry has, he is able to get the ball back twice through steals. The others recover less than half of their turnovers through steals. Finally the steals/personal foul ratio shows that Curry is quite effective defensively with a ratio that is over 30% better than either of the others.


Curry Creates the Most Team Success

So, what is the bottom line that helps capture the impact of the various statistics we have shown? Of course one measure is the fact that Curry has helped his team achieve a much better record. What other measure should be considered in evaluating a potential MVP’s impact on a team? Given Curry’s extremely high Field Goal Effectiveness, does his taking fewer shots help the team more than Harden and Westbrook taking more shots and scoring more? The league average for scoring per game is roughly 99.9 points (through about 76 games of the season). Each of the three help their team score at a higher rate than that, but Curry has led the Warriors to the highest scoring per game in the league. The comparison:

charts

A natural question is whether this superior offensive performance comes at the expense of inferior defense.  So we should include the average points given up per game by each team to round out the picture. Notice the Warriors allow fewer points per game than the league average while both the Thunder and the Rockets allow more than the league average. The combination for the Warriors means that they have the highest plus/minus in the league by quite a bit (the Warrior’s 10.4 is 60% higher than the Clippers who are second at 6.5), and it is nearly double the sum of the plus/minus for the Rockets and Thunder combined.

Slide6

The league also maintains plus/minus differential by player. That is how many more points a team scores than opponents when that player is on the floor.  In all three cases, it seems clear the players are driving the team’s effectiveness as their differential exceeds that of the teams (meaning that without them on the floor, the other team, on average, outscores their team). This statistic takes offense and defense into account and helps measure the influence a player has on his team’s effectiveness.

Slide7

This means that Curry is responsible for a 12.0-point improvement in plus/minus when on the floor versus how the team does when he isn’t, while both Westbrook and Harden improve their team’s plus/minus by 5.0 points. Given his top score in plus/minus, much higher Field Goal Effectiveness and TS%, combined with driving the Warriors to the top record in the league, it seems that Curry should be the league MVP and is on his way to becoming a Unicorn. As a VC, I would love to invest in him!

SoundBytes:

  • The recent ESPN selection of the top 20 players of the past 20 years is quite enlightening in how well the NBA markets their elite players compared to other sports. Despite the fact that football and baseball have a multiple of the number of players and are more popular sports, five of the 20 were from the NBA:
    • Number 1: Michael Jordon
    • Number 2: LeBron James
    • Number 8: Kobe Bryant
    • Number 11: Shaquille O’Neal
    • Number 14: Tim Duncan
  • There were 3 from football (all quarterbacks) and 2 each from baseball, tennis and soccer. And one each from 6 other sports (hockey, boxing, golf, swimming, track and cycling).
  • The four emerging stars (this includes Anthony Davis) we have discussed all have the potential to be on a future such list but their status among the greatest will also be dependent on their ability to win multiple championships. Winning MVPs makes a player great, winning multiple championships makes them one of the greatest.
  • Last night’s game against the Blazers was further validation’s of Curry’s MVP bid. Curry delivered eight 3-pointers, hit 17 of 23 shots and went 7-of-7 in his 19-point fourth quarter. His last two threes were a combined distance of 55 feet, setting a new record for threes in season and breaking his own record!