EVs will dominate new car sales within 5-6 years

What does that mean for Tesla and others?

EVs include both BEVs (Battery Electric Vehicles) and PHEVs (Plug-In Hybrid Electric Vehicles). We’ll start with a top-down view and then go into substantial detail regarding Tesla followed by some overall discussion of Rivian and Lucid.

California is taking the lead in banning sales of new gas-powered cars by 2035.

In August 2021, President Biden issued an Executive Order setting a target that by 2030, 50% of all new vehicles sold in the US will be net zero emitters of greenhouse gasses. He has recently added a goal of 60% by 2032. California has drawn a line in the sand regarding legislating the end of gas-powered vehicles. A measure approved by the California Air Resources Board requires all new light vehicles (passenger cars, SUVs and pick-up trucks) sold in the state in 2035 or later to generate zero emissions. It is a little unclear whether this will allow PHEVs to be sold, as they do generate emissions, but my reading suggests that PHEV models that can be charged at a charging station are probably not currently part of the ban. I expect this to change and believe PHEVs will be banned as well or fall to minimum sales once the conditions for BEVs described below are met. Six other states have already followed California’s lead: Maryland, Massachusetts, New Jersey, New York, Oregon, and Washington. Numerous other states are in the process of considering moving in the same or an even more aggressive direction.

I believe that most of the country and the rest of the world will follow in this direction (unless lobbying efforts slow progress) as the following issues are already or likely to be met by 2030:

  1. BEVs must offer enough driving range to make buyers comfortable;
  2. BEVs with the right characteristics need to become more affordable;
  3. There must be close to the same access to charging stations as gas cars have to gas stations.

Driving Range on dozens of BEVs will likely exceed 500 miles by 2030.

For perspective consider that (according to Electrek) in 2012 there were only 9 EVs available, 8 of which were Hybrids that, on average, could only drive about 70 miles on the battery. The 9th was the Tesla Model S which had a range of 265 miles but cost about $90,000. As late as 2016, there was still only one pure BEV with a driving range of over 300 miles, the Tesla Model S. By 2021, this number had expanded to 5, 3 of which were Tesla models. As of August 2023, there are 14 models with that range including 4 from Tesla, 2 from Rivian and one from Lucid. Lucid has the longest range, 520 miles, but the two Rivians and the Tesla Model S Long Range all are over 400 miles. The list includes 2 models from Ford, two from BMW, plus one each from Mercedes, Kia and Hyundai. What this suggests is that further increases in driving range are not only possible but extremely likely (in fact preliminary reports indicate the next version of the Tesla Model 3 due in 2024 will move to over 400 miles of driving range). I believe that in 7 years, or even sooner, there will be numerous models that have a range of over 500 miles, including all Tesla models, all Rivians and all Lucids. This is a technology issue and as we’ve seen with computers and phones, technology delivers better performance every year.

Affordability is already here…sort of!

The standard Model 3 is listed on Tesla’s website as having a manufacturers suggested retail price of $32,740 after the federal EV tax credit. But California also provides a state tax credit of $7500. After that credit the price drops to $25,240, $1,000 less than a gas-powered Toyota Camry. That doesn’t even consider the lower cost of service and fuel, or the higher resale value of the Tesla. This has led to the Model 3 replacing the Camry as the best-selling car in California, This depends on tax credits so we’re not quite at parity yet on affordability but given the trend we should be in several years.

Charging availability is increasing rapidly.

According to the Department of Energy, the number of charging stations in the US increased from 5,070 in 2011 to 143,711 at the end of 2022. This represents a compound annual growth rate of about 35.5%. The stations have also improved in their speed to charge. It is also easy to install a power line at home to be able to charge the vehicle every night, eliminating the need to use a charging station other than for long trips. Gas powered cars do not offer this convenience. For example, my wife and I recently went from our home in Atherton to Napa for a weekend, a distance of about 90 miles each way. In total, including visiting wineries and restaurants, we drove 340 miles. We never charged the car during the trip as her Tesla’s range is over 400 miles. There are currently over 145,000 gas stations in the US. The number of locations with charging stations now exceeds 54,000. At the historic  growth rate of over 35% this would mean that the number of charging locations could exceed the number of gas stations by the end of 2026. It is also likely that the number of gas stations could decline as the install base of gas-powered vehicles declines.

Sales of BEVs have reached an inflection point.

In 2022 worldwide sales of light vehicles (passenger cars, SUVs and pickup trucks) EVs reached over 10.5 million units, up 55% year/year. This occurred despite the sales of all light vehicles declining slightly versus 2021.

To understand where this is going, we initially need to produce a forecast for total light vehicle unit sales (which, for simplicity we’ll refer to as “cars”) in 2030. I have assumed that by 2026 global unit sales would return to 2018 levels which was 93.7 million according to IHS Markit. I then assumed the volume would grow by 2% per year through 2030. Some would argue that given population growth, matching 2018 volumes 3 years from now is too conservative. Others will say we will not get back to that level. I believe this to be a middle of the road assumption.

The second question is what share will BEVs be of total auto sales? In the table below I show a range that varies from 30% to 70% (BEVs are over 10% in 2023). If we apply the Biden 50% minimum goal for the US to worldwide sales, then the 2030 number would be 50% of 101.4 million units or 50.7 million units. This would mean an 8-year compound growth rate of 26.6% for unit sales of BEVs (it grew about 60% in 2022). Obviously, this is not an exact science!

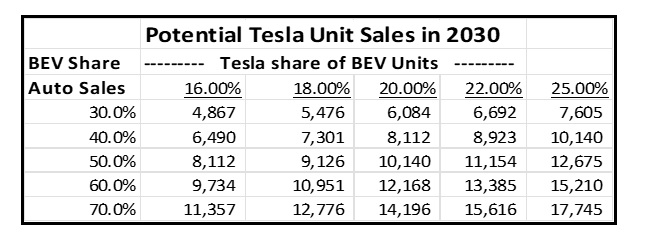
I expect Tesla unit sales to be about 8X 2022 levels in 2030.

In 2022 Tesla sold over 1.3 million BEV autos which was 17.1% of the BEV market. That is far from the full story as they did not participate in several large categories of vehicles: pickup trucks, low-cost autos, and sports cars. Their share was over 30% in the categories they did participate in. I believe that by 2030 Tesla will have added all three of these categories to its lineup. If we take the middle row and column of the above chart: BEVs have 50% market share and Tesla sells 20% of BEVs (which is 1/3 share lower than they currently have in categories in which they participate). That would mean Tesla will sell 10.14 million vehicles in 2030. If they did, the company would have an 8-year CAGR of 29%. This is well below the 50% growth they are tracking towards this year but of course the law of large numbers predicts a decline in high growth rates.  

Tesla Stock did not reflect strong expectations in 2022.

Despite revenue growth of over 50%, Tesla was one of the worst stocks in 2022. Partly this was due to fears that Elon’s acquisition of Twitter would be a distraction, partly it was due to the backlog shrinking and partly it was due to Elon liquidating a number of shares to finance the Twitter acquisition. In H1 2023 Tesla was one of the best stocks in the market (appreciating over 110%) as the backlog began to (slightly) expand again, Elon stopped selling shares (and promised to hold his position for the rest of 2023) and the Twitter acquisition became less of an issue to investors. It should be noted that as of September 10, Tesla shares have slipped by about 5% from the June 30 value over new fears that Tesla price cuts were hurting earnings. It was obvious to us that the price cuts were to leverage superior manufacturing cost and drive increased volume and this has in fact occurred, but Tesla will remain a volatile stock which is why premiums on Tesla calls are quite high.

Unlike some, we believe Tesla was smart to raise prices substantially in 2021 and 2022 while they could not meet demand. Then we believe they were smart to lower prices once their manufacturing capacity expanded, and backlog shrunk to a more normal level. Lowering prices places tremendous stress on the competition as Tesla has significant margin advantages over its competitors. Its net margins are still strong at lower prices, but many competitors don’t have the room to maintain margins at lower prices. Additionally, lowering prices on Tesla mass market vehicles meant that many Model Ys and Model 3s qualified for the US $7500 tax credit for electric vehicles that started on January 1, 2023. Nonetheless, the level of price decreases is worth monitoring as it does lower Tesla gross margins.

We expect Tesla unit sales to increase 45% to 55% in 2023.

Despite rising slightly in H1, the decrease in the Tesla backlog remains a concern to investors. At year end it was at about 44 days of production (or roughly ½ of units sold in Q4). While there are many elements to consider, some investors have a concern that it will be difficult for Tesla to achieve or exceed its target of 40% vehicle sales unit growth in 2023. Given already announced sales in Q2, Tesla unit sales were up 60% in H1. However, this includes a very weak comp in Q2 2022 due to China being closed for part of Q2 last year. Still if the company merely replicates Q2 sales in Q3 and Q4 for existing vehicles and adds sales of the Cybertruck to this total, 2023 growth would exceed 45%. There are several factors that indicate they are likely to continue to increase sales sequentially:

  1. In Q2 Tesla actually shipped more cars than it produced despite increasing production, while backlog remained relatively stable. 
  2. Historically Tesla has seen demand increase sequentially in virtually every quarter. If we assume a 7% increase going forward, then units will be up over 50% year over year in 2023 without any Cybertruck sales.
  3. The Tesla CyberTruck has a waitlist that exceeds 1.5 million vehicles. On August 16 Electrek reported that “truckloads” of Cybertrucks were spotted being delivered. These would not be for consumers but rather for final testing. Tesla has indicated that it will be hosting a launch date for the vehicle and speculation is that it will be quite soon. They then will begin building towards volume production starting in Q4. If existing product sales fall short of the 7% sequential increase in Q3 and Q4, sales of the CyberTruck could make up for the difference as these sales will be incremental to the current run rate for existing vehicles.
  4. The company now has the manufacturing capacity to increase volumes – the question will be parts supply and whether demand will be strong if the economy goes into a recession.

Despite a reduction in its backlog in 2022, demand for its vehicles continues to increase. As you hear of new competition in the electric vehicle market keep in mind that Tesla share of the US market for ALL cars is still only about 3% and in China and Europe it remains under 2%. As a comparison Toyota worldwide market share is over 13% and VW is not far behind. We estimate that Tesla’s share of BEVs in the categories it plays in is over 30%. Once it launches the Cybertruck it will increase its available market (TAM) substantially. But it will still need to launch a low-priced vehicle (in the $25,000 – $30,000 range) and a sports car (which it is working on) over the next 3-5 years to address the total market. As the world transitions to electric vehicles, we expect Tesla’s share of all auto sales to rise substantially even as it declines in dominance of the electric vehicle market. When the CyberTruck begins shipping, Tesla total backlog is likely to increase to over 1.6 million vehicles. And the CyberTruck current backlog isn’t expected to be fulfilled until late 2027! 

Tesla Margins

Tesla gross margins declined in Q1, as price decreases had an impact. In Q2 Tesla made further price decreases but this was partially offset by improved efficiency in newly launched factories in Berlin and Texas. While lower vehicle prices in 2023 and increasing cost of parts will place some pressure on gross margins, we still believe they will continue to remain by far the highest of any auto manufacturer:

  • Tesla, like Apple did for phones, is increasing the high margin software and subscription components of sales;
  • Add-on sales are likely to offset a portion of price decreases;
  • As its new factories ramp they will increase their efficiency; and
  • Tesla will have lower shipping cost to European buyers as the new Berlin factory reaches volume production.
  • A decline in gross margins can be at least partly offset by SG&A declining as a percentage of sales as revenue growth is likely to be higher than any increase in SG&A.

Revenue in the Semi category could surpass $10 billion in a few years.

To date the Tesla Semi has been produced in very small volumes and limited production capacity will mean deliveries will remain low during the next few quarters. We believe the ramping of Semi production will begin in late 2024 as the company only has a small number in customers’ hands today (essentially for test purposes). However, given its superior cost per mile the Semi is likely to become a major factor in the industry. Despite its price starting at $150,000, its cost per mile appears lower than any competitive products. Given potential of up to $40,000 in US government incentives the competitive advantage over diesels will be even greater. The company is expecting to increase production to about 50,000 per year by some time in 2025 (which would represent potential incremental high margin annual sales in the $8-$10 billion range). While this is ambitious, the demand could exceed that as it represents a single digit percent of the worldwide market for a product that should have the lowest cost/mile of any in the semi category.

Tesla Expects to launch a new Roadster in 2024

The new version of the roadster is being developed but it’s unclear when it will be ready for production as the target date has slipped multiple times. Right now, Tesla expects the launch to be in 2024. Once it launches, it will become another source of incremental demand at high margins. The early claims are that it will have a driving range of over 600 miles (at reasonable speeds), a top speed of 250 miles/hour, go zero to 60 in 1.9 seconds and cost about $200,000 for the standard model. This would make it faster than a McLaren.

The Bottom Line: Tesla should continue to have accelerated revenue growth in Autos.

This all points to solid revenue growth continuing (but at a lower level than unit sales growth in 2023), strong GMs in 2023 and beyond, and earnings escalation likely faster than gross margin dollar growth. While the company has reduced pricing, the ability to sell greater dollars in software should help maintain strong AOV and gross margins.

Tesla is not a one trick pony – it has several other potentially large revenue streams.

There are numerous other revenue sources for Tesla, especially on the energy side given its strong solar offerings and best-in-class power walls. Tesla also is a leader in automated driving and should that reach commercialization for “driverless taxis/driver services” the company is well positioned to add a substantial revenue stream. The discussion above regarding charging stations did not include the fact that Tesla is the runaway leader in this category (it just reached 50,000 units deployed) and its technology is probably going to become the standard. So, while I believe the vast majority of charging will take place in the home, Tesla will add another revenue stream from their infrastructure. Recently GM, Ford and Rivian have all decided to move to the Tesla charging technology.

Finally, there is some possibility that Tesla’s Optima Robot project will, at some point in the future, lead to launching smart robots that can perform numerous tasks. The company has taken its AI developed for autos as well as the variety of sensors integrated into a vehicle and transformed them to apply to robotics. At their AI day 11 months ago, they were able to demonstrate a humanoid alpha version that could walk with knowledge of what was in front of it and around it. The robot could also pick up objects and perform other simple tasks. We expect a significant leap forward at this year’s AI day scheduled for September 30. Elon, who tends towards optimistic thinking, has stated that he believes revenue from the Optima could exceed Auto revenue at some point in time!

A few comments on Rivian.

Rivian has gotten quite a bit of press regarding its opportunity to be one of the leaders in BEV pickup trucks and SUVs. The Rivian R1T electric pickup truck has recently earned the J.D. Power award for the most satisfying experience among BEVs (Tesla was second). The study, released in February, benchmarked EV owner satisfaction with critical attributes that affect the EV ownership experience. Reviewing 2022 and 2023 model year battery electric and plug-in hybrid vehicles, EV owners found R1T to be best among premium battery electric vehicles for driving enjoyment, vehicle quality and reliability, service experience, interior/exterior styling, cost of ownership, ease of charging at home and accuracy of stated battery range.

Cars.com reviews gave Rivian a 5.0 out of 5.0 rating with 100% of customers saying they would recommend it. A second review site, Edmunds, with a minimal number of reviews, was less favorable as most reviewers rated it highly, but several reviewers liked the vehicle but were dissatisfied with the quality of service. We believe the JD Power survey to be the most reliable. The strong customer experience positions the company for accelerated top line growth. In Q2 revenue was up over 200% year/year and unit sales increased 59% sequentially. Rivian also increased their guidance of how many vehicles they will ship this year to 52,000. Despite the Ford F150 pickup being touted as the clear leader in the category, CNBC reported that Rivian actually sold more electric pickup trucks in the US in H1 than anyone else. In a recent survey by Car Guru, 43% of potential truck buyers said they favored buying an electric vehicle.

Rivian also has an order to build 100,000 electric vans for Amazon. Amazon says it has taken delivery of 5,000 already and I have recently seen a few on the road in the SF Bay Area. I asked the driver of one what she thought of the product. Her reply was that it was quite an improvement versus her prior van. In searching for other products that compete there appear to be numerous others manufacturing this type of product. It’s hard to tell if the Rivian van has an overall advantage but it does seem to have the longest range of any that I found. This appears to be a very large opportunity for Rivian as the price of its vans start at $60,000 so the existing Amazon order is worth at least $6 billion (5.4X Q2 Rivian revenue) and Amazon could decide to expand the order. The fact that its competitors does not include Tesla puts Rivian in a strong position.

Given the quality of its vehicles, Rivian is well positioned to scale if they can fix their economics. In Q2 gross margins on its vehicles improved by $35,000/vehicle over a year earlier but still came in at a loss of $412 million. If the company can move to profitability (a target it expects to reach in late 2024) without compromising vehicle quality, it could be a very strong performing stock. The risk that they don’t get there before running out of cash has kept the stock value low.

Lucid appears to be struggling.

Lucid produces a very high-end electric sedan that directly competes with the Tesla Model S. The Lucid Air is more luxurious and has a longer driving range than the Tesla but also costs more. The product gets great reviews from magazines like Car & Driver who said: “ As luxury electric sedans go, the Air is a home run, delivering a posh overall experience with an unbeatable driving range.” Given such accolades many thought the Air would be a worthy competitor to Tesla. However, consumers have not embraced the product as their reviews are just OK. Cars.com reviewers gave it an average rating of 3.3 out of 5 and only 46% of those reviewed said they would recommend it. As a comparison the Tesla Model S received a 4.0 average rating and 80% of reviewers said they would recommend the car. Admittedly, the number of reviews was small, but this is still an issue for Lucid.

Lucid appears to have lost momentum in the marketplace as Q2 sales of 1,404 units were flat compared to Q1 and fell well short of Wall Street expectations of 2,000 units. This also put into question whether Lucid was successfully converting the 28,000 reservations it had previously disclosed.

On the positive side, Lucid is extremely well funded and struck two interesting deals in the quarter:

  1. To supply Aston Martin with power trains, battery systems and related technology in a deal worth $232 million.
  2. To begin sending cars to Saudi Arabia which may help relieve the company’s inventory build up as it produced over 1,700 more vehicles than it sold in H1.

Both deals must be taken with a grain of salt as the Saudi Arabia Public Investment Fund is a major backer of both Lucid and Aston Martin.

Lucid will be launching new lower priced vehicles going forward so it still remains a company with potential given its ample capital, quality technology and well-designed vehicle. But, unlike Rivian which has carved out a niche where Tesla is not a direct competitor (now or in the near future), Lucid will have to find a way to be more successful versus this dynamo.

Recap of 2020 Top Ten Predictions

Tesla’s new pickup truck due out late 2021

Bull Markets have Tended to Favor My Stock Picks

This may seem like a repeat of what you have heard from me in the past, but I enter each year with some trepidation as my favored stocks are high beta and usually had increased in value the prior year (in 2019 they were up about 46% or nearly double the S&P which also had a strong year). The fact is: I’m typically nervous that somehow my “luck” will run out. But, in 2020 I was actually pretty confident that my stock picks would perform well and would beat the market. I felt this confidence because the companies I liked were poised for another very strong growth year, had appreciated well under their growth over the prior 2-year period and were dominant players in each of their sub-sectors. Of course, no one could foresee the crazy year we would all face in 2020 as the worldwide pandemic radically changed society’s activities, purchasing behavior, and means of communication. As it turns out, of the 6 stocks I included in my top ten list 3 were beneficiaries of the pandemic, 2 were hurt by it and one was close to neutral. The pandemic beneficiaries experienced above normal revenue growth and each of the others faired reasonably well despite Covid’s impact. The market, after a major decline in March closed the year with double digit gains. Having said all that, I may never replicate my outperformance in 2020 as the 6 stocks had an average gain of an astounding 259% and every one of them outperformed the S&P gain of 14.6% quite handily.

Before reviewing each of my top ten from last year, I would like to once again reveal long term performance of the stock pick portion of the top ten list. I assume equal weighting for each stock in each year to come up with performance and then compound the yearly gains (or losses) to provide the 7-year performance. I’m comparing the S&P index at December 31 of each year to determine annual performance.  Soundbyte’s compound gain for the 7-year period is 2049% which equates to an IRR of 55.0%. The S&P was up 106.1% during the same 7-year period, an IRR of 10.9%.

2020 Non-Stock Top Ten Predictions also Impacted by Covid

The pandemic not only affected stock performance, it had serious impact on my non-stock predictions. In the extreme, my prediction regarding the Warriors 2020-2021 season essentially became moot as the season was postponed to start in late December…so had barely over a week of games in the current year! My other 3 predictions were all affected as well. I’ll discuss each after reviewing the stock picks.

The 2020 Stocks Picked to Outperform the Market (S&P 500)

  1. Tesla Stock which closed 2019 at $418/share and split 5 for 1 subsequently
  2. Facebook which closed 2019 at $205/share
  3. DocuSign which closed 2019 at $74/share
  4. Stitch Fix which closed 2019 at $25.66/share
  5. Amazon which closed 2019 at $1848/share
  6. Zoom Video Communications which closed 2019 at $72.20/share

In last year’s recap I noted 3 of my picks had “amazing performance” as they were up between 51% and 72%. That is indeed amazing in any year. However, 2020 was not “any year”. The 6 picks made 2019 gains look like chopped liver as 4 of my 6 picks were up well over 100%, a 5th was up over 70% and the last had gains of double the S&P. In the discussion below, I’ve listed in bold each of my ten predictions and give an evaluation of how I fared on each.

1. Tesla stock appreciation will continue to outperform the market (it closed last year at $418/share). Note that after the 5 for 1 split this adjusts to $84.50/share.

In 2020, Tesla provided one of the wildest rides I’ve ever seen. By all appearances, it was negatively impacted by the pandemic for three reasons: people reduced the amount they drove thereby lessening demand for buying a new vehicle, supply chains were disrupted, and Tesla’s Fremont plant was forced to be closed for seven weeks thereby limiting supply. Yet the company continued to establish itself as the dominant player in electronic, self-driving vehicles. It may have increased its lead in user software in its cars and it continued to maintain substantial advantages in battery technology. The environment was also quite favorable for a market share increase of eco-friendly vehicles.

Additionally, several other factors helped create demand for the stock. The 5 for 1 stock split, announced in August was clearly a factor in a 75% gain over a 3-week period. Inclusion in the S&P 500 helped cause an additional spike in the latter part of the year. Tesla expanded its product line into 2 new categories by launching the Model Y, a compact SUV, to rave reviews and demonstrating its planned pickup truck (due in late 2021) as well. While the truck demo had some snags, orders for it (with a small deposit) are currently over 650,000 units.

All in all, these factors led to Tesla closing the year at $706/share, post-split, an astounding gain of 744% making this the largest one year gain I’ve had in the 7 years of Soundbytes.

2. Facebook Stock will outpace the market (it closed 2019 at $205 per share)

Facebook was one of the companies that was hurt by the pandemic as major categories of advertising essentially disappeared for months. Among these were live events of any kind and associated ticketing company advertising, airlines and cruise lines, off-line retail, hotels, and much more. Combine this with the company’s continued issues with regulatory bodies, its stock faced an uphill battle in 2020. What enabled it to close the year at $273 per share, up 33% (over 2x the S&P), is that its valuation remains low by straight financial metrics.

3. DocuSign stock appreciation will continue to outperform the market (it closed 2019 at $74/share)

DocuSign was another beneficiary of the pandemic as it helped speed the use of eSignature technology. The acceleration boosted revenue growth to 53% YoY in Q3, 2021 (the quarter ended on October 31, 2020) from 39% in Fiscal 2020.  Since growth typically declines for high-growth companies this was significant. Investors also seemed to agree with me that the company would not lose the gains when the pandemic ends. Further, DocuSign expanded its product range into contract life-cycle management and several other categories thereby growing its TAM (total available market). Despite increased usage, DocuSign COGs did not rise (Gross Margin was 79% in Q3). Finally, competition appeared to weaken as its biggest competitor, Adobe, lost considerable ground. This all led to a sizable stock gain of 200% to $222/share at year end.

4. Stitch Fix stock appreciation will continue to outperform the market (it closed 2019 at $25.66/share)

Stitch Fix had a roller coaster year mostly due to the pandemic driving people to work from home, which led to a decline in purchasing of clothes. I’m guessing many of you, like me, wear jeans and a fleece or sweatshirt most days so our need for new clothes is reduced. This caused Stitch Fix to have negative growth earlier in the year and for its stock to drop in price over 50% by early April. But, the other side of the equation is that brick and mortar stores lost meaningful share to eMerchants like Stitch Fix. So, in the October quarter, Stitch Fix returned to growth after 2 weak quarters caused by the pandemic. The growth of revenue at 10% YoY was below their pre-pandemic level but represented a dramatic turn in its fortunes. Additionally, the CEO guided to 20-25% growth going forward. The stock reacted very positively and closed the year at $58.72/share up 129% for the year.

5. Amazon stock strategy will outpace the market (it closed last year at $1848/share)

Amazon had a banner year in 2020 with a jump in growth driven by the pandemic. Net sales grew 37% YoY in Q3 as compared to an approximate 20% level, pre-pandemic. Their gains were in every category and every geography but certainly eCommerce led the way as consumers shifted more of their buying to the web. Of course, such a shift also meant increased growth for AWS as well. Net Income in Q3 was up 197% YoY to over $6.3 billion. Given the increase in its growth rate and strong earnings the stock performed quite well in 2020 and was up 76% to $3257/share.

In our post we also recommended selling puts with a strike price of $1750 as an augmented strategy to boost returns. Had someone done that the return would have increased to 89%. For the purposes of blog performance, I will continue to use the stock price increase for performance. Regardless, this pick was another winner.

6. I added Zoom Media to the list of recommended stocks. It closed 2019 at $72.20

When I put Zoom on my list of recommended stocks, I had no idea we’d be going through a pandemic that would turn it into a household name. Instead, I was confident that the migration from audio calls to video conference calls would continue to accelerate and Zoom has the best product and pricing in the category. For its fiscal 2020-year (ending in January, 2020) Zoom grew revenue 78% with the final sequential quarter of the year growth at 13.0%. Once the pandemic hit, Zoom sales accelerated greatly with the April quarter up 74% sequentially and 169% YoY. The April quarter only had 5 weeks of pandemic benefit. The July quarter had a full 3 months of benefit and increased an astounding 102% sequentially and 355% YoY.  Q3, the October quarter continued the upward trend but now had a full quarter of the pandemic as a sequential compare. So, while the YoY growth was 367%, the sequential quarterly growth began to normalize. At over 17% it still exceeded what it was averaging for the quarters preceding the pandemic but was a disappointment to investors and the stock has been trading off since reporting Q3 numbers. Regardless of the pullback, the stock is ahead 369% in 2020, closing the year at $337/share .

In the post we also outlined a strategy that combined selling both put and call options with purchasing the stock. Later in the year we pointed out that buying back the calls and selling the stock made sense mid-year if one wanted to maximize IRR. If one had followed the strategy (including the buyback we suggested) the return would still have been well over a 100% IRR but clearly lower than the return without the options. As with Amazon, for blog performance, we are only focused on the straight stock strategy. And this recommendation turned out to be stellar.

Unusual Year for the Non-Stock Predictions

7. The major election year will cause a substantial increase in advertising dollars spent

This forecast proved quite valid. Michael Bloomberg alone spent over $1 billion during his primary run. The Center for Responsive Politics reported that they projected just under $11 billion in spending would take place between candidates for president, the Senate and the House in the general election. This was about 50% higher than in 2016. Additionally, there will be incremental dollars devoted to the runoff Senate races in Georgia. This increase helped advertising companies offset some of the lost revenue discussed above.

8. Automation of Retail will continue to gain momentum

Given the pandemic, most projects were suspended so this did not take place. And it may be a while before we have enough normalization for this trend to resume, but I am confident it will. However, the pandemic also caused an acceleration in eCommerce for brick and mortar supermarkets and restaurants. I’m guessing almost everyone reading this post has increased their use of one or more of: Instacart, Amazon Fresh, Walmart delivery, Safeway delivery, Uber Eats, GrubHub, Doordash, etc. My wife and I even started ordering specialty foods (like lox) from New York through either Goldbelly or Zabars. Restaurants that would not have dreamed of focusing on takeout through eCommerce are now immersed in it. While this was not the automation that I had contemplated it still represents a radical change.

9. The Warriors will come back strong in the 2020/2021 season

This was my fun prediction. Unfortunately, the combination of injuries and Covid eliminated fun for sports fans. I expected that there would be enough games in 2020 to evaluate whether my forecast was correct or not. Since the season started in late December its premature to evaluate it. Also, I pointed out that the team had to stay relatively healthy for the prediction to work. Guess what? The Warriors have already had 2 devastating injuries (Thompson the critical one, and Chriss, who I expected would help the second team as well).

Yet, several things I predicted in the post have occurred:

  1. The younger players did develop last season, especially Pascal
  2.  The Warriors did get a very high draft choice and at first blush he seems like a winner
  3. The Warriors did use the Iguodala cap space to sign a strong veteran, Oubre.

Given the absence of Thompson, the team will be successful if they make the playoffs. So, let’s suspend evaluating the forecast to see if that occurs in a packed Western Conference despite losing Thompson. Last year they started 4 and 16. For the 2020-2021 season  (as of January 3) they are 3 and 3 and appear to be a much better team that needs time to jell. But the jury is out as to how good (or bad) they will be. 

10. At least one of the major Unicorns will be acquired by a larger player

There were 9 Unicorns listed in the post. Eight are still going at it by themselves but the 9th, Slack, has recently been acquired by SalesForce making this an accurate prediction.

2021 Predictions coming soon

Stay tuned for my top ten predictions for 2021… but please note most of the 6 stocks from 2020 will continue on the list and as usual, for these stocks, we will use their 2020 closing prices as the start price for 2021. For any new stock we add, we will use the price of the stock as we are writing the post.

Soundbytes

I thought I would share something I saw elsewhere regarding New Year’s wishes. In the past most people wished for things like success for themselves and/or family members in one form or another. The pandemic has even transformed this. Today, I believe most people are more focused on wishing for health for them, their family, friends, and an end to this terrible pandemic. Please take care of yourselves, stay safe. We are getting closer to the end as vaccines are here and will get rolled out to all of us over the next 4-6 months.

2020 Top Ten Predictions

I wanted to start this post by repeating something I discussed in my top ten lists in 2017 and 2018 which I learned while at Sanford Bernstein in my Wall Street days: “Owning companies that have strong competitive advantages and a great business model in a potentially mega-sized market can create the largest performance gains over time (assuming one is correct).” It does make my stock predictions somewhat boring (as they were on Wall Street where my top picks, Dell and Microsoft each appreciated over 100X over the ten years I was recommending them).

Let’s do a little simple math. Suppose one can generate an IRR of 26% per year (my target is to be over 25%) over a long period of time.  The wonder of compounding is that at 26% per year your assets will double every 3 years. In 6 years, this would mean 4X your original investment dollars and in 12 years the result would be 16X. For comparison purposes, at 5% per year your assets would only be 1.8X in 12 years and at 10% IRR 3.1X.  While 25%+ IRR represents very high performance, I have been fortunate enough to consistently exceed it (but always am worried that it can’t keep up)! For my recommendations of the past 6 years, the IRR is 34.8% and since this exceeds 26%, the 6-year performance  is roughly 6X rather than 4X.

What is the trick to achieving 25% plus IRR? Here are a few of my basic rules:

  1. Start with companies growing revenue 20% or more, where those closer to 20% also have opportunity to expand income faster than revenue
  2. Make sure the market they are attacking is large enough to support continued high growth for at least 5 years forward
  3. Stay away from companies that don’t have profitability in sight as companies eventually should trade at a multiple of earnings.
  4. Only choose companies with competitive advantages in their space
  5. Re-evaluate your choices periodically but don’t be consumed by short term movement

As I go through each of my 6 stock picks I have also considered where the stock currently trades relative to its growth and other performance metrics. With that in mind, as is my tendency (and was stated in my last post), I am continuing to recommend Tesla, Facebook, Amazon, Stitch Fix and DocuSign. I am adding Zoom Video Communications (ZM) to the list. For Zoom and Amazon I will recommend a more complex transaction to achieve my target return.

2020 Stock Recommendations:

1. Tesla stock appreciation will continue to outperform the market (it closed last year at $418/share)

Tesla is likely to continue to be a volatile stock, but it has so many positives in front of it that I believe it wise to continue to own it. The upward trend in units and revenue should be strong in 2020 because:

  • The model 3 continues to be one of the most attractive cars on the market. Electric Car Reviews has come out with a report stating that Model 3 cost of ownership not only blows away the Audi AS but is also lower than a Toyota Camry! The analysis is that the 5-year cost of ownership of the Tesla is $0.46 per mile while the Audi AS comes in 70% higher at $0.80 per mile. While Audi being more expensive is no surprise, what is shocking is how much more expensive it is. The report also determined that Toyota Camry has a higher cost as well ($0.49/mile)! Given the fact that the Tesla is a luxury vehicle and the Camry is far from that, why would anyone with this knowledge decide to buy a low-end car like a Camry over a Model 3 when the Camry costs more to own?  What gets the Tesla to a lower cost than the Camry is much lower fuel cost, virtually no maintenance cost and high resale value. While the Camry purchase price is lower, these factors more than make up for the initial price difference
  • China, the largest market for electronic vehicles, is about to take off in sales. With the new production facility in China going live, Tesla will be able to significantly increase production in 2020 and will benefit from the car no longer being subject to import duties in China.  
  • European demand for Teslas is increasing dramatically. With its Chinese plant going live, Tesla will be able to partly meet European demand which could be as high as the U.S. in the future. The company is building another factory in Europe in anticipation. The earliest indicator of just how much market share Tesla can reach has occurred in Norway where electric cars receive numerous incentives. Tesla is now the best selling car in that country and demand for electric cars there now exceeds gas driven vehicles.

While 2020 is shaping up as a stairstep uptick in sales for Tesla given increased capacity and demand, various factors augur continued growth well beyond 2020. For example, Tesla is only partway towards having a full lineup of vehicles. In the future it will add:

  • Pickup trucks – where pre-orders and recent surveys indicate it will acquire 10-20% of that market
  • A lower priced SUV – at Model 3 type pricing this will be attacking a much larger market than the Model X
  • A sports car – early specifications indicate that it could rival Ferrari in performance but at pricing more like a Porsche
  • A refreshed version of the Model S
  • A semi – where the lower cost of fuel and maintenance could mean strong market share.

2. Facebook stock appreciation will continue to outperform the market (it closed last year at $205/share)

Facebook, like Tesla, continues to have a great deal of controversy surrounding it and therefore may sometimes have price drops that its financial metrics do not warrant. This was the case in 2018 when the stock dropped 28% in value during that year. While 2019 partly recovered from what I believe was an excessive reaction, it’s important to note that the 2019 year-end price of $205/share was only 16% higher than at the end of 2017 while trailing revenue will have grown by about 75% in the 2-year period. The EPS run rate should be up in a similar way after a few quarters of lower earnings in early 2019. My point is that the stock remains at a low price given its metrics. I expect Q4 to be quite strong and believe 2020 will continue to show solid growth.

The Facebook platform is still increasing the number of active users, albeit by only about 5%-6%. Additionally, Facebook continues to increase inventory utilization and pricing. In fact, given what I anticipate will be added advertising spend due to the heated elections for president, senate seats, governorships etc., Facebook advertising inventory usage and rates could increase faster (see prediction 7 on election spending).  

Facebook should also benefit by an acceleration of commerce and increased monetization of advertising on Instagram. Facebook started monetizing that platform in 2017 and Instagram revenue has been growing exponentially and is likely to close out 2019 at well over $10 billion. A wild card for growth is potential monetization of WhatsApp. That platform now has over 1.5 billion active users with over 300 million active every day. It appears close to beginning monetization.

The factors discussed could enable Facebook to continue to grow revenue at 20% – 30% annually for another 3-5 years making it a sound longer term investment.

3. DocuSign stock appreciation will continue to outperform the market (it closed last year at $74/share)

DocuSign is the runaway leader in e-signatures facilitating multiple parties signing documents in a secure, reliable way for board resolutions, mortgages, investment documents, etc. Being the early leader creates a network effect, as hundreds of millions of people are in the DocuSign e-signature database. The company has worked hard to expand its scope of usage for both enterprise and smaller companies by adding software for full life-cycle management of agreements. This includes the process of generating, redlining, and negotiating agreements in a multi-user environment, all under secure conditions. On the small business side, the DocuSign product is called DocuSign Negotiate and is integrated with Salesforce.

The company is a SaaS company with a stable revenue base of over 560,000 customers at the end of October, up well over 20% from a year earlier. Its strategy is one of land and expand with revenue from existing customers increasing each year leading to a roughly 40% year over year revenue increase in the most recent quarter (fiscal Q3). SaaS products account for over 95% of revenue with professional services providing the rest. As a SaaS company, gross margins are high at 79% (on a non-GAAP basis).

The company has now reached positive earnings on a non-GAAP basis of $0.11/share versus $0.00 a year ago. I use non-GAAP as GAAP financials distort actual results by creating extra cost on the P&L if the company’s stock appreciates. These costs are theoretic rather than real.

My only concern with this recommendation is that the stock has had a 72% runup in 2019 but given its growth, move to positive earnings and the fact that SaaS companies trade at higher multiples of revenue than others I still believe it can outperform this year.

4. Stitch Fix Stock appreciation will continue to outperform the market (it closed last year at $25.66/share)

Stitch Fix offers customers, who are primarily women, the ability to shop from home by sending them a box with several items selected based on sophisticated analysis of her profile and prior purchases. The customer pays a $20 “styling fee” for the box which can be applied towards purchasing anything in the box. The company is the strong leader in the space with revenue approaching a $2 billion run rate. Unlike many of the recent IPO companies, it has shown an ability to balance growth and earnings. The stock had a strong 2019 ending the year at $25.66 per share up 51% over the 2018 closing price. Despite this, our valuation methodology continues to show it to be substantially under valued and it remains one of my picks for 2020. The likely cause of what I believe is a low valuation is a fear of Amazon making it difficult for Stitch Fix to succeed. As the company gets larger this fear should recede helping the multiple to expand.  

Stitch Fix continues to add higher-end brands and to increase its reach into men, plus sizes and kids. Its algorithms to personalize each box of clothes it ships keeps improving. Therefore, the company can spend less on acquiring new customers as it has increased its ability to get existing customers to spend more and come back more often. Stitch Fix can continue to grow its revenue from women in the U.S. with expansion opportunities in international markets over time. I believe the company can continue to grow by roughly 20% or more in 2020 and beyond.

Stitch Fix revenue growth (of over 21% in the latest reported quarter) comes from a combination of increasing the number of active clients by 17% to 3.4 million, coupled with driving higher revenue per active client. The company accomplished this while generating profits on a non-GAAP basis.

5. Amazon stock strategy will outpace the market (it closed last year at $1848/share).

Amazon shares increased by 23% last year while revenue in Q3 was up 24% year over year. This meant the stock performance mirrored revenue growth. Growth in the core commerce business has slowed but Amazon’s cloud and echo/Alexa businesses are strong enough to help the company maintain roughly 20% growth in 2020. The company continues to invest heavily in R&D with a push to create automated retail stores one of its latest initiatives. If that proves successful, Amazon can greatly expand its physical presence and potentially increase growth through the rollout of numerous brick and mortar locations. But at its current size, it will be difficult for the company to maintain over 20% revenue growth for many years (excluding acquisitions) so I am suggesting a more complex investment in this stock:

  1. Buy X shares of the stock (or keep the ones you have)
  2. Sell Amazon puts for the same number of shares with the puts expiring on January 15, 2021 and having a strike price of $1750. The most recent sale of these puts was for over $126
  3. So, net out of pocket cost would be reduced to $1722
  4. A 20% increase in the stock price (roughly Amazon’s growth rate) would mean 29% growth in value since the puts would expire worthless
  5. If the stock declined 226 points the option sale would be a break-even. Any decline beyond that and you would lose additional dollars.
  6. If the options still have a premium on December 31, I will measure their value on January 15, 2021 for the purposes of performance.

6. I’m adding Zoom Video Communications to the list but with an even more complex investment strategy (the stock is currently at $72.20)

I discussed Zoom Video Communications (ZM) in my post on June 24, 2019. In that post I described the reasons I liked Zoom for the long term:

  1. Revenue retention of a cohort was about 140%
  2. It acquires customers very efficiently with a payback period of 7 months as the host of a Zoom call invites various people to participate in the call and those who are not already Zoom users can be readily targeted by the company at little cost
  3. Gross Margins are over 80% and could increase
  4. The product has been rated best in class numerous times
  5. Its compression technology (the key ingredient in making video high quality) appears to have a multi-year lead over the competition
  6. Adding to those reasons it’s important to note that ZM is improving earnings and was slightly profitable in its most recent reported quarter

The fly in the ointment was that my valuation technology showed that it was overvalued. However, I came up with a way of “future pricing” the stock. Since I expected revenue to grow by about 150% over the next 7 quarters (at the time it was growing over 100% year over year) “future pricing” would make it an attractive stock. This was possible due to the extremely high premiums for options in the stock. So far that call is working out. Despite the company growing revenue in the 3 quarters subsequent to my post by over 57%, my concern about valuation has proven correct and the stock has declined from $76.92 to $72.20. If I closed out the position today by selling the stock and buying back the options (see Table 1) my return for less than 7.5 months would be a 42% profit. This has occurred despite the stock declining slightly due to shrinkage in the premiums.

Table 1: Previous Zoom trade and proposed trade

I typically prefer using longer term options for doing this type of trade as revenue growth of this magnitude should eventually cause the stock to rise, plus the premiums on options that are further out are much higher, reducing the risk profile, but I will construct this trade so that the options expire on January 15, 2021 to be able to evaluate it in one year. In measuring my performance we’ll use the closing stock price on the option expiration date, January 15, 2021 since premiums in options persist until their expiration date so the extra 2 weeks leads to better optimization of the trade.

So, here is the proposed trade (see table 1):

  1. Buy X shares of the stock at $72.20 (today’s price)
  2. Sell Calls for X shares expiring January 15, 2021 at a strike of $80/share for $11.50 (same as last price it traded)
  3. Sell puts for X shares expiring January 15, 2021 with strike of $65/share for $10.00 (same as last price it traded)

I expect revenue growth of 60% or more 4 quarters out. I also expect the stock to rise some portion of that, as it is now closer to its value than when I did the earlier transaction on May 31, 2019. Check my prior post for further analysis on Zoom, but here are 3 cases that matter at December 31, 2020:

  • Stock closes over $80/share (up 11% or more) at end of the year: the profit would be 58% of the net cost of the transaction
    • This would happen because the stock would be called, and you would get $80/share
    • The put would expire worthless
    • Since you paid a net cost of $50.70, net profit would be $29.30
  • Stock closes flat at $72.20:  your profit would be $21.50 (42%)
    • The put and the call would each expire worthless, so you would earn the original premiums you received when you sold them
    • The stock would be worth the same as what you paid
  • Stock closes at $57.85 on December 31: you would be at break even. If it closed lower, then losses would accumulate twice as quickly:
    • The put holder would require you to buy the stock at the put exercise price of $65, $7.15 more than it would be worth
    • The call would expire worthless
    • The original stock would have declined from $72.20 to $57.85, a loss of $14.35
    • The loss on the stock and put together would equal $21.50, the original premiums you received for those options

Outside of my stock picks, I always like to make a few non-stock predictions for the year ahead.

7. The major election year will cause a substantial increase in advertising dollars spent

According to Advertising Analytics political spending has grown an average of 27% per year since 2012. Both the rise of Super PACs and the launch of online donation tools such as ActBlue have substantially contributed to this growth. While much of the spend is targeted at TV, online platforms have seen an increasing share of the dollars, especially Facebook and Google. The spend is primarily in even years, as those are the ones with senate, house and gubernatorial races (except for minor exceptions). Of course, every 4th year this is boosted by the added spend from presidential candidates. The Wall Street Journal projects the 2020 amount will be about $9.9 billion…up nearly 60% from the 2016 election year. It should be noted that the forecast was prior to Bloomberg entering the race and if he remains a viable candidate an additional $2 billion or more could be added to this total.

The portion targeted at the digital world is projected to be about $2.8 billion or about 2.2% of total digital ad spending. Much of these dollars will likely go to Facebook and Google. This spend has a dual impact: first it adds to the revenue of each platform in a direct way, but secondly it can also cause the cost of advertising on those platforms to rise for others as well.

8. Automation of Retail will continue to gain momentum

This will happen in multiple ways, including:

  1. More Brick & Mortar locations will offer some or all the SKUs in the store for online purchase through Kiosks (assisted by clerks/sales personnel). By doing this, merchants will be able to offer a larger variety of items, styles, sizes and colors than can be carried in any one outlet. In addition, the consolidation of inventory achieved in this manner will add efficiency to the business model. In the case of clothing, such stores will carry samples of items so the customer can try them on, partly to optimize fit but also to determine whether he or she likes the way it looks and feels on them. If one observes the massive use of Kiosks at airports it becomes obvious that they reduce the number of employees needed and can speed up checking in. One conclusion is this will be the wave of the future for multiple consumer-based industries.
  2. Many more locations will begin incorporating technology to eliminate the number of employees needed in their stores. Amazon will likely be a leader in this, but others will also provide ways to reduce the cost of ordering, picking goods, checking out and receiving information while at the store.

9. The Warriors will come back strong in the 2020/21 season

Let me begin by saying that this prediction is not being made because I have been so humbled by my miss in the July post where I predicted that the Warriors could edge into the 2020 playoffs and then contend for a title if Klay returned in late February/early March. Rather, it is based on analysis of their opportunity for next season and also an attempt to add a little fun to my Top Ten List!  The benefit of this season:

  • Klay and Curry are getting substantial time off after 5 seasons of heavy stress. They should be refreshed at the start of next season
  • Russell, assuming he doesn’t keep missing games with injuries, is learning the Warriors style of play
  • Because of the injuries to Klay, Curry, Looney, and to a lesser extent Green and Russell, several of the younger members of the team are getting experience at a much more rapid rate than would normally be possible and the Warriors are able to have more time to evaluate them as potential long-term assets
  • If the Warriors continue to lose at their current rate, they will be able to get a high draft choice for the first time since 2012 when they drafted Harrison Barnes with the 7th pick. Since then their highest pick has been between the 28th and 30th player chosen (30 is the lowest pick in the first round)
  • The Warriors will have more cap space available to sign a quality veteran
  • Andre Iguodala might re-sign with the team, and while this is not necessary for my prediction it would be great for him and for the team
  • The veterans should be hungry again after several years of almost being bored during the regular season

I am assuming the Warriors will be relatively healthy next season for this to occur.

10. At least one of the major Unicorns will be acquired by a larger player

In 2019, there was a change to the investing environment where most companies that did not show a hint of potential profitability had difficulty maintaining their market price. This was particularly true of highly touted Unicorns, which mostly struggled to increase their share price dramatically from the price each closed on the day of their IPO. Table 2 shows the 9 Unicorns whose IPOs we highlighted in our last post. Other than Beyond Meat, Zoom and Pinterest, they all appear some distance from turning a proforma profit. Five of the other six are below their price on the first day’s close. A 6th, Peloton, is slightly above the IPO price (and further above the first days close). Beyond Meat grew revenue 250% in its latest quarter and moved to profitability as well. Its stock jumped on the first day and is even higher today.  While Pinterest is showing an ability to be profitable it is still between the price of the IPO and its close on the first day of trading.  Zoom, which is one of our recommended buys, was profitable (on a Non-GAAP basis) and grew revenue 85% in its most recent quarter. A 10th player, WeWork, had such substantial losses that it was unable to have a successful IPO.

Table 2: Recent Unicorn IPOs Stock Price & Profitability Comparisons

Something that each of these companies have in common is that they are all growing revenue at 30% or more, are attacking large markets, and are either in the leadership position in that market or are one of two in such a position. Because of this I believe one or more of these (and comparable Unicorns) could be an interesting acquisition for a much larger company who is willing to help make them profitable. For such an acquirer their growth and leadership position could be quite attractive.

Recap of 2019 Top Ten Predictions

Bull Markets have Tended to Favor My Stock Picks

I entered 2019 with some trepidation as my favored stocks are high beta and if the bear market of the latter portion of 2018 continued, I wasn’t sure I would once again beat the market…it was a pretty close call last year. However, I felt the companies I liked would continue to grow their revenue and hoped the market would reward their performance. As it turns out, the 5 stocks I included in my top ten list each showed solid company performance and the market returned to the bull side. The average gain for the stocks was 45.7% (versus the S&P gain of 24.3%).

Before reviewing each of my top ten from last year, I would like to once again reveal long term performance of the stock pick portion of my top ten list. For my picks, I assume equal weighting for each stock in each year to come up with my performance and then compound the yearly gains (or losses) to provide my 6-year performance. For the S&P my source is Multpl.com.  I’m comparing the S&P index at January 2 of each year to determine annual performance.  My compound gain for the 6-year period is 499% which equates to an IRR of 34.8%. The S&P was up 78% during the same 6-year period, an IRR of 10.1%.

The 2019 Top Ten Predictions Recap

One of my New Year’s pledges was to be more humble, so I would like to point out that I wasn’t 10 for 10 on my picks. One of my 5 stocks slightly under-performed the market and one of my non-stock forecasts was a mixed bag. The miss on the non-stock side was the only forecast outside of tech, once again highlighting that I am much better off sticking to the sector I know best (good advice for readers as well). However, I believe I had a pretty solid year in my forecasts as my stock portfolio (5 of the picks) significantly outperformed the market, with two at approximately market performance and three having amazing performance with increases of 51% to 72%. Regarding the 5 non-stock predictions, 4 were right on target and the 5th was very mixed. As a quick reminder, my predictions were:

Stock Portfolio 2019 Picks:

  • Tesla stock will outpace the market (it closed last year at $333/share and opened this year at $310)
  • Facebook Stock will outpace the market (it closed last year at $131/share)
  • Amazon Stock will outpace the market (it opened the year at $1502/share)
  • Stitch Fix stock appreciation will outpace the market (it closed last year at $17/share)
  • DocuSign stock will outpace the market in 2019 (it is currently at $43/share and opened the year at $41)

5 Non-Stock Predictions:

  • Replacing cashiers with technology will be proven out in 2019
  • Replacing cooks, baristas, and waitstaff with robots will begin to be proven in 2019
  • Influencers will be increasingly utilized to directly drive commerce
  • The Cannabis Sector should show substantial gains in 2019
  • 2019 will be the year of the unicorn IPO

In the discussion below, I’ve listed in bold each of my ten predictions and give an evaluation of how I fared on each.

Tesla stock will outpace the market (it closed last year at $333/share and opened this year at $310)

Tesla proved to be a rocky ride through 2019 as detractors of the company created quite a bit of fear towards the middle of the year, driving the stock to a low of $177 in June. A sequence of good news followed, and the stock recovered and reached a high of $379 in front of the truck unveiling. I’m a very simplistic guy when I evaluate success as I use actual success as the measure as opposed to whether I would buy a product. Critics of the truck used Elon’s unsuccessful demonstration of the truck being “bulletproof” and the fact that it was missing mirrors and windshield wipers to criticize it. Since it is not expected to be production ready for about two years this is ridiculous! If the same critics applied a similar level of skepticism to the state of other planned competitive electric vehicles (some of which are two plus years away) one could conclude that none of them will be ready on time. I certainly think the various announced electric vehicles from others will all eventually ship, but do not expect them to match the Tesla battery and software capability given its 3 to 5-year lead. I said I’m a simple guy, so when I evaluate the truck, I look at the 250,000 pre-orders and notice it equates to over $12.5B in incremental revenue for the product! While many of these pre-orders will not convert, others likely will step in. To me that is strong indication that the truck will be an important contributor to Tesla growth once it goes into production.

Tesla stock recovered from the bad press surrounding the truck as orders for it mounted, the Chinese factory launch was on target and back order volume in the U.S. kept factories at maximum production.  Given a late year run the stock was up to $418 by year end, up 34.9% from the January opening price. But for continuing recommendations I use the prior year’s close as the benchmark (for measuring my performance) which places the gain at a lower 25.6% year over year as the January opening price was lower than the December 31 close. Either way this was a successful recommendation.

Facebook Stock will outpace the market (it closed last year at $131/share)

Facebook, like Tesla, has many critics regarding its stock. In 2018 this led to a 28% decline in the stock. The problem for the critics is that it keeps turning out very strong financial numbers and eventually the stock price has to recognize that. It appears that 2019 revenue will be up roughly 30% over 2018. After several quarters of extraordinary expenses, the company returned to “normal” earnings levels of about 35% of revenue in the September quarter. I expect Q4 to be at a similar or even stronger profit level as it is the seasonally strongest quarter of the year given the company’s ability to charge high Christmas season advertising rates. As a result, the stock has had a banner year increasing to $205/share at year-end up 57% over the prior year’s close making this pick one of my three major winners.

Amazon Stock will outpace the market (it opened the year at $1502/share)

Amazon had another very solid growth year and the stock kept pace with its growth. Revenue will be up about 20% over 2018 and gross margins remain in the 40% range. For Amazon, Q4 is a wildly seasonal quarter where revenue could jump by close to 30% sequentially. While the incremental revenue tends to have gross margins in the 25% – 30% range as it is heavily driven by ecommerce, the company could post a solid profit increase over Q3. The stock pretty much followed revenue growth, posting a 23% year over year gain closing the year at $1848 per share. I view this as another winner, but it slightly under-performed the S&P index.

Stitch Fix stock appreciation will outpace the market (it closed last year at $17/share)

Stitch Fix, unlike many of the recent IPO companies, has shown an ability to balance growth and earnings. In its fiscal year ending in July, year over year growth increased from 26% in FY 2018 to over 28% in FY 2019 (although without the extra week in Q4 of FY 2019 year over year growth would have been about the same as the prior year). For fiscal 2020, the company guidance is for 23% – 25% revenue growth after adjusting for the extra week in Q4 of FY 2019. On December 9th, Stitch Fix reported Q1 results that exceeded market expectations. The stock reacted well ending the year at $25.66 per share and the year over year gain in calendar 2019 moved to a stellar level of 51% over the 2018 closing price.

DocuSign stock will outpace the market in 2019 (it is currently at $43/share and opened the year at $41)

DocuSign continued to execute well throughout calendar 2019. On December 5th it reported 40% revenue growth in its October quarter, exceeding analyst expectations. Given this momentum, DocuSign stock was the largest gainer among our 5 picks at 72% for the year ending at just over $74 per share (since this was a new recommendation, I used the higher $43 price at the time of the post to measure performance). The company also gave evidence that it is reducing losses and not burning cash. Since ~95% of its revenue is subscription, the company is able to maintain close to 80% gross margin (on a proforma basis) and is well positioned to continue to drive growth. But, remember that growth declines for very high growth companies so I would expect somewhat slower growth than 40% in 2020.

Replacing cashiers with technology will be proven out in 2019

A year ago, I emphasized that Amazon was in the early experimental phase of its Go Stores which are essentially cashierless using technology to record purchases and to bill for them. The company now has opened or announced 21 of these stores. The pace is slower than I expected as Amazon is still optimizing the experience and lowering the cost of the technology. Now, according to Bloomberg, the company appears ready to:

  • Open larger format supermarkets using the technology
  • Increase the pace of adding smaller format locations
  • Begin licensing the technology to other retailers, replicating the strategy it deployed in rolling out Amazon Web Services to others

Replacing cooks, baristas, and waitstaff with robots will begin to be proven in 2019

The rise of the robots for replacing baristas, cooks and waitstaff did indeed accelerate in 2019. In the coffee arena, Briggo now has robots making coffee in 7 locations (soon to be in SFO and already in the Austin Airport), Café X robotic coffee makers are now in 3 locations, and there are even other robots making coffee in Russia (GBL Robotics), Australia (Aabak) and Japan (HIS Co). There is similar expansion of robotic pizza and burger cooks from players like Zume Pizza and Creator and numerous robots now serving food. This emerging trend has been proven to work. As the cost of robots decline and minimum wage rises there will be further expansion of this usage including franchise approaches that might start in 2020.

Influencers will be increasingly utilized to directly drive commerce

The use of influencers to drive commerce accelerated in 2019. Possibly the most important development in the arena was the April 2019 launch by Instagram of social commerce. Instagram now let’s influencers use the app to tag and sell products directly, that is, their posts can be “shoppable”. Part of the series of steps Instagram took was adding “checkout” which lets customers purchase products without leaving the walls of the app.

A second increase in the trend is for major influencers to own a portion of companies that depend on their influence to drive a large volume of traffic. In that way they can capture more of the value of their immense influence. Using this concept, Rihanna has become the wealthiest female musician in the world at an estimated net worth of $600 million. The vast majority of her wealth is from ownership in companies where she uses her influence to drive revenue. The two primary ones are Fenty Beauty and Fenty Maison. Fenty Beauty was launched in late 2017 and appears to be valued at over $3 billion. Rihanna owns 15% – do the math! Fenty Maison is a partnership between LVMH (the largest luxury brand owner) and Rihanna announced in May of 2019. It is targeting fashion products and marks the first time the luxury conglomerate has launched a fashion brand from scratch since 1987. Rihanna has more than 70 million followers on Instagram and this clearly establishes her as someone who can influence commerce.

The Cannabis Sector should show substantial gains in 2019

The accuracy of this forecast was a mixed bag as the key companies grew revenue at extremely high rates, but their stock valuations declined resulting in poor performance of the cannabis index (which I had said should be a barometer). A few examples of the performance of the largest public companies in the sector are shown in Table 2.

Table 2: Performance of Largest Public Cannabis Companies

*Note: Canopy last quarter was Sept 2019

In each case, the last reported quarter was calendar Q3. For Tilray, I subtracted the revenue from its acquisition of Manitoba Harvest so that the growth shown is organic growth. I consider this forecast a hit and a miss as I was correct regarding revenue (it was up an average of 282%) but the stocks did not follow suit, even modestly, as the average of the three was a decline of 54%. While my forecast was not for any individual company or stock in the sector, it was wrong regarding the stocks but right regarding company growth. The conclusion is humbling as I’m glad that I exercised constraint in not investing in a sector where I do not have solid knowledge of the way the stocks might perform.

2019 will be the year of the unicorn IPO

This proved true as many of the largest unicorns went public in 2019. Some of the most famous ones included on the list are: Beyond Meat, Chewy, Lyft, Peloton, Pinterest, Slack, The Real Real, Uber and Zoom. Of the 9 shown, four had initial valuations between $8 billion and $12 billion, two over $20 billion and Uber was the highest at an $82 billion valuation. Some unicorns found the public markets not as accepting of losses as the private market, with Lyft and Uber stock coming under considerable pressure and WeWork unable to find public buyers of its stock leading to a failed IPO and shakeup of company management. There is more to come in 2020 including another mega one: Airbnb.

2020 Predictions coming soon

Stay tuned for my top ten predictions for 2020…but please note that all 5 of the stocks recommended for 2019 will remain on the list.

Soundbyte

  • Before the basketball season began, I had a post predicting that the Warriors still had a reasonable chance to make the playoffs (if Klay returned in late February). Talk about feeling humble! I guess, counting this I had 3 misses on my predictions.

Defining Key Elements of the New Model for Retail

In our October, 2015 Soundbytes (https://soundbytes2.com/2015/10/)  I predicted that Omnichannel selling would become prevalent over the ensuing years with brick and mortar retailers being forced to offer an online solution, ecommerce companies needing to access buyers at physical locations and online brands (referred to as DTC or direct to consumer) being carried by 3rd party physical stores. Since that post, these trends have accelerated (including Amazon’s announcement last week that it is opening another “4-star store” in the bay area). Having had more time to observe this progression, I have developed several theories regarding this evolving new world that I would like to share in this post.  

Issues for Brick and Mortar Stores when they Create an Online Presence

Physical retailers are not set up to handle volumes of online sales. Their distribution centers are geared towards sending larger volumes of products to their stores rather than having the technology and know-how to deal directly with consumers (a situation which motivated Walmart to buy Jet for $3.3 billion). In general, a retailer starting to sell online will need to create one or more new distribution centers that are geared towards satisfying direct to consumer online demand.  

Another rude awakening for brick and mortar retailers when they go online is a dramatic increase in returns. On average, returns are about 9% of purchases from a retail store and 30% when purchased online. The discrepancy is even greater for clothing (especially shoes) as fit becomes a major issue. Given that consumers expect free shipping, and most want free return shipping, this becomes a cost that can eviscerate margins. The volume of returns also creates the problem of handling reverse logistics, that is tracking the return, crediting the customer, putting it back into the inventory system as available and restocking it into the appropriate bin location. Then there is the question as to whether the item can still be resold. For clothing this may require adding the cost of cleaning and pressing operations to keep the item fresh and having the systems to track movement of the inventory through this process.

Lastly, the question becomes whether a brick and mortar retailers’ online sales will (at least partly) cannibalize their in-store sales. If so, this, coupled with the growth of online buying, can make existing store footprints too large, reducing store profits.

If Brick and Mortar Retailers Struggle with an Omnichannel Approach, why do DTC Brands Want to Create an Offline Presence?

The answer is a pretty simple one: market access and customer acquisition.  Despite a steady gain of share for online sales, brick and mortar still accounts for over 70% of consumer purchases. Not too long ago, Facebook was a pretty efficient channel to acquire customers. For the past 5 years, Azure portfolio companies have experienced a steep rise in CAC (customer acquisition cost) when using Facebook as the acquisition vehicle. There are many theories as to why, but it seems obvious to me that it is simply the law of supply versus demand. Facebook usage growth has slowed but the demand for ad inventory has increased dramatically, driving up prices. For large brands that use advertising for brand building rather than customer acquisition this does not appear to be a problem, especially when comparing its value to ads on television. For brands that use it for customer acquisition, doubling CAC changes the ratio of LTV (lifetime value or lifetime profits on a customer) to CAC making this method of customer acquisition far less effective.

The combination of these factors has led larger (and smaller) online brands to open brick and mortar outlets. Players like Warby Parker, Casper, Bonobos and even Tesla have done it by creating stores that are a different experience than traditional retail. Warby Parker, Bonobos and Tesla do not stock inventory but rather use the presence to attract customers and enable them to try on/test drive their products. I have bought products, essentially online, while at Warby Parker and Tesla physical locations.

I then had to wait between 2 to 6 weeks for the product to be manufactured and delivered (see the soundbite on Tesla below). What this means in each of their cases is that they kept their business models as ones of “manufacture to demand” rather than build to inventory.  It seems clear that for all four of the companies cited above there is a belief that these physical outlets are a cost effective way of attracting customers with a CAC that is competitive to online ads. They also effectively use online follow-up once you have visited their brick and mortar outlet, thus creating a blend of the two methods. Once the customer is acquired, repeat purchases may occur directly online or in a combination of online and offline.

The Future Blend of Online/Offline

While we have seen a steady progression of companies experimenting with Omnichannel whether they started as offline or online players, we have yet to see an optimal solution. Rather, various players have demonstrated parts of that optimization. So, I’d like to outline a few thoughts regarding what steps might lead to more optimization:

  1. To the degree possible, online purchases by consumers should have an in-store pickup and review option at some savings versus shipping to the home. For clothing, there should also be an opportunity to try the online purchased items on before leaving the store. In that way consumers have the ability to buy online, coupled with the convenience of trying products on in a store. This would expose the customer to a broader set of inventory (online) than even a large footprint store might be able to carry. It would improve fit, lower cost to the brand (by lowering returns and reducing shipping cost) while allowing the brand to begin acquiring better information on fit – insuring an improvement for the next online purchase. A secondary benefit would be the increase in store traffic that was created.
  2. Many retailers will add Rental to the mix of options offered to customers to improve profits. Azure portfolio company, Le Tote, is a subscription rental company for everyday women’s clothes. As women give feedback on a large variety of aspects of fit and preferences it can improve the fit dramatically with each successive box. Retailers need to have systems that replicates this knowledge of their customers. The problem for pure brick and mortar retailers is that they have not had a relationship that enables them to get the feedback…and they don’t have software systems to build this knowledge even if they were to get it. Le Tote has also built up strong knowledge of women’s preferences as to style and has created successful house brands that leverage that knowledge based on massive feedback from subscribers. You may have seen the announcement that Le Tote has just acquired Lord & Taylor, the oldest department store in the country. It plans to use the millions of existing Lord & Taylor customers as a source of potential subscribers to its service. It also has a rental vehicle that can be used to improve monetization of items that don’t sell through at the stores.
  3. Successful online brands will be carried by offline retailers. This has already started to occur but will accelerate over time as DTC brands like Le Tote (and perhaps Stitchfix) use their tens of millions of specific customer feedback data points to produce products that meet the needs expressed in the feedback. If they have correctly mined the data, these brands should be quite successful in offline stores, whether it be their own or a third party retailers’ outlet. The benefit to the retailor in carrying online brands is two-fold: first the online brands that have effectively analyzed their data create products they know can sell in each geography; and second carrying online brands will improve the image of the retailor in the eyes of shoppers who view DTC companies as more forward thinking.
  4. Department store footprints will need to shrink or be shared with online players. The issue discussed earlier of overall ecommerce coupled with brick and mortar stores cannibalizing store demand when they start selling online can be dramatically mitigated by having smaller stores. In that way retailers can maintain their brand presence, continue to get foot traffic, and improve store efficiency.  Any larger footprint store may need to take part of its space and either sublet it (as Macys is doing in some locations) or attract online brands that are willing to pay for a presence in those stores in the form of a percentage of revenue generated or rent. The offer to DTC brands may be to have a pop-up for a set period, or to agree to a longer-term relationship. By working with DTC brands in this way retailers can improve gross margin per square foot (a critical KPI for brick and mortar players) for poorly utilized portions of their store footprints. The secondary benefit to the retailer would be that the online brands will generate additional traffic to the stores. There are already a few startups that are creating a store within a store concept that carries DTC brands. They hope to be the middleman between DTC brands and large retailers/shopping malls making it easier for the DTC brands to penetrate more locations, and easier for the retailer to deal with one new player that will install multiple DTC brands in their locations.
  5. There will be more combinations of online and offline companies merging. By doing that the expertise needed for each area of the business can be optimized. The online companies presumably have better software, logistics and more efficient methods of acquiring online customers. The brick and mortar retailers have greater knowledge of running a physical store, an existing footprint to carry the online brands, locations that allow for delivery to their stores, and a customer base to market to online (reducing the CAC and increasing LTV).
  6. For Omnichannel companies, revenue attribution is complex but becomes essential to managing where dollars are spent. Revenue attribution is the tracking, connecting, and crediting marketing efforts to their downstream revenue creation. For example, if a potential customer responds to a Facebook ad by going online to look at items, then visits a store to check them out live, but eventually buys one or more of the items in response to a google ad, the question becomes: which channel should get credit for acquiring the customer? This is important as the answer may impact company strategy and help determine where marketing dollars get spent. Several Azure portfolio companies are now using 3rd party software from companies like Hive to appropriately give attribution to each channel that helped contribute to the eventual sale. This process is important as it helps determine future spending. We expect better run Omnichannel companies to evolve their analysis of marketing to include attribution models.  

Conclusion: The future winners in retail will be those that successfully migrate to the most optimal omnichannel models

What I have described in this post is inevitable. Some large proportion of customers will always want to do some or all of their shopping at a brick & mortar store. By blending the positive attributes of physical retail with the accessibility to the larger number of options that can exist online, companies can move to more optimal models that address all potential customers. But unless this is done in an intelligent way booby traps like inefficient floor space, excessive returns, high shipping costs and more will rear their ugly heads. This post describes steps for retailers/brands to take that are a starting point for optimizing an omnichannel approach.  

Soundbytes

  • When I had just left Wall Street, I received calls from the press and a very large investor in Hewlett Packard regarding my opinion of the proposed acquisition of Compaq Computer. I said: “HP is in 6 business areas with Imaging being their best and PCs their worst. Doubling up on the worst of the 6 does not make sense to me.” When asked what they should do instead, I replied: “Double up on the best business: acquire Xerox.” My how the tide has turned as Xerox was in trouble then and could have been bought at a very low price. Now it appears Xerox may acquire HP. To be clear, Xerox is still a much smaller market cap company…but I’m enjoying seeing how this process will work out.

  • In the last Soundbytes, I mentioned that I had purchased a Tesla Model 3. What is interesting is that 6 weeks later I am being told that it may take as long as 3-4 more weeks before I receive the car.  This means delivery times have extended to at least 9 weeks. I can’t say how reliable this is but the salesperson I am dealing with told me that Tesla has prioritized production of Model S, Model X and shipments to Europe and Asia over even the more expensive versions of Model 3’s (mine cost almost $59,000 before sales tax). One can easily conclude that production must be at full capacity and that the mix this quarter will contain more higher priced cars. So, demand in the quarter appears to be in excess of 100,000 units and price per car appears strong. Assuming the combination of maximum production in the U.S. and some production out of the Chinese factory, supply might also exceed 100,000 units. If the supply is available, then Tesla should have a strong Q4. However, there is the risk that Tesla doesn’t have the parts to supply both factories or that they have somehow become less efficient. The latest thing to drive down the Tesla stock price is the missteps in showcasing the new truck. I’m not sure why a company should be castigated for an esoteric feature not working in a prototype of a product that won’t be in production until sometime in 2021. Remember, Tesla at its core is a technology company producing next gen autos. I’ve seen other technology companies like Microsoft and Oracle have glitches in demos of future products without such a reaction. As for the design of the truck, I believe Tesla is targeting a 10% to 20% share of the truck market with a differentiated product rather than attempting to attract all potential buyers. 10% of the U.S. pickup market would result in 250,000 units per year. The company has announced pre-orders for the vehicle have already reached 200,000. If these orders are real, they have a home run on their hands but since the deposit is only $100 there is no guarantee that all deposits will convert to actual purchases when the truck goes into production.  

Why Apple Acquiring Tesla Seems an Obvious Step…

…and why the obvious probably won’t happen!

A Look at Apple history

Apple’s progress from a company in trouble to becoming the first company to reach a trillion dollar market cap meant over 400X appreciation in Apple stock. The metamorphosis began when the company hired Fred Anderson as an Executive VP and CFO in 1996. Tim Cook joined the company as senior VP of worldwide operations in 1998. Fred and Tim improved the company operationally, eliminating wasteful spending that preceded their tenure. Of course, as most of you undoubtedly know, bringing back Steve Jobs by acquiring his company, NeXT Computer in early 1997 added a strategic genius and great marketer to an Apple that now had an improved business model. Virtually every successful current Apple product was conceived while Steve was there. After Fred retired in 2004, Tim Cook assumed even more of a leadership role than before and eventually became CEO shortly before Jobs’ death in 2011.  

Apple post Steve Jobs

Tim Cook is a great operator. In the years following the death of Steve Jobs he squeezed every bit of profit that is possible out of the iPad, iPod, iMacs, music content, app store sales and most of all the iPhone. Because great products have a long life cycle they can increase in sales for many years before flattening out and then declining.

Table 1: Illustrative Sales Lifecycle for Great Tech Product

Cook’s limit is that he cannot conceptualize new products in the way Steve Jobs did. After all, who, besides an Elon Musk, could? The problem for Apple is that if it is to return to double digit growth, it needs a really large, successful new product as the iPhone is flattening in sales and the Apple Watch and other new initiatives have not sufficiently moved the needle to offset it. Assuming Q4 revenue growth in FY 2019 is consistent with the first 9 months, then Apple’s compound growth over the 4 years from FY 15 to FY 19 will be 3.0% (see Table 2) including the benefit of acquisitions like Beats.

iPhone sales have flattened

The problem for Apple is that the iPhone is now in the mature part of its sales life cycle. In fact, unit sales appear to be declining (Graph 1) but Apple’s near monopoly pricing power has allowed it to defy the typical price cycle for technology products where average selling prices decline over time. The iPhone has gone from a price range of $99 to $299 in June 2009 to $999 to $1449 for the iPhoneX, while the older iPhone 7 is still available with minimal storage for $449. That’s a 4.5X price increase at the bottom and nearly 5X at the high end! This defies gravity for technology products.

Graph 1: iPhone Unit Sales (2007-2018)

In the many years I followed the PC market, it kept growing until reaching the following set of conditions (which the iPhone now also faces):

  1. Improvements in features were no longer enough to drive rapid replacement cycles
  2. Pricing was under pressure as component costs declined and it became more difficult to convince buyers to add capacity or capability sufficient to hold prices where they were
  3. The number of first time users available to buy product was no longer increasing each year
  4. Competition from lower priced suppliers created pricing pressure

Prior to that time PC pricing could be maintained by convincing buyers that they needed one or more of:

  1. The next generation of processor
  2. A larger or thinner screen
  3. Next generation storage technology

What is interesting when we contrast this with iPhones is that PC manufacturers struggled to maintain average selling prices (ASPs) until they finally began declining in the early 2000s. Similarly, products like DVD players, VCRs, LCD TVs and almost every other technology driven product had to drop dramatically in price to attract a mass market. In contrast to that, Apple has been able to increase average prices at  the same time that the iPhone became a mass market product. This helped Apple postpone the inevitable revenue flattening and subsequent decline due to lengthening replacement cycles and fewer first time buyers. In the past few years, other then the bump in FY 2018 from the launch of the high priced Model X early that fiscal year, iPhone revenue has essentially been flat to down. Since it is well over 50% of Apple revenue, this puts great pressure on overall revenue growth.

To get back to double digit growth Apple needs to enter a really large market

To be clear, Apple is likely to continue to be a successful, highly profitable company for many years even if it does not make any dramatic acquisitions. While its growth may be slow, its after tax profits has been above 20% for each of the past 5 years. Strong cash flow has enabled the company to buy back stock and to support increasing dividends every year since August 2014.

Despite this, I think Apple would be well served by using a portion of their cash to make an acquisition that enables them to enter a very large market with a product that already has a great brand, traction, and superior technology. This could protect them if the iPhone enters the downside of its revenue generating cycle (and it is starting to feel that will happen sometime in the next few years). Further, Apple would benefit if the company they acquired had a visionary leader who could be the new “Steve Jobs” for Apple.

There is no better opportunity than autos

If Apple laid out criteria for what sector to target, they might want to:

  1. Find a sector that is at least hundreds of billions of dollars in size
  2. Find a sector in the midst of major transition
  3. Find a sector where market share is widely spread
  4. Find a sector ripe for disruption where the vast majority of participants are “old school”

The Automobile industry matches every criterion:

Matching 1.  It is well over $3 trillion in size

Matching 2. Cars are transitioning to electric from gas and are becoming the next technology platform

Matching 3. Eight players have between 5% and 11% market share and 7 more between 2% and 5%

Matching 4. The top ten manufacturers all started well over 50 years ago

And no better fit for Apple than Tesla

Tesla reminds me of Apple in the late 1990s. Its advocates are passionate about the company and its products. It can charge a premium versus others because it has the best battery technology coupled with the smartest software technology. The company also designs its cars from the ground up, rather than retrofitting older models, focusing on what the modern buyer would most want. Like Jobs was at Apple, Musk cares about every detail of the product and insists on ease of use wherever possible. The business model includes owning distribution outlets much like Apple Stores have done for Apple. By owning the outlets, Tesla can control its brand image much better than any other auto manufacturer. While there has been much chatter about Google and Uber in terms of self-driving cars, Tesla is the furthest along at putting product into the market to test this technology.

Tesla may have many advantages over others, but it takes time to build up market share and the company is still around 0.5% of the market (in units). It takes several years to bring a new model to market and Tesla has yet to enter several categories. It also takes time and considerable capital to build out efficient manufacturing capability and Tesla has struggled to keep up with demand. But, the two directions that the market is moving towards are all electric cars and smart, autonomous vehicles. Tesla appears to have a multi-year lead in both. What this means is that with enough capital and strong operational direction Tesla seems poised to gain significant market share.

Apple could accelerate Tesla’s growth

If Apple acquired Tesla it could:

  1. Supply capital to accelerate launch of new models
  2. Supply capital for more factories
  3. Increase distribution by offering Tesla products in Apple Stores (this would be done virtually using large computer screens). An extra benefit from this would be adding buzz to Apple stores
  4. Supply operational knowhow that would increase Tesla efficiency
  5. Add to the luster of the Tesla brand by it being part of Apple
  6. Integrate improved entertainment product (and add subscriptions) into Tesla cars

These steps would likely drive continued high growth for Tesla. If, with this type of support, it could get to 5% share in 3-5 years that would put it around $200 billion in revenue which would be higher than the iPhone is currently. Additionally, Elon Musk is possibly the greatest innovator since Steve Jobs. As a result, Tesla would bring to Apple the best battery technology, the strongest power storage technology, and the leading solar energy company. More importantly, Apple would also gain a great innovator.

The Cost of such an acquisition is well within Apple’s means

At the end of fiscal Q3, Apple had about $95 billion in cash and equivalents plus another $116 billion in marketable securities. It also has averaged over $50 billion in after tax profits annually for the past 5 fiscal years (including the current one). Tesla market cap is about $40 billion. I’m guessing Apple could potentially acquire it for less than $60 billion (which would be a large premium over where it is trading). This would be easy for Apple to afford and would create zero dilution for Apple stockholders.

If the Fit is so strong and the means are there, why won’t it happen?

I can sum up the answer in one word – ego.  I’m not sure Tim Cook is willing to admit that Elon would be a far better strategist for Apple than him. I’m not sure he would be willing to give Elon the role of guiding Apple on the product side. I’m not sure Elon Musk is willing to admit he is not the operator that Tim Cook is (remember Steve Jobs had to find out he needed the right operating/financial partners by getting fired by Apple and essentially failing at NeXT). I’m not sure Elon is willing to give up being the CEO and controlling decision-maker for his companies.

So, this probably will never happen but if it did, I believe it would be the greatest business powerhouse in history!

Soundbytes

  1. USA Today just published a story that agreed with our last Soundbytes analysis of why Klay Thompson is underrated.
  2. I expect Zoom Video to beat revenue estimates of $129 million to $130 million for the July Quarter by about $5 million or more

R&D: Amazon’s Dirty Little Secret Weapon


Why doesn’t Amazon produce more earnings given its dominance?

Amazon just reported earnings and, as was the case in 2017 and 2016, emphasized that 2019 will be an investment year, so the strong operating margin expansion of 2018 would be capped in 2019. This, of course, is great fodder for bears on the stock as Amazon gave sceptics renewed opportunity to point out that it is a company that has a flawed business model and would find it difficult to ever earn a reasonable return on revenue.

In contrast, I believe that Amazon continues to transform itself into a potential strong profit performer. For example, taking the longer perspective, Amazon’s gross margins are now over 40% up from 27.2% five years ago (2013). So why doesn’t Amazon deliver higher operating margin than the slightly over 6% it reported in 2018? Amazon’s dirty little secret is that it continues to invest heavily in creating future dominance through R&D. Had it spent a similar amount in R&D to its long time competitor, Walmart, EBITDA would have nearly tripled… to over 17% of revenue! I must confess that in the past I haven’t paid enough attention to how much Amazon spends on R&D. As a result, I was surprised that Apple and Microsoft trailed it in voice recognition technology and that Amazon could lead IBM and Microsoft in cloud technology. The reason this occurred is not a surprising one: Amazon outspends Apple, Microsoft and IBM in R&D.

In fact, Amazon now outspends every company in the world (see Table 1) and have been dedicating a larger portion of available dollars to R&D (as measured by the % of gross margin dollars spent on R&D) than any other large technology company, except Qualcomm, for more than 10 years. Even though Amazon had less than 50% of Apple’s revenue and less than 1/3 of its gross margin dollars 5 years ago (2013) Amazon spent nearly 50% more than Apple on R&D that year… by 2018 the gap had increased to close to 100% more.

Table 1: Top 10 (and a few more) U.S. R&D Spenders in 2018 ($Bn)

Sources: market watch, analyst reports, annual filings

Note 1: Ford and GM may be in the top 10 but so far have not reported R&D in 2018. If they report it at year end the table could change. Walmart does not report R&D and their spend is generally unavailable, but I found a reference that said they expected to spend $1.1M in 2017.

Note 2: A 2018 global list would include auto makers VW and Toyota (with R&D of $15.8B and about 10.0B), drug company Roche (&10.8B) and tech company Samsung at $15.3B in place of the lowest 4 in Table 1.

The Innovators Financial Dilemma: Increasing Future Prospects can lower Current Earnings

When I was on Wall Street covering Microsoft (and others) Bill Gates would often point out that the company was going to make large investments the following year so they could stay ahead of competition. He said he was less concerned with what that meant for earnings. That investment helped drive Microsoft to dominance by the late 1990s. Companies are often confronted with the dilemma of whether to increase spending to drive future growth or to maximize current earnings. I believe that investment in R&D, when effective, is correlated to future success.

It is interesting to see how leaders in R&D spending have transitioned over the past 10 years. In 2008 the global leaders in R&D spending included 5 pharma companies, 3 auto makers and only 2 tech companies (Nokia and Microsoft which subsequently merged). In 2018, 6 of the top 7 spenders (Samsung plus the 5 shown in Table 1) were technology companies.

Table 2 – 2008 global R&D leaders ($Bn)

Note: *Facebook data from 2009, first available financials from S-1 filing

It’s hard to change without tanking one’s stock

When a company has a business model that allocates 1% of gross margin dollars to R&D, it is not easy to turn on the dime. If Walmart had decided to invest half as much as Amazon in R&D in 2018, its earnings would have decreased by 80% – 90% and its stock would have depreciated substantially. So, instead it began a buying binge several years ago to try to close the technology gap through acquisitions (which has a much smaller impact on operating margins). It remains to be seen if this strategy will succeed going forward but in the past 5 years Walmart revenue (including acquisitions) increased only 5% while Amazon’s was up 130% in the same period (also including acquisitions).

Whatever Happened to IBM?

When I was growing up, I thought of IBM as the king of tech. In the early 1990s it still seemed to rule the roost. The biggest fear for Microsoft was that IBM could overwhelm it, yet now it appears to be an also ran in technology. From 2014 to 2018, a heyday era for tech companies, its revenue shrank from $93 billion in 2014 to $80 billion in 2018. I can’t tell how much of the problem stems from under investing in R&D versus poor execution, but for the past 5 years it has spent an average of about 13% of GM on R&D, while the 6 tech companies in Table 1 have averaged about 24% of GM dollars with Apple the only one under 20%.


Soundbytes

Soundbyte I: Tesla

  • I recently had a long dialogue with a very smart fund manager and was struck by what I believe to be misinformation he had read regarding Tesla. There were 3 major points that he had heard:
    • The quality of Tesla cars was shoddy
    • Tesla could not maintain reasonable margins as it began producing lower priced Model 3s
    • The upcoming influx of electric cars from companies like Porsche, Jaguar and Audi would take substantial market share away from Tesla

I decided to do a bit of research to determine how valid each of these issues might be.

  • Tesla Quality: I found it hard to believe that the majority of Tesla owners thought the car was of poor quality since every one of the 15 or so people I knew who had bought one had already bought another or were planning to for their next car. So, I found a report on customer satisfaction from Consumer Reports, and I was not surprised to find that Tesla was the number 1 ranked car by customer satisfaction.
  • Tesla margins: this is much harder to predict. Since Tesla is relatively young as a manufacturer it has had numerous issues with production. Yet it is probably ahead of many others when it comes to automating its facilities. This tends to cause gross margins to be lower while volume ramps and higher subsequently. The combination of that, plus moving up the learning curve, should mean that Tesla lowers the cost of producing its products. However, Tesla charges more for cars with higher capacity for distance, but as I understand it uses software to limit battery capacity for lower priced cars. This would mean that a portion of the difference between a lower priced Model 3 and a higher priced one (the battery capacity) would be minimal change in cost, putting pressure on margins. The question becomes whether Tesla’s improving cost efficiencies offset the average price decline of a Model 3 as Tesla begins fulfilling demand for lower priced versions.
  • March 1 Update: After this post was complete (Thursday February 28) the company announced it was closing many showrooms to reduce costs. Then late today (Friday) announced that the $35,000 version of the model 3 is now available. So, we shall soon see the impact. I believe that if Tesla has increased capacity there will be very strong sales. It also likely will experience lower gross margin percentages as it climbs the learning curve and ramps production.
  • Will the influx of electric cars from others impact Tesla market share?


  1. Porsche is an electric sports car starting at $90K – at that price point it is competitive with model S not model 3. In competing with the S it comes down to whether one prefers a sports car to a sedan. I have owned a Porsche in the past and would only consider it if I wanted a sports car with limited seating capacity (but very cool). I loved my Porsche but decided to switch to sedans going forward. Since then I’ve owned only sedans for the past 10+ years. It also appears that early production is almost a year away, so it is unlikely to be competitive for 2019.
  2. Audi is at price points that do compete with the Model 3 and expects to start delivering cars in March. However, I think that is mainly in Europe where Tesla is an emerging brand so it might not impact them at all. When I look at the Audi models I don’t think they will appeal to Tesla buyers as they are very old-line designs (I would call them ugly). The range of the cars on a charge is not yet official but seems likely to be much lower than Tesla which has a big lead in battery technology.
  3. The Jaguar competes with the Tesla Model X but while cheaper, appears a weak competitor.


I don’t want to dismiss the fact that traditional players will be introducing a large number of electronic vehicles. The question really is whether the market size for electric cars is a fixed portion of all cars or whether it will become a much larger part of the entire market over time. I would compare this to fears that analysts had when Lotus and Wordperfect created Windows versions. They felt that Microsoft would lose share of windows spreadsheets and word processors. I agreed but pointed out that Windows was 10% of the entire market for spreadsheets, so having a 90% share gave Microsoft 9% of the overall spreadsheet market. I also predicted Microsoft would have over a 45% share when Windows was 100% of the market. So, while this would decrease Microsoft’s share of Windows spreadsheets, it would grow its total share of the market by 5X Of course we all were proven wrong as Microsoft eventually reached over 90% of the entire market.

For Tesla, the question becomes whether these rivals are helping accelerate the share electric cars will have of the overall market, rather than eroding Tesla volumes. I’m thinking that it’s the former, and that Tesla will have a great volume year in 2019 and that its biggest competitive issue will be whether the Model 3 is so strong that it will get people to buy it over the Model S. Of course, I could be wrong, but believe the odds favor Tesla in 2019, especially the first half of the year where the competitors are not that strong.

Soundbyte II: The NYC / Amazon Deal Collapses

I never cease to be amazed at how little regard some Politicians have for facts. I should likely not have been surprised by the furor created over Amazon locating a major facility in New York City. I thought the $44 billion or more in benefits to the City and State and massive job creation were such a win that no one would contest it. Instead, the dialog centered around the $ 3 billion in tax benefits to Amazon. All but 1/6 of the benefits (which was cash from the state) were based on existing laws and amounted to a reduction of future taxes rather than upfront cash. What a loss for the City.

2019 Top Ten Predictions

Opportunity Knocks!

The 2018 December selloff provides buying opportunity

One person’s loss is another’s gain. The market contraction in the last quarter of the year means that most stocks are at much lower prices than they were in Q3 of 2018. The 5 stocks that I’m recommending (and already own) were down considerably from their Q3 2018 highs. While this may be wishful thinking, returning to those highs by the end of 2019 would provide an average gain of 78%. Each of the 5 had revenue growth of 25% or more last year (and 3 were over 35%) and each is poised for another strong year in 2019.

For the 4 continued recommendations (all of which I mentioned I would recommend again in my last post), I’ll compare closing price on December 31, 2019 to the close on December 31, 2018 for calculating performance. For the new add to my list, I’ll use the stock price as I write this post. I won’t attempt to predict the overall market again (I’m just not that good at it) but feel that the 14% drop in Q4 means there is a better chance that it won’t take a nosedive. However, since stock picks are always relative to the market, success is based on whether my picks, on average, outperform the market.

I’ll start the post with stock picks and then follow with the remaining 5 predictions.

 2019 Stocks  

Tesla stock will outpace the market (it closed last year at $333/share and is essentially the same as I write this)

In Q3, 2018 the Tesla model 3 was the bestselling car in the U.S. in terms of revenue and 5th highest by volume. This drove a 129% revenue increase versus a year earlier and $1.75 in earnings per share versus a loss of $4.22 in the prior quarter. I expect Q4 revenue to increase sequentially and growth year/year to exceed 100%. In Q3, Tesla reported that nearly half of vehicles traded in for the Model 3 were originally priced below $35,000. As Tesla begins offering sub-$40,000 versions of it, demand should include many buyers from this high-volume price range. Since the backlog for the Model 3 is about 300,000 units I expect 2019 sales to remain supply constrained if Tesla can offer lower price points (it already has announced a $2,000 price reduction). The important caveat to demand is that tax credits will be cut in H1 2019, from $7500 to $3750 and then cut again to $1875 in the second half of the year. Part of Tesla’s rationale for a $2000 price drop is to substantially offset the initial reduction of these tax credits.

Tesla began taking orders for its Q1 launch in Europe where demand over time could replicate that in the U.S. The average price of a Model 3 will initially be about $10,000 higher than in the U.S. Tesla is also building a major manufacturing facility in China (where Model 3 prices are currently over $20,000 higher than the U.S.). This Giga-Factory is expected to begin production in the latter half of 2019. While moving production to China for vehicles sold there should eliminate trade war issues, Tesla still expects to begin delivering Model 3s to Chinese customers in March.

The combination of a large backlog, reducing prices within the U.S. and launches in Europe and China should generate strong growth in 2019. Some investors fear price reductions might lead to lower gross margins. When I followed PC stocks on Wall Street, this was a constant question. My answer is the same as what proved true there: strong opportunity for continuous cost reduction should enable gross margins to remain in the 20-25% range in any location that is at volume production. So, perhaps the Chinese Giga-Factory and a future European factory will start at lower margins while volume ramps but expect margins in the U.S. (the bulk of revenue in 2019) to remain in the targeted range. Higher prices in Europe and China due to massive initial demand allows premium pricing which may keep margins close to 20%+ in each.

Facebook stock will outpace the market (it closed last year at $131/share).

Facebook underperformed in 2018, closing the year down 28% despite revenue growth that should be 35% to 40% and EPS tracking to about 36% growth (despite a massive increase in SG&A to spur future results).  The stock reacted to the plethora of criticism regarding privacy of user information coupled with the continuing charges of Russian use of Facebook to impact the election. Before the wave of negative publicity, Facebook reached a high of $218/share in July. Facebook is likely to continue to increase its spending to address privacy issues and to burnish its image. However, scaling revenue could mean it keeps operating margins at a comparable level to 2018 rather than increasing them. Rumors of Facebook’s demise seem highly exaggerated!  According to a December 2018 JP Morgan survey of U.S. Internet users, the three most used social media products were Facebook (88% of participants), Facebook Messenger (61%) and Instagram (47%). Also, 82% of those surveyed picked a Facebook-owned platform as being the most important to them. Finally, the average Facebook user reported checking Facebook roughly 5 times per day with 56% of users spending 15 minutes to an hour or more on the platform on an average day. While Facebook has experienced a minor decrease in overall usage, Instagram usage has increased dramatically. Facebook, Instagram, and WhatsApp together give the company a growing and dominant position.

At the beginning of 2018 Facebook stock was trading at 34 times trailing EPS. By the end of the year the multiple of trailing EPS was below 18. If I assume EPS can grow 20%+ in 2019 (which is below my expectation but higher than the consensus forecast) than a multiple of 20 would put the stock at about $180/share by December 31. If it grew EPS, more in line with revenue and/or returned to a multiple closer to 34 it could reach well over 200.

Two key factors:

  1. A 20% increase in revenue (I expect the increase to be about 30%) adds over $11 billion in revenue. A comparable 20% increase in SG&A would provide over $4 billion in additional money to spend, affording the company ample dollars to devote to incremental marketing without impacting operating margins.
  2. Given the “low” stock price, Facebook increased its buyback program by $9 billion to $15 billion. Since it generates $6B – $7B in cash per quarter from operations (before capex) and has roughly $40 billion in cash and equivalents it could easily increase this further if the stock remains weak. The $15 billion could reduce the share count by as much as 3% in turn increasing EPS by a similar amount.

Amazon stock will outpace the market (it closed last year at $1502/share).

While its stock dropped from its September high of $2050, Amazon remained one of the best market performers in 2018 closing the year at $1502/share. At its 2018 high of $2050, It may have gotten ahead of itself, but at year end it was up less than 2018 revenue growth. Leveraging increased scale meant net income grew faster than revenue and is likely to triple from 2017. Growth will be lower in Q4 then Q3 as Q4 2017 was the first quarter that included all revenue from Whole Foods. Still, I would not be surprised if Amazon beat expectations in Q4 since this is already factored into analyst forecasts. Amazon trades on revenue coupled with the prospect of increasingly mining the revenue into higher profits. But the company will always prioritize making long term investments over maximizing near term earnings. Growth in the core ecommerce business is likely to gradually slow, but Amazon has created numerous revenue streams like its cloud and echo/Alexa businesses that I expect to result in maintaining revenue growth in the 20% plus range in 2019. The prospect of competing with an efficient new brick and mortar offering (see prediction 6 in this post) could drive new excitement around the stock.

Profitability in 2019 could be reduced by: announced salary increases to low end workers; increasing the number of physical store locations; and greater marketing incentives for customers. Offsets to this include higher growth in stronger margin businesses like AWS and subscription services. The stock may gyrate a bit, but I expect it to continue to outperform.

Stitch Fix stock will outpace the market (it closed last year at $17/share).

In my 2018 forecast I called this my riskiest pick and it was the most volatile which is saying a lot given the turbulence experience by Facebook, Tesla, and Amazon. I was feeling pretty smug when the stock reached a high of $52/share in September! I’m not sure how much of the subsequent drop was due to VCs and other early investors reducing their positions but this can have an impact on newly minted public companies. Whatever the case, the stock dropped from September’s high to a low point of $17.09 by year’s end. The drop was despite the company doing a good job balancing growth and profitability with October quarter revenue up 24% and earnings at $10.7 million up from $1.3 million in the prior year. Both beat analyst expectations. The stock was impacted because the number of users grew 22% (1-2% less than expected) despite revenue exceeding expectations at 24% growth. I’m not sure why this was an issue.

Stitch Fix continues to add higher-end brands and to increase its reach into men, plus sizes and kids. Its algorithms to personalize each box of clothes it ships keeps improving. Therefore, the company can spend less on acquiring new customers as it has increased its ability to get existing customers to spend more and come back more often. I believe the company can grow by roughly 20% or more in 2019. If it does and achieves anything close to the revenue multiple that it started with in 2018 (before the multiple doubled in mid-year), there would be a sizeable stock gain this year. But it is a thinly traded stock and likely to be quite volatile.

Docusign Stock will outpace the market in 2019 (it is currently at $43/share).

Docusign is a new recommendation. Like Stitch Fix, it is a recent IPO and could be volatile. Docusign is the runaway leader in e-signatures, facilitating multiple parties signing documents in a secure, reliable way on board resolutions, mortgages, investment documents, etc. Strong positives include:

  • A high value for a reasonable price – I am increasingly annoyed when I need to deal with manual signatures for documents.
  • As of October 31, 2018, Docusign had over 450,000 customers up from 350,000 customers one year earlier. Of which 50,000 are Enterprise/Commercial accounts;
  • There are hundreds of millions of users whose e-signatures are stored by the company making the network effect quite large;
  • Roughly 95% of revenue is from its SaaS product which has 80% gross margin with the rest from services where margins have improved and are now positive;
  • As a SaaS company with a stable revenue base growth is more predictable. The company exceeded revenue guidance each quarter with the October 31, 2018 quarter revenue up 37%;
  • Most customers pay annually in advance. This means cash flow from operations is positive despite the company recording an operating loss;
  • Customers expand their use resulting in retained customers growing revenue faster than decreases from churned customers making net revenue retention over 100%;
  • International expansion remains a large opportunity as international is only 18% of revenue.

Picks 6 – 10: Major Trends that will surface in 2019

I developed my primary method of stock picking at my first Wall Street firm, Stanford Bernstein. The head of research there, Chuck Cahn, emphasized that you could get small wins by correctly determining that a stock would trade up on certain news like a new product, a big customer win, and beating consensus forecasts. But larger and more predictable wins of 5X or more were possible if one identified a long-term winner riding a major trend and stuck with it for multiple years. All 5 of my stock picks fall into the latter category. I’ve been recommending Facebook, Tesla, and Amazon for 4 years or more. All 3 are now over 5X from when I first targeted them as I bought Tesla at $46 and Facebook at $24 in 2013 (before this blog) and they have been in my top 10 since. Amazon was first included in 2015 when it was at $288/share. Stitch Fix and DocuSign are riskier but if successful have substantial upside since both are early in their run of leveraging their key trends.

The next 4 picks are in early stages of trends that could lead to current and next generation companies experiencing benefits for many years. The first two go hand in hand as each describes transformation of physical retail/restaurants, namely, replacing staff with technology in a way that improves the customer experience. This is possible because we are getting closer to the tipping point where the front-end investment in technology can have a solid ROI from subsequent cost savings.

Replacing Cashiers with technology will be proven out in 2019

In October 2015 I predicted that Amazon (and others like Warby Parker) would move into physical retail between then and 2020. This has occurred with Amazon first opening bookstores and then buying Whole Foods, and Warby Parker expanding its number of physical locations to about 100 by the end of 2018. My reasoning then was simple: over 92% of purchases in the U.S. were made offline. Since Amazon had substantial share of e-commerce it would begin to have its growth limited if it didn’t create an off-line presence.

Now, for Amazon to maintain a 20% or greater revenue growth rate it’s even more important for it to increase its attack on offline commerce (now about 90% of U.S. retail) I’m not saying it won’t continue to try to increase its 50% share of online but at its current size offline offers a greater opportunity for growth.

A key to Amazon’s success has been its ability to attack new markets in ways that give it a competitive advantage. Examples of this are numerous but three of the most striking are Amazon Cloud Services (where it is the industry leader), the Kindle (allowing it to own 70% share of eBook sales) and Prime (converting millions of customers to a subscription which in turn incentivized buying more from Amazon due to free shipping).

Now the company is testing an effort to transform brick and mortar retail by replacing staff with technology and in doing so improving the buying experience. The format is called Go stores and there are currently 5 test locations. Downloading the Amazon Go App enables the user to use it to open the automated doors. The store is stocked (I think by actual people) with many of the same categories of products as a 7-Eleven, in a more modern way. Food items include La Boulangerie pastries, sushi, salads, an assortment of sandwiches and even meal kits. Like a 7-Eleven, it also has convenience items like cold medicine, aspirins, etc. The store uses cameras and sensors to track your movements, items you remove from the shelves and even whether you put an item back. When you leave, the app provides you with a digital receipt. Not only does the removal of cashiers save Amazon money but the system improves customer service by eliminating any need to wait in line. I expect Amazon to open thousands of these stores over the next 3-5 years as it perfects the concept. In the future I believe it will have locations that offer different types of inventory. While Amazon may be an early experimenter here, there is opportunity for others to offer similar locations relying on third party technology.

Replacing Cooks, Baristas and Waitstaff with robots will begin to be proven in 2019

The second step in reducing physical location staff will accelerate in 2019. There are already:

  1. Robotic coffee bars:  CafeX opened in San Francisco last year, and in them one orders drip coffee, cappuccino, latte, or hot chocolate using an app on your phone or an iPad available at a kiosk. The coffee is made and served by a robot “barista” with the charge automatically put on your credit card. Ordering, billing, and preparation are automatic, but there is still one staff member in the shop to make sure things go smoothly.
  2. The first robotic burger restaurant: Creator opened in San Francisco last June. It was in beta mode through September before opening to the general public. While a “robot” makes the burgers, Creator is not as automated as CafeX as humans prepare the sauces and prep the items that go into the machine. Creator also hasn’t automated ordering/payment. Startup Momentum Machines expects to open a robotic burger restaurant and has gotten substantial backing from well-known VCs.
  3. Robots replacing waitstaff: For example, at Robo Sushi in Toronto, a “Butlertron” escorts you to your table, you order via an iPad and a second robot delivers your meal. Unlike the robots in the coffee bar and burger restaurant these are made into cute characters rather than a machine. Several Japanese companies are investing in robotic machines that make several of the items offered at a sushi restaurant.
  4. Robotic Pizza restaurants: The furthest along in automation is the Pizza industry. Zume Pizza, a startup that uses robots to make pizzas, has recently received a $375 million investment from Softbank. Zume currently uses a mix of humans and robots to create and deliver their pizzas and is operational in the Bay Area. Pizza Hut and Dominos are working on drones and/or self-driving vehicles to deliver pizzas. And Little Caesars was just issued a patent for a robotic arm and other automated mechanisms used to create a pizza.

At CES, a robot that makes breads was announced. What all these have in common is replacing low end high turnover employees with technology for repetitive tasks. The cost of labor continues to rise while the cost of technology shrinks a la Moore’s Law. It is just a matter of time before these early experiments turn into a flood of change. I expect many of these experiments will turn into “proof points” in 2019. Successful experiments will generate substantial adoption in subsequent years. Opportunities exist to invest in both suppliers and users of many robotic technologies.

“Influencers” will be increasingly utilized to directly drive Commerce

Companies have long employed Influencers as spokespersons for products and in some cases even as brands (a la Michael Jordon and Stephan Curry basketball shoes or George Forman Grills). They appear on TV ads for products and sometimes used their social reach to tout them. Blogger, a prior Azure investment, understood how to use popular bloggers in advertising campaigns. But Blogger ads, like most TV ads did not directly offer the products to potential customers. Now we are on the verge of two major changes: tech players creating structured ways to enable fans of major influencers (with millions of followers) to use one-click to directly buy products; and technology companies that can economically harness the cumulative power of hundreds of micro-influencers (tens of thousands of fans) to replicate the reach of a major influencer. I expect to see strong growth in this method of Social Commerce this year.

The Cannabis Sector should show substantial gains in 2019

In my last post I said about the Cannabis Sector: “The industry remains at a very early stage, but numerous companies are now public, and the recent market correction has the shares of most of these at more reasonable levels. While I urge great care in stock selection, it appears that the industry has emerged as one to consider investing in.” Earlier in this post, I mentioned that riding a multi-year wave with a winning company in that segment is a way to have strong returns. I’m not knowledgeable enough regarding public Cannabis companies, so I haven’t included any among my stock recommendations. However, I expect industry wide revenue to grow exponentially. The 12 largest public Cannabis companies by descending market cap are: Canopy Growth Corp (the largest at over $11B), Tilray, Aurora Cannabis, GW Pharmaceuticals, Curealeaf Holdings, Aphria, Green Thumb Industries, Cronos Group, Medmen Enterprises, Acreage Holdings, Charlotte’s Web Holdings and Trulieve Cannabis.

I believe one or more of these will deliver major returns over the next 5 years. Last year I felt we would see good fundamentals from the industry but that stocks were inflated. Given that the North American Cannabis Index opened this year at 208 well down from its 2018 high of 386 investing now seems timely. I’ll use this index as the measure of performance of this pick.

2019 will be the Year of the Unicorn IPO

Many Unicorns went public in 2018, but this year is poised to be considerably larger and could drive the largest IPO market fund raising in at least 5 years.  Disbelievers will say: “the market is way down so companies should wait longer.” The reality is the Nasdaq is off from its all-time high in August by about 15% but is higher than its highest level at any time before 2018. Investment funds are looking for new high growth companies to invest in. It appears very likely that as many as 5 mega-players will go public this year if the market doesn’t trade off from here. Each of them is a huge brand that should have very strong individual support. Institutional investors may not be as optimistic if they are priced too high due to the prices private investors have previously paid. They are: Uber, Lyft, Airbnb, Pinterest, and Slack. Each is one of the dominant participants in a major wave, foreshadowing substantial future revenue growth. Because information has been relatively private, I have less knowledge of their business models so can’t comment on whether I would be a buyer. Assuming several of these have successful IPOs many of the other 300 or so Unicorns may rush to follow.

It will be an interesting year!