A Counter Theory to Potential Recession (during week 26 of Shelter in Place)

Consumers have more money available to spend – not less

Much of the public dialogue concerning the economic effect of Covid19 has centered around the large number of people who have lost income, with the conclusion that the US will potentially experience a continued recession going forward. What seems to be lost in the discussion is that the 90% of the labor force that is employed is saving money at an unprecedented rate. This has occurred partly through fear of future loss of income but mostly by a reduction in spending caused by the virus. For myself and my family, our spending has been involuntarily reduced in the following areas:

  1. Personal care: haircuts, beauty parlor, nail treatments, massages, etc.
  2. Cleaning services: we are wearing very casual clothes that get washed instead of going to the cleaner (who has mostly been unavailable anyway).
  3. Vacations: our last vacation was in December. We haven’t been on a plane since the pandemic started and cancelled two vacation trips.
  4. Purchasing clothes: I have bought some items online for future use (because they were at major discounts) but being at home means I don’t really need any new clothes.
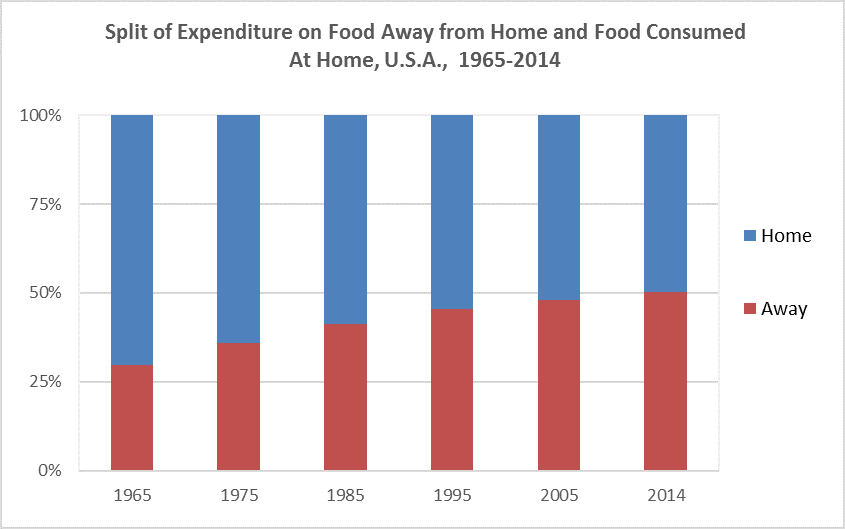
  5. Restaurants: before the pandemic I was eating breakfast and lunch out every weekday at or near my office and my wife and I ate out lunch and dinner on weekends. Additionally, I normally have additional business dinners several times a month. Instead, we are ordering food in on weekends from local restaurants we wish to support, but the cost is much lower than when we ate at the restaurant. Many of the people we know haven’t even ordered in from a restaurant.
  6. Transportation: these expenses have been virtually eliminated as I am not commuting to my office, take no Ubers and rarely drive anywhere other than to pick up local takeout food.
  7. Entertainment: such expenses have been close to eliminated other than occasionally purchasing a movie for home consumption.
  8. Medical/Dental/Optical Services: In my case medical and dental expenses have remained the same but many others have seen them reduced as access to doctors and dentists has been curtailed.

The only expenses that have increased are paying for delivery of food instead of picking it up ourselves at a supermarket and our new Zoom subscription…but at $12/month that hardly counts. I believe my family is representative of the 90% of people who still have their jobs at no reduction of pay.  In fact, according to Statista, the savings rate in March through June increased to an average of 22% versus 7.9% in 2019. Using this data, I estimate that by the end of August this amounted to approximately $1.2 trillion in above normal savings as compared to last year’s “normal” savings rate. Since stay at home is unlikely to end in many places by the end of August, this number is likely to grow.

Post Pandemic: will some areas of savings persist?

Survey data of companies indicates that there is likely to be an increase in the number of people who work from home once the pandemic ends A recent survey by Global Workplace Analytics estimates that the U.S. will see between 25-30% of the workforce working from home multiple days a week by the end of 2021, up from less than 5% who were working from home at least half-time or more before the pandemic. Since working from home will continue to offer some savings in spending this could add to the “pot” of available dollars to be redeployed. There also may be some people who remain reluctant to fly or go on a cruise. We don’t expect these incremental cost savings to be removed from commerce but rather to be redeployed.

What I believe will occur post-pandemic

While some people will take advantage of their lower cost during the pandemic to pad their savings, it seems likely to me that a substantial portion of the “above normal” accumulated savings will be spent. I believe that such spending will be divided between satisfying pent up demand for items like clothing and vacations and new demand for luxury items. The pent-up demand will start with numerous parties as people are able to once again have human contact, but it also is likely to consist of increased purchases of clothes, more visits to restaurants and rescheduling of missed vacations.

I think that some portion of these savings will also be used on furniture (and perhaps even full remodels), art, and increased purchases of luxury items. After all, people can easily feel they deserve a reward for all these months of suffering. It is apparent that many people are already adding to their online budgets for furniture, décor and art as Wayfair has seen a large spike in revenue. While Wayfair results may be due to increased marketing spend, Azure portfolio company Chairish, has also had a very large spike in revenue without such an increase in marketing.

Has the pandemic caused temporary changes in buying habits or merely accelerated trends that were already in place?

The pandemic caused a number of radical changes in behavior, including:

  1. Most people working from home and rarely, if ever, going to their office.
  2. The vast majority of people ordering almost everything online instead of visiting a store.
  3. Shifting to video calls with coworkers, friends and relatives as opposed to regular phone calls or face to face interactions.
  4. Working out at home instead of at a gym, where possible.
  5. Education moving to at home via Zoom.

These shifts favored eCommerce sites, delivery services, providers of video conferencing, home equipment providers, Telemedicine, web services providers, and many others. They devastated physical stores, especially large department stores, restaurants, local transportation services (like subway systems, busses, ride services), service providers like cleaners, beauty parlors, spas, and gyms, airlines, hotels, theaters and arenas, and sports leagues (including college sports). There was also a lesser negative secondary impact on the advertising and marketing sectors as companies with major demand losses curtailed their spend.

How Ya Gonna Keep ‘em Down on the Farm After They’ve Seen Paree?

This was a song in the aftermath of World War I highlighting the fact that farm boys, once experiencing a more sophisticated life and culture would find it hard to return to their old way of life. It could not be more appropriate for the current situation. The leap in how much nearly everyone in society is using eCommerce, video conferencing, schooling and working at home is accelerating trends that were already in place. In fact, for me:

  • Phone calls to friends that used to be audio calls are often Zoom video calls;
  • While my wife and I already were buying a great deal online, its now pretty much everything and when the pandemic ends our portion of purchases online will remain at an elevated level given the convenience and the availability of a larger choice of items
  • While I already had a home gym, many others are now substituting this for a gym membership
  • In the 25+ weeks I’ve been “sheltering in place” I visited my Menlo office for 2-3 hours on about 5 separate occasions. While I look forward to more in person meetings once we are back to normal, working at home is an option that I expect to continue to use with some frequency once the pandemic ends. I also believe that several Azure portfolio companies can reduce the number of in-person board meetings by alternating them with Zoom board meetings.

I honestly find it hard to believe that our society will not shift behavior in the same way as my wife, myself and companies in the Azure portfolio. After all, while most of us have suffered from lack of interaction with others, the pandemic has introduced many shifts that people find positive. With this, and keeping the larger available funds mentioned earlier in mind, here are some of my post pandemic predictions:

  1. Ecommerce share of the consumer wallet will be much higher than before Covid, but not as high as currently.
  2. Consumer spending for the near term will grow to a much larger amount than pre-pandemic days (by perhaps as much as 15-20%).
  3. Online Advertising Companies will have a banner year in 2021 as Ad spending resumes for industries that were impacted by Stay at Home. These include airlines, cruise lines, hotels, live events (sports, concerts, etc.), ticket sellers, physical retailers. As their spend resumes, players like Facebook, Google, Pinterest, Twitter and Snapchat will have elevated revenue versus comps from the depressed 2020 numbers.
  4. Video calls will INCREASE SHARE even compared to during the pandemic as the people who have experienced its benefits will find it hard to go back to plain audio, companies will see the economics of reducing travel by increasing the number of video meetings and about 25-30% of the workforce will continue to spend 2 or more days working at home. Additionally, companies will be more comfortable hiring IT staff in less expensive locations as they have seen the effectiveness of video vs in-person communication, and some colleges that previously only offered in-person education will augment their income by adding students that are taught remotely using video conferencing.
  5. Home remodels will have a renaissance from simply buying a new couch to completely redoing rooms or even the entire house.
  6. Suburban homes will increase in value (this appears to be already happening) as people value having outside space in case of a pandemic recurrence.
  7. Working from home will be at an elevated level vs pre-Covid but demand for office space will resume as workplaces will require more space per employee.
  8. More shopping malls will close as Big Box retailers close more stores (or in some cases cease to exist).
  9. The ability to sign and even notarize documents using the web will continue to see high growth in demand
  10. Vacations will resume, but for about a year or more there will be an increase in driving vacations
  11. More people than pre-Covid will take to wearing masks on a regular basis
  12. There will be a one year above normal bump in purchasing of luxury items like more expensive cars, expensive watches, new state of the art TVs

The Stock Market is already at Least Partly Discounting a Number of the Above Items

Many have been surprised at the resilience of the stock market during this crisis. It is important to remember that the Market discounts future results rather than past ones. So, I believe, many investors are looking at some of the above and factoring it into how to value stocks. The trickier issues involve stocks that have been beneficiaries of the pandemic but I’ll leave that for another time.

Soundbytes

  • In our January post of the top ten for the year we included Zoom as a stock buy in 2 ways. One was to simply buy the stock and the other was to buy the stock and sell both calls and puts. By June 30 the stock was at $253.54 per share and the call options (with a strike price of $80) was at $175 per share. Since the option premium was down to sub $2, I would have bought back the stock and the call options as there was little benefit to letting them ride as the IRR could not increase. But since I didn’t publish that then we can just assume I did that on September 1 where the premium was down to about $0.50. I can also buy back the puts at $0.40. That would mean I initially spent a net of $50.70 and received back $79.10, 8 months later. This translates to an annualized IRR of about 100% (on June 30 it would have been over 120%). Make no mistake, if you bought the stock and did not sell calls, I would continue to hold it as I expect another very strong (above analyst consensus forecast) quarter in Q3 which will be reported in early December.

The Valuation Bible

Facebook valuation image

After many years of successfully picking public and private companies to invest in, I thought I’d share some of the core fundamentals I use to think about how a company should be valued. Let me start by saying numerous companies defy the logic that I will lay out in this post, often for good reasons, sometimes for poor ones. However, eventually most companies will likely approach this method, so it should at least be used as a sanity check against valuations.

When a company is young, it may not have any earnings at all, or it may be at an earnings level (relative to revenue) that is expected to rise. In this post, I’ll start by considering more mature companies that are approaching their long-term model for earnings to establish a framework, before addressing how this framework applies to less mature companies. The post will be followed by another one where I apply the rules to Tesla and discuss how it carries over into private companies.

Growth and Earnings are the Starting Points for Valuing Mature Companies

When a company is public, the most frequently cited metric for valuation is its price to earnings ratio (PE). This may be done based on either a trailing 12 months or a forward 12 months. In classic finance theory a company should be valued based on the present value of future cash flows. What this leads to is our first rule:

Rule 1: Higher Growth Rates should result in a higher PE ratio.

When I was on Wall Street, I studied hundreds of growth companies (this analysis does not apply to cyclical companies) over the prior 10-year period and found that there was a very strong correlation between a given year’s revenue growth rate and the next year’s revenue growth rate. While the growth rate usually declined year over year if it was over 10%, on average this decline was less than 20% of the prior year’s growth rate. What this means is that if we took a group of companies with a revenue growth rate of 40% this year, the average organic growth for the group would likely be about 33%-38% the next year. Of course, things like recessions, major new product releases, tax changes, and more could impact this, but over a lengthy period of time this tended to be a good sanity test. As of January 2, 2018, the average S&P company had a PE ratio of 25 on trailing earnings and was growing revenue at 5% per year. Rule 1 implies that companies growing faster should have higher PEs and those growing slower, lower PEs than the average.

Graph 1: Growth Rates vs. Price Earnings Ratios

graph

The graph shows the correlation between growth and PE based on the valuations of 21 public companies. Based on Rule 1, those above the line may be relatively under-priced and those below relatively over-priced. I say ‘may be’ as there are many other factors to consider, and the above is only one of several ways to value companies. Notice that most of the theoretically over-priced companies with growth rates of under 5% are traditional companies that have long histories of success and pay a dividend. What may be the case is that it takes several years for the market to adjust to their changed circumstances or they may be valued based on the return from the dividend. For example, is Coca Cola trading on: past glory, its 3.5% dividend, or is there something about current earnings that is deceptive (revenue growth has been a problem for several years as people switch from soda to healthier drinks)? I am not up to speed enough to know the answer. Those above the line may be buys despite appearing to be highly valued by other measures.

Relatively early in my career (in 1993-1995) I applied this theory to make one of my best calls on Wall Street: “Buy Dell sell Kellogg”. At the time Dell was growing revenue over 50% per year and Kellogg was struggling to grow it over 4% annually (its compounded growth from 1992 to 1995, this was partly based on price increases). Yet Dell’s PE was about half that of Kellogg and well below the S&P average. So, the call, while radical at the time, was an obvious consequence of Rule 1. Fortunately for me, Dell’s stock appreciated over 65X from January 1993 to January 2000 (and well over 100X while I had it as a top pick) while Kellogg, despite large appreciation in the overall stock market, saw its stock decline slightly over the same 7-year period (but holders did receive annual dividends).

Rule 2: Predictability of Revenue and Earnings Growth should drive a higher trailing PE

Investors place a great deal of value on predictability of growth and earnings, which is why companies with subscription/SaaS models tend to get higher multiples than those with regular sales models. It is also why companies with large sales backlogs usually get additional value. In both cases, investors can more readily value the companies on forward earnings since they are more predictable.

Rule 3: Market Opportunity should impact the Valuation of Emerging Leaders

When one considers why high growth rates might persist, the size of the market opportunity should be viewed as a major factor. The trick here is to make sure the market being considered is really the appropriate one for that company. In the early 1990s, Dell had a relatively small share of a rapidly growing PC market. Given its competitive advantages, I expected Dell to gain share in this mushrooming market. At the same time, Kellogg had a stable share of a relatively flat cereal market, hardly a formula for growth. In recent times, I have consistently recommended Facebook in this blog for the very same reasons I had recommended Dell: in 2013, Facebook had a modest share of the online advertising, a market expected to grow rapidly. Given the advantages Facebook had (and they were apparent as I saw every Azure ecommerce portfolio company moving a large portion of marketing spend to Facebook), it was relatively easy for me to realize that Facebook would rapidly gain share. During the time I’ve owned it and recommended it, this has worked out well as the share price is up over 8X.

How the rules can be applied to companies that are pre-profit

As a VC, it is important to evaluate what companies should be valued at well before they are profitable. While this is nearly impossible to do when we first invest (and won’t be covered in this post), it is feasible to get a realistic range when an offer comes in to acquire a portfolio company that has started to mature. Since they are not profitable, how can I apply a PE ratio?

What needs to be done is to try to forecast eventual profitability when the company matures. A first step is to see where current gross margins are and to understand whether they can realistically increase. The word realistic is the key one here. For example, if a young ecommerce company currently has one distribution center on the west coast, like our portfolio company Le Tote, the impact on shipping costs of adding a second eastern distribution center can be modeled based on current customer locations and known shipping rates from each distribution center. Such modeling, in the case of Le Tote, shows that gross margins will increase 5%-7% once the second distribution center is fully functional. On the other hand, a company that builds revenue city by city, like food service providers, may have little opportunity to save on shipping.

  • Calculating variable Profit Margin

Once the forecast range for “mature” gross margin is estimated, the next step is to identify other costs that will increase in some proportion to revenue. For example, if a company is an ecommerce company that acquires most of its new customers through Facebook, Google and other advertising and has high churn, the spend on customer acquisition may continue to increase in direct proportion to revenue. Similarly, if customer service needs to be labor intensive, this can also be a variable cost. So, the next step in the process is to access where one expects the “variable profit margin” to wind up. While I don’t know the company well, this appears to be a significant issue for Blue Apron: marketing and cost of goods add up to about 90% of revenue. I suspect that customer support probably eats up (no pun intended) 5-10% of what is left, putting variable margins very close to zero. If I assume that the company can eventually generate 10% variable profit margin (which is giving it credit for strong execution), it would need to reach about $4 billion in annual revenue to reach break-even if other costs (product, technology and G&A) do not increase. That means increasing revenue nearly 5-fold. At their current YTD growth rate this would take 9 years and explains why the stock has a low valuation.

  • Estimating Long Term Net Margin

Once the variable profit margin is determined, the next step would be to estimate what the long-term ratio of all other operating cost might be as a percent of revenue. Using this estimate I can determine a Theoretic Net Earnings Percent. Applying this percent to current (or next years) revenue yields a Theoretic Earnings and a Theoretic PE (TPE):

TPE= Market Cap/Theoretic Earnings     

To give you a sense of how I successfully use this, review my recap of the Top Ten Predictions from 2017 where I correctly predicted that Spotify would not go public last year despite strong top line growth as it was hard to see how its business model could support more than 2% or so positive operating margin, and that required renegotiating royalty deals with record labels.  Now that Spotify has successfully negotiated a 3% lower royalty rate from several of the labels, it appears that the 16% gross margins in 2016 could rise to 19% or more by the end of 2018. This means that variable margins (after marketing cost) might be 6%. This would narrow its losses, but still means it might be several years before the company achieves the 2% operating margins discussed in that post. As a result, Spotify appears headed for a non-traditional IPO, clearly fearing that portfolio managers would not be likely to value it at its private valuation price since that would lead to a TPE of over 200. Since Spotify is loved by many consumers, individuals might be willing to overpay relative to my valuation analysis.

Our next post will pick up this theme by walking through why this leads me to believe Tesla continues to have upside, and then discussing how entrepreneurs should view exit opportunities.


SoundBytes

I’ve often written about effective shooting percentage relative to Stephen Curry, and once again he leads the league among players who average 15 points or more per game. What also accounts for the Warriors success is the effective shooting of Klay Thompson, who is 3rd in the league, and Kevin Durant who is 6th. Not surprisingly, Lebron is also in the top 10 (4th). The table below shows the top ten among players averaging 15 points or more per game.  Of the top ten scorers in the league, 6 are among the top 10 effective shooters with James Harden only slightly behind at 54.8%. The remaining 3 are Cousins (53.0%), Lillard (52.2%), and Westbrook, the only one below the league average of 52.1% at 47.4%.

Table: Top Ten Effective Shooters in the League

table

*Note: Bolded players denote those in the top 10 in Points per Game

Will Grocery Shopping Ever be the Same?

Will grocery shopping ever be the same?

Dining and shopping today is very different than in days gone by – the Amazon acquisition of Whole Foods is a result

“I used to drink it,” said Andy Warhol once of Campbell’s soup. “I used to have the same lunch every day, for 20 years, I guess, the same thing over and over again.” In Warhol’s signature medium, silkscreen, the artist reproduced his daily Campbell’s soup can over and over again, changing only the label graphic on each one.

When I was growing up I didn’t have exactly the same thing over and over like Andy Warhol, but virtually every dinner was at home, at our kitchen table (we had no dining room in the 4-room apartment). Eating out was a rare treat and my father would have been abhorred if my mom brought in prepared food. My mom, like most women of that era, didn’t officially work, but did do the bookkeeping for my dad’s plumbing business. She would shop for food almost every day at a local grocery and wheel it home in her shopping cart.

When my wife and I were raising our kids, the kitchen remained the most important room in the house. While we tended to eat out many weekend nights, our Sunday through Thursday dinners were consumed at home, but were sprinkled with occasional meals brought in from the outside like pizza, fried chicken, ribs, and Chinese food. Now, given a high proportion of households where both parents work, eating out, fast foods and prepared foods have become a large proportion of how Americans consume dinner. This trend has reached the point where some say having a traditional kitchen may disappear as people may cease cooking at all.

In this post, I discuss the evolution of our eating habits, and how they will continue to change. Clearly, the changes that have already occurred in shopping for food and eating habits were motivations for Amazon’s acquisition of Whole Foods.

The Range of How We Dine

Dining can be broken into multiple categories and families usually participate in all of them. First, almost 60% of dinners eaten at home are still prepared there. While the percentage has diminished, it is still the largest of the 4 categories for dinners. Second, many meals are now purchased from a third party but still consumed at home. Given the rise of delivery services and greater availability of pre-cooked meals at groceries, the category spans virtually every type of food. Thirdly, many meals are purchased from a fast food chain (about 25% of Americans eat some type of fast food every day1) and about 20% of meals2 are eaten in a car. Finally, a smaller percentage of meals are consumed at a restaurant. (Sources: 1Schlosser, Eric. “Americans Are Obsessed with Fast Food: The Dark Side of the All-American Meal.” CBSNews. Accessed April 14, 2014 / 2Stanford University. “What’s for Dinner?” Multidisciplinary Teaching and Research at Stanford. Accessed April 14, 2014).

The shift to consuming food away from home has been a trend for the last 50 years as families began going from one worker to both spouses working. The proportion of spending on food consumed away from home has consistently increased from 1965-2014 – from 30% to 50%.

Source: Calculated by the Economic Research Service, USDA, from various data sets from the U.S. Census Bureau and the Bureau of Labor Statistics.

With both spouses working, the time available to prepare food was dramatically reduced. Yet, shopping in a supermarket remained largely the same except for more availability of prepared meals. Now, changes that have already begun could make eating dinner at home more convenient than eating out with a cost comparable to a fast food chain.

Why Shopping for Food Will Change Dramatically over the Next 30 Years

Eating at home can be divided between:

  1. Cooking from scratch using ingredients from general shopping
  2. Buying prepared foods from a grocery
  3. Cooking from scratch from recipes supplied with the associated ingredients (meal kits)
  4. Ordering meals that have previously been prepared and only need to be heated up
  5. Ordering meals from a restaurant that are picked up or delivered to your home
  6. Ordering “fast food” type meals like pizza, ribs, chicken, etc. for pickup or delivery.

I am starting with the assumption that many people will still want to cook some proportion of their dinners (I may be romanticizing given how I grew up and how my wife and I raised our family). But, as cooking for yourself becomes an even smaller percentage of dinners, shopping for food in the traditional way will prove inefficient. Why buy a package of saffron or thyme or a bag of onions, only to see very little of it consumed before it is no longer usable? And why start cooking a meal, after shopping at a grocery, only to find you are missing an ingredient of the recipe? Instead, why not shop by the meal instead of shopping for many items that may or may not end up being used.

Shopping by the meal is the essential value proposition offered by Blue Apron, Plated, Hello Fresh, Chef’d and others. Each sends you recipes and all the ingredients to prepare a meal. There is little food waste involved (although packaging is another story). If the meal preparation requires one onion, that is what is included, if it requires a pinch of saffron, then only a pinch is sent. When preparing one of these meals you never find yourself missing an ingredient. It takes a lot of the stress and the food waste out of the meal preparation process. But most such plans, in trying to keep the cost per meal to under $10, have very limited choices each week (all in a similar lower cost price range) and require committing to multiple meals per week. Chef’d, one of the exceptions to this, allows the user to choose individual meals or to purchase a weekly subscription. They also offer over 600 options to choose from while a service like Blue Apron asks the subscriber to select 3 out of 6 choices each week.

Blue Apron meals portioned perfectly for the amount required for the recipes

My second assumption is that the number of meals that are created from scratch in an average household will diminish each year (as it already has for the past 50 years). However, many people will want to have access to “preferred high quality” meals that can be warmed up and eaten, especially in two-worker households. This will be easier and faster (but perhaps less gratifying) than preparing a recipe provided by a food supplier (along with all the ingredients). I am talking about going beyond the pre-cooked items in your average grocery. There are currently sources of such meals arising as delivery services partner with restaurants to provide meals delivered to your doorstep. But this type of service tends to be relatively expensive on a per meal basis.

I expect new services to arise (we’ve already seen a few) that offer meals that are less expensive prepared by “home chefs” or caterers and ordered through a marketplace (this is category 4 in my list). The marketplace will recruit the chefs, supply them with packaging, take orders, deliver to the end customers, and collect the money. Since the food won’t be from a restaurant, with all the associated overhead, prices can be lower. Providing such a service will be a source of income for people who prefer to work at home. Like drivers for Uber and Lyft, there should be a large pool of available suppliers who want to work in this manner. It will be very important for the marketplaces offering such service to curate to ensure that the quality and food safety standards of the product are guaranteed. The availability of good quality, moderately priced prepared meals of one’s choice delivered to the home may begin shifting more consumption back to the home, or at a minimum, slow the shift towards eating dinners away from home.

Where will Amazon be in the Equation?

In the past, I predicted that Amazon would create physical stores, but their recent acquisition of Whole Foods goes far beyond anything I forecast by providing them with an immediate, vast network of physical grocery stores. It does make a lot of sense, as I expect omnichannel marketing to be the future of retail.  My reasoning is simple: on the one hand, online commerce will always be some minority of retail (it currently is hovering around 10% of total retail sales); on the other hand, physical retail will continue to lose share of the total market to online for years to come, and we’ll see little difference between e-commerce and physical commerce players.  To be competitive, major players will have to be both, and deliver a seamless experience to the consumer.

Acquiring Whole Foods can make Amazon the runaway leader in categories 1 and 2, buying ingredients and/or prepared foods to be delivered to your home.  Amazon Fresh already supplies many people with products that are sourced from grocery stores, whether they be general food ingredients or traditional prepared foods supplied by a grocery. They also have numerous meal kits that they offer, and we expect (and are already seeing indications) that Amazon will follow the Whole Foods acquisition by increasing its focus on “meal kits” as it attempts to dominate this rising category (3 in our table).

One could argue that Whole Foods is already a significant player in category 4 (ordering meals that are prepared, and only need to be heated up), believing that category 4 is the same as category 2 (buying prepared meals from a grocery). But it is not. What we envision in the future is the ability to have individuals (who will all be referred to as “Home Chefs” or something like that) create brands and cook foods of every genre, price, etc. Customers will be able to order a set of meals completely to their taste from a local home chef. The logical combatants to control this market will be players like Uber and Lyft, guys like Amazon and Google, existing recipe sites like Blue Apron…and new startups we’ve never heard of.

Trump’s Carrier deal a positive step for workers

It saves at least 800 jobs at a 14x return to government

Let me start this post by saying I did not vote for Donald Trump and consider myself an independent. But, as my readers know, I can’t help analyzing everything including company business models (both public and private), basketball performance, football, and of course, economics. I have, to date, resisted opining on the election, as it appears to be a polarizing event and therefore a no-win for those who comment. However, I care deeply about the future of our country and the welfare of workers of all levels. Being in Venture Capital allows me to believe (perhaps naively) that I contribute to adding jobs to our country. All this brings me to the recent agreement reached between Trump and Carrier, as it may mark a shift in economic policy.

A key assumption in interpreting the value of the deal is how many jobs were already slated by Carrier to leave the country and which of these were saved. President-Elect Trump has claimed he saved 1,150 jobs. Trump’s opponents say 350 were never slated to leave the country. I’m not going to try to figure out which camp is right. My analysis will only assume 800 manufacturing jobs that were slated to leave the country now will remain in Indiana. This does not seem to be disputed by anyone and was confirmed by a Carrier spokesperson. My observations for this analysis are:

  1. Had those jobs left, 800 fewer people would be employed (which might be different ones than these but less jobs mean less employment).
  2. The average worker at these jobs would make $20 an hour plus overtime (some reports have put this as high as $30 per hour fully loaded cost to Carrier). The average worker at these jobs would make about $45,000 annually, assuming modest overtime.
  3. On average, assuming working spouses in many cases, family income would be an average of $65,000.

Given what we know, here’s why I think Trump’s Carrier deal is a good one for the U.S., and actually results in revenue to the government that far exceeds the tax credits:

Social security taxes are currently 6.2% of each worker’s wages. The employer matches that, resulting in about $5,600 in FICA tax income to the government per worker from social security. Medicare is 1.45% and is also matched, resulting in about $1,300 in Medicare taxes paid to the government.

The federal income tax increment between a $20,000 family income (for spouse) and $65,000 family income is about $4,000 (but depends on a number of factors). Indiana state taxes of 3.3% on adjusted gross income comes out to nearly $1,400.

To make the total relatively conservative, I’ve omitted county taxes, payroll taxes and other payments that various other governmental entities might receive. This should mean the total financial income to various governmental entities from these jobs remaining probably exceeds those calculated in Table 1 below even if some of my rough assumptions are not exact.

Table 1. Governmental Income per Worker

Table

So, the economic question of whether the subsidy Trump agreed to was worth it partly depends on how much additional income was derived by the government versus the tax credits of $700,000 per year granted to Carrier in exchange for keeping the jobs here.

Of course, there is also a multiplier effect of families having higher income available for spending. And if 800 additional people are unemployed, there are numerous costs paid by the government. We’ll leave these out of the analysis, but they are all real benefits to our society of more people being employed. It is important to realize how expensive it is for the government to subsidize unemployed workers as opposed to realizing multiple sources of tax revenues when these workers have good jobs.

If we take the total from Table 1, which we believe underestimates the income to governmental entities, and multiply it by the 800 workers, the annual benefit adds up to about $9.8 million. Since Carrier is getting a $700,000 annual subsidy, the governmental revenue derived is over 14 times the cost. And that is without including a number of other benefits, some of which we mentioned above. As an investor, I’d take a 14 times return every day of the year. Wouldn’t you? Shouldn’t the government?

This is not a sweetheart deal for Carrier

I won’t go into all the math, but it indicates that Carrier will spend tens of millions of dollars more by keeping workers in the U.S. rather than moving them to Mexico. Comments that the $700,000 yearly benefit they have been given is a sweetheart deal does not appear to be the case.

Why the Democrats lost the election

Trump campaigned on the promise that he would create policies and heavily negotiate to increase employment in America. While this is a small victory in the scheme of things and certainly falls short of retaining all the jobs Carrier wanted to move, the analysis demonstrates that spending some money in tax breaks to increase employment has a large payback to government. It also means a lot to 800 people who greatly prefer being paid for working rather than receiving unemployment benefits.

Is this approach scalable?

The other question is whether this is scalable as a way of keeping jobs in America. Clearly Trump would not be able to negotiate individually with every company planning on moving jobs out of the U.S. Some infrastructure would need to be created – the question would be at what cost? If this became policy, would it encourage more companies to consider moving jobs as a way of attracting tax benefits? Any approach would need to prevent that. My guess is that getting a few companies known to be moving jobs to reconsider is only an interim step. If Trump is to fulfill his promise, an ongoing solution will be needed. But it is important to properly evaluate any steps from an impartial financial viewpoint as the United States needs to increase employment.

Employment is the right way of measuring the economy’s health

My post of March 2015 discussed the health of the economy and pointed out that looking at the Unemployment Rate as the key indicator was deceptive as much of the improvement was from people dropping out of the workforce. Instead, I advocated using the “Employment Rate” (the percent of the eligible population employed) as a better indicator. I noted that in 2007, pre-downturn, 63.0% of the population had a job. By 2010 this had declined to 58.5%, a 450 basis point drop due to the recession. Four years later the “Recovery” drove that number up to 59.0% which meant only 1/9 of the drop in those working returned to the workforce. Since then the workforce has recovered further but still stands at 325 basis points below the pre-recession level. That is why the rust belt switched from voting Democrat to President-Elect Trump.

The real culprit is loss of better quality job opportunities

In an article in the New York Times on December 7, “stagnant wages” since 1980 were blamed for lack of income growth experienced by the lower half on the economic scale. I believe that the real culprit is loss of better quality job opportunities. Since 1980 production and non-supervisory hourly wages have increased 214% but at the same time manufacturing workers as a percent of the workforce has shrunk from 18.9% to 8.1% and there has been no recovery of these jobs subsequent to the 2007-2010 recession. Many of these displaced workers have been forced to take lower paying jobs in the leisure, health care or other sectors, part-time jobs or dropped out of the workforce entirely (triggering substantial government spending to help them). This loss of available work in manufacturing is staggering and presents a challenge to our society. It also is the button Donald Trump pushed to get elected. I am hoping he can change the trend but it is a difficult task for anyone, Republican or Democrat.

A condensed version of of this post is featured on Fortune.com 

How Healthy Is Our Economy?

In this era of globalization of the work force, the United States has become a country with a split personality. On the one hand, we continue to lead the world in innovation driven by a strong college and graduate education system (15 of the 20 top rated universities in the world are in the U.S., according to the Times Higher Education World rankings), a large population of risk-taking entrepreneurs, an influx of hard working, talented immigrants and the strength of the Venture Capital industry. This innovation is responsible for creating many jobs, as can be seen at the likes of Google, Apple, Tesla, Amazon, Facebook, LinkedIn, Twitter, Uber and many more rising stars.

On the other hand, we have failed as a country to remain competitive across the workforce. As a result, despite the many jobs created by innovators, the workforce as a portion of the population is contracting and currently is barely above recession level lows. Although this month’s jobs report suggests the employment picture is improving, it’s a mistake to think the falling unemployment rate from the January 2010 recession high of 10.6% to a recent level of 5.8% in February 2015 is proof the economy is healthy once more[1] . While the 2007 pre-downturn level was a much lower 4.3%, the degree of failure to recover is considerably bleaker than the current 5.8% level versus the pre-recession 4.3% difference would indicate.

Employment Rather than Unemployment is a Better Measure of Economic Health

The employment rate (the percentage of the population that has a job) is a far better indicator of the health of the economy than the unemployment rate (the % of those seeking jobs that don’t have one). People with jobs are what supports the economy and the mere fact that someone removes themselves from the workforce does not make the economy healthier. In fact, the percentage of the population that is not in the labor force is at its highest level in 36 years. In both January and February 2015, the seasonally unadjusted labor force participation rate was 62.5%. That means that 37.5% were not participating in the labor force[2] . The last time the labor force participation rate sunk to these levels was in 1978, when it was 62.8%. At that time, interest rates were soaring and the prime rate peaked at 11.75% later that year.

In 2007, 66.0% of the population was in the workforce (that is, sought a job) and 95.4% of those had a job, meaning 63.0% of the population were employed. In 2010, 64.7% of the population was still in the work force and 90.4% of those had a job, meaning that 58.5% of Americans were still employed during the lowest period in the downturn. How much of the 4.5 percentage points (or 450 basis points) loss of employment has been recovered? In 2014, only 62.9% of the population was in the workforce. So, despite the shrinkage in the unemployment rate (which was mostly due to fewer people seeking jobs), we now have 59.0% of the population working, a 50 basis point improvement from the low point of the recession. But there was a 450 basis point shrinkage in employment during the recession, so a 50 basis point improvement hardly qualifies as a true recovery!

Labor force & employment

The Law of Unintended Consequences Often Plagues the Best of Intentions

Our federal and state governments frequently pass laws that are intended to help workers. But often the cost to employers of fulfilling these new obligations has unintended consequences as added expense drives reaction. Examples:

1. Increase minimum wage: reaction by many employers is to replace domestic workers with ones in other countries and/or to increase the use of automation, reducing the work force. Although there are conflicting data on the impact of a minimum wage increase on unemployment, a 2013 study by the AAF found that a $1 increase in the minimum wage was associated with a 1.5% increase in the unemployment rate and a 0.18% decrease in the net job growth rate.

2. Taxing companies repatriating cash from abroad at high rates: Reaction by many corporations is to decide not to repatriate the cash and, instead, to re-invest it by expanding operations in other countries instead of in the United States, causing a loss of potential jobs here.

3. Cities controlling the number of taxis allowed (through requirement to purchase a medallion): Leading to the success of Uber as unavailability of sufficient numbers of cabs during high requirement periods causes a massive conversion to Uber and a loss of income for taxi drivers.

Why is the economy failing to recover to prior levels? My belief is that the combination of the Affordable Care Act (a $2,000 cost per employee), increasing minimum wages and strong competition from abroad have all contributed to the problem. Furthermore, they have not only held back employment increases but also pushed the part-time portion of the workforce to about 19% (it was 13.5% in the late 1960s and between 17% and 18% in the early 2000s).

Part-time

Finally, while our college and graduate education is outstanding, the U.S. K-12 education ranks quite low amongst nations:
1. 36th in mathematics for 15 year olds[3]
2. 24th in reading for 15 year olds[3]
3. 28th in science for 15 years olds[3]
4. 14th in cognitive skills and educational attainment[4]
5. 11th in fourth-grade mathematics and 9th in eighth-grade mathematics[5]
6. 7th in fourth-grade science and 10th in eighth-grade science[5]

Much of our priority as a country tends to emphasize short-term gratification over long-term issues like investing in primary education. If we make workers more expensive than in other parts of the developed world through requirements of expensive benefits, high minimum wages, heavy taxation, etc., then we need to make sure they are more skilled through better education and training. One of the policies that helped offset this in the past is prioritizing ease of immigration for those at the high end of the spectrum who could help create jobs.

If we fail to change our approach going forward, I continued to be concerned for America’s long-term future.

[1] Unemployment Rate (Not Seasonally Adjusted), United States Department of Labor, Bureau of Labor Statistics, http://data.bls.gov/timeseries/LNU04000000
[2] http://www.bls.gov/news.release/pdf/empsit.pdf
[3] Organization for Economic Cooperation and Development (OECD), Program for International Student Assessment (PISA). 65 educational systems ranked.
[4] Pearson Global Index of Cognitive Skills and Educational Attainment compares the performance of 39 countries and one region (Hong Kong) on two categories of education: Cognitive Skills and Educational Attainment. The Index provides a snapshot of the relative performance of countries based on their education outputs.
[5] International Study Center at Boston College. Fourth graders in 57 countries or education systems took the math and science tests, while 56 countries or education systems administered the tests to eighth graders.

Soundbytes:

– It will be interesting to see what the impact of the largest salary-cap jump in league history will be on the 2016-17 season. For example, LeBron James could take his salary from about $22 million next season to around $30 million if he signs for the maximum salary in 2016. This could have significant implications for many free agents and there might be those who accept only one-year contracts so they can retest the market in 2016, when there is more money available.