Ending the Year on a High Note…or should I say Basketball Note

Deeper analysis on what constitutes MVP Value

Blog 35 photo

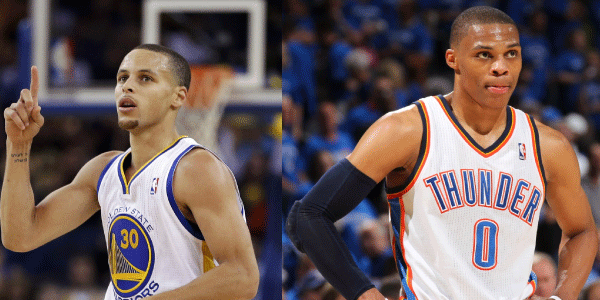
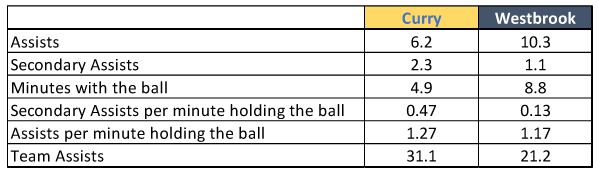
In my blog post dated February 3, 2017, I discussed several statistics that are noteworthy in analyzing how much a basketball player contributes to his team’s success. In it, I compared Stephen Curry and Russell Westbrook using several advanced statistics that are not typically highlighted.

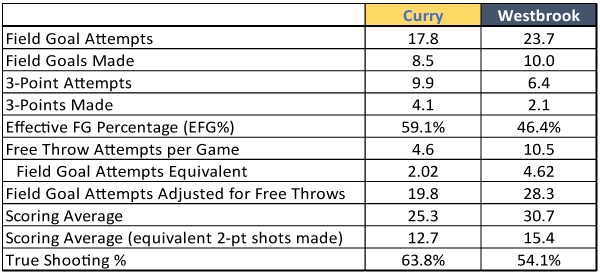
The first statistic: Primary plus Secondary Assists per Minute a player has the ball. Time with the ball equates to assist opportunity, so holding the ball most of the time one’s team is on offense reduces the opportunity for others on the team to have assists. This may lead to fewer assisted baskets for the whole team, but more for the individual player. As of the time of the post, Curry had 1.74 assists (primary plus secondary) per minute he had the ball, while Westbrook only had 1.30 assists per minute. Curry’s efficiency in assists is one of the reasons the Warriors total almost 50% more assists per game than the Thunder, make many more easy baskets, and lead the league in field goal percentage.

The second statistic: Effective Field Goal Percentages (where making a 3-point shot counts the same as making 1 ½ 2-point shots). Again, Curry was vastly superior to Westbrook at 59.1% vs 46.4%. What this means is that Westbrook scores more because he takes many more shots, but these shots are not very efficient for his team, as Westbrook’s shooting percentage continued to be well below the league average of 45.7% (Westbrook’s was 42.5% last season and is 39.6% this season to date).

The third statistic: Plus/Minus.  Plus/Minus reflects the number of points your team outscores opponents while you are on the floor.  Curry led the league in this in 2013, 2014, and 2016 and leads year-to-date this season. In 2015 he finished second by a hair to a teammate. Westbrook has had positive results, but last year averaged 3.2 per 36 minutes vs Curry’s 13.8. One challenge to the impressiveness of this statistic for Curry is whether his leading the league in Plus/Minus is due to the quality of players around him. In refute, it is interesting to note that he led the league in 2013 when Greene was a sub, Durant wasn’t on the team and Thompson was not the player he is today.

The background shown above brings me to today’s post which outlines another way of looking at a player’s value. The measurement I’m advocating is: How much does he help teammates improve? My thesis is that if the key player on a team creates a culture of passing the ball and setting up teammates, everyone benefits. Currently the value of helping teammates is only measured by the number of assists a player records. But, if I’m right, and the volume of assists is the wrong measure of helping teammates excel (as sometimes assists are the result of holding the ball most of the time) then I should be able to verify this through teammate performance. If most players improve their performance by getting easier shots when playing with Westbrook or Curry, then this should translate into a better shooting percentage. That would mean we should be able to see that most teammates who played on another team the year before or the year after would show a distinct improvement in shooting percentage while on his team. This is unlikely to apply across the board as some players get better or worse from year to year, and other players on one’s team also impact this data. That being said, looking at this across players that switch teams is relevant, especially if there is a consistent trend.

To measure this for Russell Westbrook, I’ve chosen 5 of the most prominent players that recently switched teams to or from Oklahoma City: Victor Oladipo, Kevin Durant, Carmelo Anthony, Paul George and Enes Kantor. Three left Oklahoma City and two went there from another team. For the two that went there, Paul George and Carmelo Anthony, I’ll compare year-to-date this season (playing with Westbrook) vs their shooting percentage last year (without Westbrook). For Kantor and Oladipo, the percentage last year will be titled “with Westbrook” and this year “without Westbrook” and for Durant, the seasons in question are the 2015-16 season (with Westbrook) vs the 2016-17 season (without Westbrook).

Shooting Percentage

Table 0

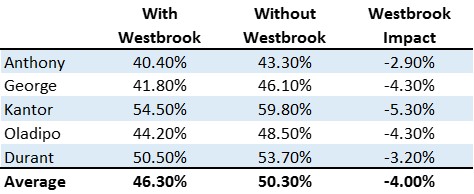
Given that the league average is to shoot 45.7%, shooting below that can hurt a team, while shooting above that should help. An average team takes 85.4 shots per game, so a 4.0% swing translates to over 8.0 points a game. To put that in perspective, the three teams with the best records this season are the Rockets, Warriors and Celtics and they had first, second and fourth best Plus/Minus for the season at +11.0, +11.0 and +5.9, respectively. The Thunder came in at plus 0.8. If they scored 8 more points a game (without giving up more) their Plus/Minus would have been on a par with the top three teams, and their record likely would be quite a bit better than 12 and 14.

Curry and His Teammates Make Others Better

How does Curry compare? Let’s look at the same statistics for Durant, Andrew Bogut, Harrison Barnes, Zaza Pachulia and Ian Clark (the primary player who left the Warriors). For Barnes, Bogut, Pachulia and Durant I’ll compare the 2015 and 2016 seasons and for Clark I’ll use 2016 vs this season-to-date.

Table 1

So, besides being one of the best shooters to play the game, Curry also has a dramatic impact on the efficiency of other players on his team. Perhaps it’s because opponents need to double team him, which allows other players to be less guarded. Perhaps it’s because he bought into Kerr’s “spread the floor, move the ball philosophy”. Whatever the case, his willingness to give up the ball certainly has an impact. And that impact, plus his own shooting efficiency, clearly leads to the Warriors being an impressive scoring machine. As an aside, recent Warrior additions Casspi and Young are also having the best shooting percentages of their careers.

Westbrook is a Great Player Who Could be Even Better

I want to make it clear that I believe Russell Westbrook is a great player. His speed, agility and general athleticism allow him to do things that few other players can match. He can be extremely effective driving to the basket when it is done under control. But, he is not a great outside shooter and could help his team more by taking fewer outside shots and playing less one/one basketball. Many believed that the addition of George and Anthony would make Oklahoma City a force to be reckoned with, but to date this has not been the case. Despite the theoretic offensive power these three bring to the table, the team is 24th in the league in scoring at 101.8 per game, 15 points per game behind the league leading Warriors. This may change over the course of the season but I believe that each of them playing less one/one basketball would help.

Using Technology to Revolutionize Urban Transit

Winter Traffic Photo

Worsening traffic requires new solutions

As our population increases, the traffic congestion in cities continues to worsen. In the Bay Area my commute into the city now takes about 20% longer than it did 10 years ago, and driving outside of typical rush hours is now often a major problem. In New York, the subway system helps quite a bit, but most of Manhattan is gridlocked for much of the day.

The two key ways of relieving cities from traffic snarl are:

  1. Reduce the number of vehicles on city streets
  2. Increase the speed at which vehicles move through city streets

Metro areas have been experimenting with different measures to improve car speed, such as:

  1. Encouraging carpooling and implementing high occupancy vehicle lanes on arteries that lead to urban centers
  2. Converting more streets to one-way with longer periods of green lights
  3. Prohibiting turns onto many streets as turning cars often cause congestion

No matter what a city does, traffic will continue to get worse unless compelling and effective urban transportation systems are created and/or enhanced. With that in mind, this post will review current alternatives and discuss various ways of attacking this problem.

Ride sharing services have increased congestion

Uber and Lyft have not helped relieve congestion. They have probably even led to increasing it, as so many rideshare vehicles are cruising the streets while awaiting their next ride. While the escalation of ridesharing services like Uber and Lyft may have reduced the number of people who commute using their own car to work, they have merely substituted an Uber driver for a personal driver. Commuters parked their cars when arriving at work while ridesharing drivers continue to cruise after dropping off a passenger, so the real benefit here has been in reducing demand for parking, not improving traffic congestion.

A simple way to think about this is that the total cars on the street at any point in time consists of those with someone going to a destination plus those cruising awaiting picking up a passenger. Uber does not reduce the number of people going to a destination by car (and probably increases it as some Uber riders would have taken public transportation if not for Uber).

The use of optimal traffic-aware routing GPS apps like Waze doesn’t reduce traffic but spreads it more evenly among alternate routes, therefore providing a modest increase in the speed that vehicles move through city streets. The thought that automating these vehicles will relieve pressure is unrealistic, as automated vehicles will still be subject to the same movement as those with drivers (who use Waze). Automating ridesharing cars can modestly reduce the number of cruising vehicles, as Uber and Lyft can optimize the number that remain in cruise mode. However, this will not reduce the number of cars transporting someone to a destination. So, it is clear to me that ridesharing services increase rather than reduce the number of vehicles on city streets and will continue to do so even when they are driverless.

Metro rail systems effectively reduce traffic but are expensive and can take decades to implement

Realistically, improving traffic flow requires cities to enhance their urban transport system, thereby reducing the number of vehicles on their streets. There are several historic alternatives but the only one that can move significant numbers of passengers from point A to point B without impacting other traffic is a rail system. However, construction of a rail system is costly, highly disruptive, and can take decades to go from concept to completion. For example, the New York City Second Avenue Line was tentatively approved in 1919. It is educational to read the history of reasons for delays, but the actual project didn’t begin until 2005 despite many millions of dollars being spent on planning, well before that date. The first construction commenced in April 2007. The first phase of the construction cost $4.5 billion and included 3 stations and 2 miles of tunnels. This phase was complete, and the line opened in January 2017. By May daily ridership was approximately 176,000 passengers. A second phase is projected to cost an additional $6 billion, add 1.5 more miles to the line and be completed 10-12 years from now (assuming no delays). Phase 1 and 2 together from actual start to hopeful finish will be over two decades from the 2005 start date…and about a century from when the line was first considered!

Dedicated bus rapid transit, less costly and less effective

Most urban transportation networks include bus lines through city streets. While buses do reduce the number of vehicles on the roads, they have several challenges that keep them from being the most efficient method of urban transport:

  1. They need to stop at traffic lights, slowing down passenger movement
  2. When they stop to let one passenger on or off, all other passengers are delayed
  3. They are very large and often cause other street traffic to be forced to slow down

One way of improving bus efficiency is a Dedicated Bus Rapid Transit System (BRT). Such a system creates a dedicated corridor for buses to use. A key to increasing the number of passengers such a system can transport is to remove them from normal traffic (thus the dedicated lanes) and to reduce or eliminate the need to stop for traffic lights by either altering the timing to automatically accommodate minimal stoppage of the buses or by creating overpasses and/or underpasses. If traffic lights are altered, the bus doesn’t stop for a traffic light but that can mean cross traffic stops longer, thus increasing cross traffic congestion. Elimination of interference using underpasses and/or overpasses at each intersection can be quite costly given the substantial size of buses. San Francisco has adopted the first, less optimal, less costly, approach along a two-mile corridor of Van Ness Avenue. The cost will still be over $200 million (excluding new buses) and it is expected to increase ridership from about 16,000 passengers per day to as much as 22,000 (which I’m estimating translates to 2,000-3,000 passengers per hour in each direction during peak hours). Given the increased time cross traffic will need to wait, it isn’t clear how much actual benefit will occur.

Will Automated Car Rapid Transit (ACRT) be the most cost effective solution?

I recently met with a company that expects to create a new alternative using very small automated car rapid transit (ACRT) that costs a fraction of and has more than double the capacity of a BRT.  The basic concept is to create a corridor similar to that of a BRT, utilizing underpasses under some streets and bridges over other streets. Therefore, cross traffic would not be affected by longer traffic light stoppages. Since the size of an underpass (tunnel) to accommodate a very small car is a fraction of that of a very large bus, so is the cost. The cars would be specially designed driverless automated cars that have no trunk, no back seats and hold one or two passengers. The same 3.5 to 4.0-meter-wide lane needed for a BRT would be sufficient for more than two lanes of such cars. Since the cars would be autonomous, speed and distance between cars could be controlled so that all cars in the corridor move at 30 miles per hour unless they exited. Since there would be overpasses and underpasses across each cross street, the cars would not stop for lights. Each vehicle would hold one or two passengers going to the same stop, so the car would not slow until it reached that destination. When it did, it would pull off the road without reducing speed until it was on the exit ramp.

The company claims that it will have the capacity to transport 10,000 passengers per hour per lane with the same setup as the Van Ness corridor if underpasses and overpasses were added. Since a capacity of 10,000 passengers per hour in each direction would provide significant excess capacity compared to likely usage, 2 lanes (3 meters in total width instead of 7-8 meters) is all that such a system would require. The reduced width would reduce construction cost while still providing excess capacity. Passengers would arrive at destinations much sooner than by bus as the autos would get there at 30 miles per hour without stopping even once. This translates to a 2-mile trip taking 4 minutes! Compare that to any experience you have had taking a bus.  The speed of movement also helps make each vehicle available to many more passengers during a day. While it is still unproven, this technology appears to offer significant cost/benefit vs other alternatives.

Conclusion

The population expansion within urban areas will continue to drive increased traffic unless additional solutions are implemented. If it works as well in practice as it does in theory, an ACRT like the one described above offers one potential way of improving transport efficiency. However, this is only one of many potential approaches to solving the problem of increased congestion. Regardless of the technology used, this is a space where innovation must happen if cities are to remain livable. While investment in underground rail is also a potential way of mitigating the problem, it will remain an extremely costly alternative unless innovation occurs in that domain.

How much do you know about SEO?

Search Engine Optimization: A step by step process recommended by experts

Azure just completed its annual ecommerce marketing day. It was attended by 15 of our portfolio companies, two high level executives at major corporations, a very strong SEO consultant and the Azure team. The purpose of the day is to help the CMOs in the Azure portfolio gain a broader perspective on hot marketing topics and share ideas and best practices. This year’s agenda included the following sessions:

  1. Working with QVC/HSN
  2. Brand building
  3. Using TV, radio and/or podcasts for marketing
  4. Techniques to improve email marketing
  5. Measuring and improving email marketing effectiveness
  6. Storytelling to build your brand and drive marketing success
  7. Working with celebrities, brands, popular YouTube personalities, etc.
  8. Optimizing SEO
  9. Product Listing Ads (PLAs) and Search Engine Marketing (SEM)

One pleasant aspect of the day is that it generated quite a few interesting ideas for blog posts! In other words, I learned a lot regarding the topics covered. This post is on an area many of you may believe you know well, Search Engine Optimization (SEO). I thought I knew it well too… before being exposed to a superstar consultant, Allison Lantz, who provided a cutting-edge presentation on the topic. With her permission, this post borrows freely from her content. Of course, I’ve added my own ideas in places and may have introduced some errors in thinking, and a short post can only touch on a few areas and is not a substitute for true expertise.

SEO is Not Free if You Want to Optimize

I have sometimes labeled SEO as a free source of visitors to a site, but Allison correctly points out that if you want to focus on Optimization (the O in SEO) with the search engines, then it isn’t free, but rather an ongoing process (and investment) that should be part of company culture. The good news is that SEO likely will generate high quality traffic that lasts for years and leads to a high ROI against the cost of striving to optimize. All content creators should be trained to write in a manner that optimizes generating traffic by using targeted key words in their content and ensuring these words appear in the places that are optimal for search. To be clear, it’s also best if the content is relevant, well written and user-friendly. If you were planning to create the content anyway, then the cost of doing this is relatively minor. However, if the content is incremental to achieve higher SEO rankings, then the cost will be greater. But I’m getting ahead of myself and need to review the step by step process Allison recommends to move towards optimization.

Keyword Research

The first thing to know when developing an SEO Strategy is what you are targeting to optimize. Anyone doing a search enters a word or phrase they are searching for. Each such word or phrase is called a ‘keyword’. If you want to gain more users through SEO, it’s critical to identify thousands, tens of thousands or even hundreds of thousands of keywords that are relevant to your site. For a fashion site, these could be brands, styles, and designers. For an educational site like Education.com (an Azure portfolio company that is quite strong in SEO and ranks on over 600,000 keywords) keywords might be math, english, multiplication, etc. The broader the keywords, the greater the likelihood of higher volume.  But along with that comes more competition for search rankings and a higher cost per keyword. The first step in the process is spending time brainstorming what combinations of words are relevant to your site – in other words if someone searched for that specific combination would your site be very relevant to them? To give you an idea of why the number gets very high, consider again Education.com. Going beyond searching on “math”, one can divide math into arithmetic, algebra, geometry, calculus, etc. Each of these can then be divided further. For example, arithmetic can include multiplication, addition, division, subtraction, exponentiation, fractions and more.  Each of these can be subdivided further with multiplication covering multiplication games, multiplication lesson plans, multiplication worksheets, multiplication quizzes and more.

Ranking Keywords

Once keywords are identified the next step is deciding which ones to focus on. The concept leads to ranking keywords based upon the likely number of clicks to your site that could be generated from each one and the expected value of potential users obtained through these clicks. Doing this requires determining for each keyword:

  • Monthly searches
  • Competition for the keyword
  • Conversion potential
  • Effort (and possible cost) required to achieve a certain ranking

Existing tools report the monthly volume of searches for each keyword (remember to add searches on Bing to those on Google). Estimating the strength of competition requires doing a search using the keyword and learning who the top-ranking sites are currently (given the volume of keywords to analyze, this is very labor intensive). If Amazon is a top site they may be difficult to surpass but if the competition includes relatively minor players, they would be easier to outrank.

The next question to answer for each keyword is: “What is the likelihood of converting someone who is searching on the keyword if they do come to my site”. For example, for Education.com, someone searching on ‘sesame street math games’ might not convert well since they don’t have the license to use Sesame Street characters in their math games. But someone searching on ‘1st grade multiplication worksheets’ would have a high probability of converting since the company is world-class in that area. The other consideration mentioned above is the effort required to achieve a degree of success. If you already have a lot of content relevant to a keyword, then search optimizing that content for the keyword might not be very costly. But, if you currently don’t have any content that is relevant or the keyword is very broad, then a great deal more work might be required.

Example of Keyword Ranking Analysis

Source: Education.com

Comparing Effort Required to Estimated Value of Keywords

Once you have produced the first table, you can make a very educated guess on your possible ranking after about 12 months (the time it may take Google/Bing to recognize your new status for that keyword).

There are known statistics on what the likely click-through rates (share of searches against the keyword) will be if you rank 1st, 2nd, 3rd, etc. Multiplying that by the average search volume for that keyword gives a reasonable estimate of the monthly traffic that this would generate to your site. The next step is to estimate the rate at which you will convert that traffic to members (where they register so you get their email) and/or customers (I’ll assume customers for the rest of this post but the same method would apply to members). Since you already know your existing conversion rate, in general, this could be your estimate. But, if you have been buying clicks on that keyword from Google or Bing, you may already have a better estimate of conversion. Multiplying the number of customers obtained by the LTV (Life Time Value) of a customer yields the $ value generated if the keyword obtains the estimated rank. Subtract from this the current value being obtained from the keyword (based on its current ranking) to see the incremental benefit.

Content Optimization

One important step to improve rankings is to use keywords in titles of articles. While the words to use may seem intuitive, it’s important to test variations to see how each may improve results. Will “free online multiplication games” outperform “free times table games”. The way to test this is by trying each for a different 2-week (or month) time period and see which gives a higher CTR (Click Through Rate). As discussed earlier, it’s also important to optimize the body copy against keywords. Many of our companies create a guide for writing copy that provides rules that result in better CTR.

The Importance of Links

Google views links from other sites to yours as an indication of your level of authority. The more important the site linking to you, the more it impacts Google’s view. Having a larger number of sites linking to you can drive up your Domain Authority (a search engine ranking score) which in turn will benefit rankings across all keywords. However, it’s important to be restrained in acquiring links as those from “Black Hats” (sites Google regards as somewhat bogus) can actually result in getting penalized. While getting another site to link to you will typically require some motivation for them, Allison warns that paying cash for a link is likely to result in obtaining some of them from black hat sites. Instead, motivation can be your featuring an article from the other site, selling goods from a partner, etc.

Other Issues

I won’t review it here but site architecture is also a relevant factor in optimizing SEO benefits. For a product company with tens of thousands of products, it can be extremely important to have the right titles and structure in how you list products. If you have duplicative content on your site, removing it may help your rankings, even if there was a valid reason to have such duplication. Changing the wording of content on a regular basis will help you maintain rankings.

Summary

SEO requires a well-thought-out strategy and consistent, continued execution to produce results. This is not a short-term fix, as an SEO investment will likely only start to show improvements four to six months after implementation with ongoing management. But as many of our portfolio companies can attest, it’s well worth the effort.


SoundBytes

  • It’s a new basketball season so I can’t resist a few comments. First, as much as I am a fan of the Warriors, it’s pretty foolish to view them as a lock to win as winning is very tenuous. For example, in game 5 of the finals last year, had Durant missed his late game three point shot the Warriors may have been facing the threat of a repeat of the 2016 finals – going back to Cleveland for a potential tying game.
  • Now that Russell Westbrook has two star players to accompany him we can see if I am correct that he is less valuable than Curry, who has repeatedly shown the ability to elevate all teammates. This is why I believe that, despite his two MVPs, Curry is under-rated!
  • With Stitchfix filing for an IPO, we are seeing the first of several next generation fashion companies emerging. In the filing, I noted the emphasis they place on SEO as a key component of their success. I believe new fashion startups will continue to exert pressure on traditional players. One Azure company moving towards scale in this domain is Le Tote – keep an eye on them!

Will Grocery Shopping Ever be the Same?

Will grocery shopping ever be the same?

Dining and shopping today is very different than in days gone by – the Amazon acquisition of Whole Foods is a result

“I used to drink it,” said Andy Warhol once of Campbell’s soup. “I used to have the same lunch every day, for 20 years, I guess, the same thing over and over again.” In Warhol’s signature medium, silkscreen, the artist reproduced his daily Campbell’s soup can over and over again, changing only the label graphic on each one.

When I was growing up I didn’t have exactly the same thing over and over like Andy Warhol, but virtually every dinner was at home, at our kitchen table (we had no dining room in the 4-room apartment). Eating out was a rare treat and my father would have been abhorred if my mom brought in prepared food. My mom, like most women of that era, didn’t officially work, but did do the bookkeeping for my dad’s plumbing business. She would shop for food almost every day at a local grocery and wheel it home in her shopping cart.

When my wife and I were raising our kids, the kitchen remained the most important room in the house. While we tended to eat out many weekend nights, our Sunday through Thursday dinners were consumed at home, but were sprinkled with occasional meals brought in from the outside like pizza, fried chicken, ribs, and Chinese food. Now, given a high proportion of households where both parents work, eating out, fast foods and prepared foods have become a large proportion of how Americans consume dinner. This trend has reached the point where some say having a traditional kitchen may disappear as people may cease cooking at all.

In this post, I discuss the evolution of our eating habits, and how they will continue to change. Clearly, the changes that have already occurred in shopping for food and eating habits were motivations for Amazon’s acquisition of Whole Foods.

The Range of How We Dine

Dining can be broken into multiple categories and families usually participate in all of them. First, almost 60% of dinners eaten at home are still prepared there. While the percentage has diminished, it is still the largest of the 4 categories for dinners. Second, many meals are now purchased from a third party but still consumed at home. Given the rise of delivery services and greater availability of pre-cooked meals at groceries, the category spans virtually every type of food. Thirdly, many meals are purchased from a fast food chain (about 25% of Americans eat some type of fast food every day1) and about 20% of meals2 are eaten in a car. Finally, a smaller percentage of meals are consumed at a restaurant. (Sources: 1Schlosser, Eric. “Americans Are Obsessed with Fast Food: The Dark Side of the All-American Meal.” CBSNews. Accessed April 14, 2014 / 2Stanford University. “What’s for Dinner?” Multidisciplinary Teaching and Research at Stanford. Accessed April 14, 2014).

The shift to consuming food away from home has been a trend for the last 50 years as families began going from one worker to both spouses working. The proportion of spending on food consumed away from home has consistently increased from 1965-2014 – from 30% to 50%.

Source: Calculated by the Economic Research Service, USDA, from various data sets from the U.S. Census Bureau and the Bureau of Labor Statistics.

With both spouses working, the time available to prepare food was dramatically reduced. Yet, shopping in a supermarket remained largely the same except for more availability of prepared meals. Now, changes that have already begun could make eating dinner at home more convenient than eating out with a cost comparable to a fast food chain.

Why Shopping for Food Will Change Dramatically over the Next 30 Years

Eating at home can be divided between:

  1. Cooking from scratch using ingredients from general shopping
  2. Buying prepared foods from a grocery
  3. Cooking from scratch from recipes supplied with the associated ingredients (meal kits)
  4. Ordering meals that have previously been prepared and only need to be heated up
  5. Ordering meals from a restaurant that are picked up or delivered to your home
  6. Ordering “fast food” type meals like pizza, ribs, chicken, etc. for pickup or delivery.

I am starting with the assumption that many people will still want to cook some proportion of their dinners (I may be romanticizing given how I grew up and how my wife and I raised our family). But, as cooking for yourself becomes an even smaller percentage of dinners, shopping for food in the traditional way will prove inefficient. Why buy a package of saffron or thyme or a bag of onions, only to see very little of it consumed before it is no longer usable? And why start cooking a meal, after shopping at a grocery, only to find you are missing an ingredient of the recipe? Instead, why not shop by the meal instead of shopping for many items that may or may not end up being used.

Shopping by the meal is the essential value proposition offered by Blue Apron, Plated, Hello Fresh, Chef’d and others. Each sends you recipes and all the ingredients to prepare a meal. There is little food waste involved (although packaging is another story). If the meal preparation requires one onion, that is what is included, if it requires a pinch of saffron, then only a pinch is sent. When preparing one of these meals you never find yourself missing an ingredient. It takes a lot of the stress and the food waste out of the meal preparation process. But most such plans, in trying to keep the cost per meal to under $10, have very limited choices each week (all in a similar lower cost price range) and require committing to multiple meals per week. Chef’d, one of the exceptions to this, allows the user to choose individual meals or to purchase a weekly subscription. They also offer over 600 options to choose from while a service like Blue Apron asks the subscriber to select 3 out of 6 choices each week.

Blue Apron meals portioned perfectly for the amount required for the recipes

My second assumption is that the number of meals that are created from scratch in an average household will diminish each year (as it already has for the past 50 years). However, many people will want to have access to “preferred high quality” meals that can be warmed up and eaten, especially in two-worker households. This will be easier and faster (but perhaps less gratifying) than preparing a recipe provided by a food supplier (along with all the ingredients). I am talking about going beyond the pre-cooked items in your average grocery. There are currently sources of such meals arising as delivery services partner with restaurants to provide meals delivered to your doorstep. But this type of service tends to be relatively expensive on a per meal basis.

I expect new services to arise (we’ve already seen a few) that offer meals that are less expensive prepared by “home chefs” or caterers and ordered through a marketplace (this is category 4 in my list). The marketplace will recruit the chefs, supply them with packaging, take orders, deliver to the end customers, and collect the money. Since the food won’t be from a restaurant, with all the associated overhead, prices can be lower. Providing such a service will be a source of income for people who prefer to work at home. Like drivers for Uber and Lyft, there should be a large pool of available suppliers who want to work in this manner. It will be very important for the marketplaces offering such service to curate to ensure that the quality and food safety standards of the product are guaranteed. The availability of good quality, moderately priced prepared meals of one’s choice delivered to the home may begin shifting more consumption back to the home, or at a minimum, slow the shift towards eating dinners away from home.

Where will Amazon be in the Equation?

In the past, I predicted that Amazon would create physical stores, but their recent acquisition of Whole Foods goes far beyond anything I forecast by providing them with an immediate, vast network of physical grocery stores. It does make a lot of sense, as I expect omnichannel marketing to be the future of retail.  My reasoning is simple: on the one hand, online commerce will always be some minority of retail (it currently is hovering around 10% of total retail sales); on the other hand, physical retail will continue to lose share of the total market to online for years to come, and we’ll see little difference between e-commerce and physical commerce players.  To be competitive, major players will have to be both, and deliver a seamless experience to the consumer.

Acquiring Whole Foods can make Amazon the runaway leader in categories 1 and 2, buying ingredients and/or prepared foods to be delivered to your home.  Amazon Fresh already supplies many people with products that are sourced from grocery stores, whether they be general food ingredients or traditional prepared foods supplied by a grocery. They also have numerous meal kits that they offer, and we expect (and are already seeing indications) that Amazon will follow the Whole Foods acquisition by increasing its focus on “meal kits” as it attempts to dominate this rising category (3 in our table).

One could argue that Whole Foods is already a significant player in category 4 (ordering meals that are prepared, and only need to be heated up), believing that category 4 is the same as category 2 (buying prepared meals from a grocery). But it is not. What we envision in the future is the ability to have individuals (who will all be referred to as “Home Chefs” or something like that) create brands and cook foods of every genre, price, etc. Customers will be able to order a set of meals completely to their taste from a local home chef. The logical combatants to control this market will be players like Uber and Lyft, guys like Amazon and Google, existing recipe sites like Blue Apron…and new startups we’ve never heard of.

When and How to Create a Valuable Marketing Event

Azure CEO Summit
Snapshots from Azure’s 11th Annual CEO Summit

A key marketing tool for companies is to hold an event like a user’s conference or a topical forum to build relationships with their customers and partners, drive additional revenue and/or generate business development opportunities. Azure held its 11th annual CEO Summit last week, and as we’re getting great feedback on the success of the conference, I thought it might be helpful to dig deeply into what makes a conference effective. I will use the Azure event as the example but try to abstract rules and lessons to be learned, as I have been asked for my advice on this topic by other firms and companies.

Step 1. Have a clear set of objectives

For the Azure CEO Summit, our primary objectives are to help our portfolio companies connect with:

  1. Corporate and Business Development executives from relevant companies
  2. Potential investors (VCs and Family Offices)
  3. Investment banks so the companies are on the radar and can get invited to their conferences
  4. Debt providers for those that can use debt as part of their capital structure

A secondary objective of the conference is to build Azure’s brand thereby increasing our deal flow and helping existing and potential investors in Azure understand some of the value we bring to the table.

When I created a Wall Street tech conference in the late 90’s, the objectives were quite different. They still included brand building, but I also wanted our firm to own trading in tech stocks for that week, have our sell side analysts gain reputation and following, help our bankers expand their influence among public companies, and generate a profit for the firm at the same time. We didn’t charge directly for attending but monetized through attendees increasing use of our trading desk and more companies using our firm for investment banking.

When Fortune began creating conferences, their primary objective was to monetize their brand in a new way. This meant charging a hefty price for attending. If people were being asked to pay, the program had to be very strong, which they market quite effectively.

Conferences that have clear objectives, and focus the activities on those objectives, are the most successful.

Step 2. Determine invitees based on who will help achieve those objectives

For our Summit, most of the invitees are a direct fallout from the objectives listed above. If we want to help our portfolio companies connect with the above-mentioned constituencies, we need to invite both our portfolio CEOs and the right players from corporations, VCs, family offices, investment banks and debt providers. To help our brand, inviting our LPs and potential LPs is important. To insure the Summit is at the quality level needed to attract the right attendees we also target getting great speakers.  As suggested by my partners and Andrea Drager, Azure VP (and my collaborator on Soundbytes) we invited several non-Azure Canadian startups. In advance of the summit, we asked Canadian VCs to nominate candidates they thought would be interesting for us and we picked the best 6 to participate in the summit. This led to over 70 interesting companies nominated and added to our deal flow pipeline.

Step 3. Create a program that will attract target attendees to come

This is especially true in the first few years of a conference while you build its reputation. It’s important to realize that your target attendees have many conflicting pulls on their time. You won’t get them to attend just because you want them there! Driving attendance from the right people is a marketing exercise. The first step is understanding what would be attractive to them. In Azure’s case, they might not understand the benefit of meeting our portfolio companies, but they could be very attracted by the right keynotes.

Azure’s 2017 Summit Keynote Speakers: Mark Lavelle, CEO of Magento Commerce & Co-founder of Bill Me Later. Cameron Lester, Managing Director and Co-Head of Global Technology Investment Banking, Jeffries. Nagraj Kashyap, Corporate VP & Global Head, Microsoft Ventures.

Over the years we have had the heads of technology investment banking from Qatalyst, Morgan Stanley, Goldman, JP Morgan and Jeffries as one of our keynote speakers. From the corporate world, we also typically have a CEO, former CEO or chairman of notable companies like Microsoft, Veritas, Citrix, Concur and Audible as a second keynote. Added to these were CEOs of important startups like Stance and Magento and terrific technologists like the head of Microsoft Labs.

Finding the right balance of content, interaction and engagement is challenging, but it should be explicitly tied to meeting the core objectives of the conference.

Step 4. Make sure the program facilitates meeting your objectives

Since Azure’s primary objective is creating connections between our portfolio (and this year, the 6 Canadian companies) with the various other constituencies we invite, we start the day with speed dating one-on-ones of 10 minutes each. Each attendee participating in one-on-ones can be scheduled to meet up to 10 entities between 8:00AM and 9:40. Following that time, we schedule our first keynote.

In addition to participating in the one-on-ones, which start the day, 26 of our portfolio companies had speaking slots at the Summit, intermixed with three compelling keynote speakers. Company slots are scheduled between keynotes to maximize continued participation. This schedule takes us to about 5:00pm. We then invite the participants and additional VCs, lawyers and other important network connections to join us for dinner. The dinner increases everyone’s networking opportunity in a very relaxed environment.

These diverse types of interaction phases throughout the conference (one-on-ones, presentations, discussions, and networking) all facilitate a different type of connection between attendees, focused on maximizing the opportunity for our portfolio companies to build strong connections.

Azure Company Presentations
Azure Portfolio Company CEO Presentations: Chairish, Megabots & Atacama

Step 5. Market the program you create to the target attendees

I get invited to about 30 conferences each year plus another 20-30 events. It’s safe to assume that most of the invitees to the Azure conference get a similar (or greater) number of invitations. What this means is that it’s unlikely that people will attend if you send an invitation but then don’t effectively market the event (especially in the first few years). It is important to make sure every key invitee gets a personal call, email, or other message from an executive walking them through the agenda and highlighting the value to them (link to fortune could also go here). For the Azure event, we highlight the great speakers but also the value of meeting selected portfolio companies. Additionally, one of my partners or I connect with every attendee we want to do one-on-ones with portfolio companies to stress why this benefits them and to give them the chance to alter their one-on-one schedule. This year we managed over 320 such meetings.

When I created the first “Quattrone team” conference on Wall Street, we marketed it as an exclusive event to portfolio managers. While the information exchanged was all public, the portfolio managers still felt they would have an investment edge by being at a smaller event (and we knew the first year’s attendance would be relatively small) where all the important tech companies spoke and did one-on-one meetings. For user conferences, it can help to land a great speaker from one of your customers or from the industry. For example, if General Electric, Google, Microsoft or some similar important entity is a customer, getting them to speak will likely increase attendance. It also may help to have an industry guru as a speaker. If you have the budget, adding an entertainer or other star personality can also add to the attraction, as long as the core agenda is relevant to attendees.

Step 6. Decide on the metrics you will use to measure success

It is important to set targets for what you want to accomplish and then to measure whether you’ve achieved those targets. For Azure, the number of entities that attend (besides our portfolio), the number of one-on-one meetings and the number of follow-ups post the conference that emanate from one-on-one are three of the metrics we measure. One week after the conference, I already know that we had over 320 one-on-ones which, so far, has led to about 50 follow ups that we are aware of including three investments in our portfolio. We expect to learn of additional follow up meetings but this has already exceeded our targets.

Step 7. Make sure the value obtained from the conference exceeds its cost

It is easy to spend money but harder to make sure the benefit of that spend exceeds its cost. On one end of the spectrum, some conferences have profits as one of the objectives. But in many cases, the determination of success is not based on profits, but rather on meeting objectives at a reasonable cost. I’ve already discussed Azure’s objectives but most of you are not VCs. For those of you dealing with customers, your objectives can include:

  1. Signing new customers
  2. Reducing churn of existing customers
  3. Developing a better understanding of how to evolve your product
  4. Strong press pickup / PR opportunity

Spending money on a conference should always be compared to other uses of those marketing dollars. To the degree you can be efficient in managing it, the conference can become a solid way to utilize marketing dollars. Some of the things we do for the Azure conference to control cost which may apply to you include:

  1. Partnering with a technology company to host our conference instead of holding it at a hotel. This only works if there is value to your partner. Cost savings is about 60-70%.
  2. Making sure our keynotes are very relevant but are at no cost. You can succeed at this with keynotes from your customers and/or the industry. Cost savings is whatever you might have paid someone.
  3. Having the dinner for 150 people at my house. This has two benefits: it is a much better experience for those attending and the cost is about 70% less than having it at a venue.

Summary

I have focused on using the Azure CEO Summit as the primary example but the rules laid out apply in general. They not only will help you create a successful conference but following them means only holding it if its value to you exceeds its cost.


SoundBytes

The warriors…

Last June I wrote about why Kevin Durant should join the Warriors

If you look at that post, you’ll see that my logic appears to have been born out, as my main reason was that Durant was likely to win a championship and this would be very instrumental in helping his reputation/legacy.

Not mentioned in that post was the fact that he would also increase his enjoyment of playing, because playing with Curry, Thompson, Green and the rest of the Warriors is optimizing how the game should be played

Now it’s up to both Durant and Curry to agree to less than cap salaries so the core of the team can be kept intact for many years. If they do, and win multiple championships, they’ll probably increase endorsement revenue. But even without that offset my question is “How much is enough?” I believe one can survive nicely on $30-$32 million a year (Why not both agree to identical deals for 4 years, not two?). Trying for the maximum is an illusion that can be self-defeating. The difference will have zero impact on their lives, but will keep players like Iguodala and Livingston with the Warriors, which could have a very positive impact. I’m hoping they can also keep West, Pachulia and McGee as well.

It would also be nice if Durant and Curry got Thompson and Green to provide a handshake agreement that they would follow the Durant/Curry lead on this and sign for the same amount per year when their contracts came up. Or, if Thompson and Green can extend now, to do the extension at equal pay to what Curry and Durant make in the extension years. By having all four at the same salary at the end of the period, the Warriors would be making a powerful statement of how they feel about each other.

Amazon & Whole Foods…

Amazon’s announced acquisition of Whole Foods is very interesting. In a previous post, we predicted that Amazon would open physical stores. Our reasoning was that over 90% of retail revenue still occurs offline and Amazon would want to attack that. I had expected these to be Guide Stores (not carrying inventory but having samples of products). Clearly this acquisition shows that, at least in food, Amazon wants to go even further. I will discuss this in more detail in a future post.

The Business of Theater

Earnest Shackleton

I have become quite interested in analyzing theater, in particular, Broadway and Off-Broadway shows for two reasons:

  1. I’m struck by the fact that revenue for the show Hamilton is shaping up like a Unicorn tech company
  2. My son Matthew is producing a show that is now launching at a NYC theater, and as I have been able to closely observe the 10-year process of it getting to New York, I see many attributes that are consistent with a startup in tech.

Incubation

It is fitting that Matthew’s show, Ernest Shackleton Loves Me, was first incubated at Theatreworks, San Francisco, as it is the primary theater of Silicon Valley. Each year the company hosts a “writer’s retreat” to help incubate new shows. Teams go there for a week to work on the shows, all expenses paid. Theatreworks supplies actors, musicians, and support so the creators can see how songs and scenes seem to work (or not) when performed. Show creators exchange ideas much like what happens at a tech incubator. At the culmination of the week, a part of each show is performed before a live audience to get feedback.

Creation of the Beta Version

After attending the writer’s retreat the creators of Shackleton needed to do two things: find a producer (like a VC, a Producer is a backer of the show that recruits others to help finance the project); and add other key players to the team – a book writer, director, actors, etc. Recruiting strong players for each of these positions doesn’t guarantee success but certainly increases the probability. In the case of Shackleton, Matthew came on as lead producer and he and the team did quite well in getting a Tony winning book writer, an Obie winning director and very successful actors on board. Once this team was together an early (beta version) of the show was created and it was performed to an audience of potential investors (the pitch). Early investors in the show are like angel investors as risk is higher at this point.

Beta Testing

The next step was to run a beta test of the product – called the “out of town tryout”. In general, out of town is anyplace other than New York City. It is used to do continuous improvement of the show much like beta testing is used to iterate a technology product based on user feedback. Theater critics also review shows in each city where they are performed. Ernest Shackleton Loves Me (Shackleton) had three runs outside of NYC: Seattle, New Jersey and Boston. During each, the show was improved based on audience and critic reaction. While it received rave reviews in each location, critics and the live audience can be helpful as they usually still can suggest ways that a show can be improved. Responding to that feedback helps prepare a show for a New York run.

Completing the Funding

Like a tech startup, it becomes easier to raise money in theater once the product is complete. In theater, a great deal of funding is required for the steps mentioned above, but it is difficult to obtain the bulk of funding to bring a show to New York for most shows without having actual performances. An average musical that goes to Off-Broadway will require $1.0 – $2.0 million in capitalization. And an average one that goes to Broadway tends to capitalize between $8 – $17 million. Hamilton cost roughly $12.5 million to produce, while Shackleton will capitalize at the lower end of the Off-Broadway range due to having a small cast and relatively efficient management. For many shows the completion of funding goes through the early days of the NYC run. It is not unusual for a show to announce it will open at a certain theater on a certain date and then be unable to raise the incremental money needed to do so. Like a tech startup, some shows, like Shackleton, may run a crowdfunding campaign to help top off its funding.

You can see what a campaign for a theater production looks like by clicking on this link and perhaps support the arts, or by buying tickets on the website (since the producer is my son, I had to include that small ask)!

The Product Launch

Assuming funding is sufficient and a theater has been secured (there currently is a shortage of Broadway theaters), the New York run then begins.  This is the true “product launch”. Part of a shows capitalization may be needed to fund a shortfall in revenue versus weekly cost during the first few weeks of the show as reviews plus word of mouth are often needed to help drive revenue above weekly break-even. Part of the reason so many Broadway shows employ famous Hollywood stars or are revivals of shows that had prior success and/or are based on a movie, TV show, or other well-known property is to insure substantial initial audiences. Some examples of this currently on Broadway are Hamilton (bestselling book), Aladdin (movie), Beautiful (Carole King story), Chicago (revival of successful show), Groundhog Day (movie), Hello Dolly (revival plus Bette Midler as star) and Sunset Boulevard (revival plus Glenn Close as star).

Crossing Weekly Break Even

Gross weekly burn for shows have a wide range (just like startups), with Broadway musicals having weekly costs from $500,000 to about $800,000 and Off-Broadway musicals in the $50,000 to $200,000 range. In addition, there are royalties of roughly 10% of revenue that go to a variety of players like the composer, book writer, etc. Hamilton has about $650,000 in weekly cost and roughly a $740,000 breakeven level when royalties are factored in.  Shackleton weekly costs are about $53,000, at the low end of the range for an off-Broadway musical, at under 10% of Hamilton’s weekly cost.

Is Hamilton the Facebook of Broadway?

Successful Broadway shows have multiple sources of revenue and can return significant multiples to investors.

Chart 1: A ‘Hits’ Business Example Capital Account

Since Shackleton just had its first performance on April 14, it’s too early to predict what the profit (or loss) picture will be for investors. On the other hand, Hamilton already has a track record that can be analyzed. In its first months on Broadway the show was grossing about $2 million per week which I estimate drove about $ 1 million per week in profits. Financial investors, like preferred shareholders of a startup, are entitled to the equivalent of “liquidation preferences”. This meant that investors recouped their money in a very short period, perhaps as little as 13 weeks. Once they recouped 110%, the producer began splitting profits with financial investors. This reduced the financial investors to roughly 42% of profits. In the early days of the Hamilton run, scalpers were reselling tickets at enormous profits. When my wife and I went to see the show in New York (March 2016) we paid $165 per ticket for great orchestra seats which we could have resold for $2500 per seat! Instead, we went and enjoyed the show. But if a scalper owned those tickets they could have made 15 times their money. Subsequently, the company decided to capture a portion of this revenue by adjusting seat prices for the better seats and as a result the show now grosses nearly $3 million per week. Since fixed weekly costs probably did not change, I estimate weekly profits are now about $1.8 million. At 42% of this, investors would be accruing roughly $750,000 per week. At this run rate, investors would receive over 3X their investment dollars annually from this revenue source alone if prices held up.

Multiple Companies Amplify Revenue and Profits

Currently Hamilton has a second permanent show in Chicago, a national touring company in San Francisco (until August when it’s supposed to move to LA) and has announced a second touring company that will begin the tour in Seattle in early 2018 before moving to Las Vegas and Cleveland and other stops. I believe it will also have a fifth company in London and a sixth in Asia by late 2018 or early 2019. Surprisingly, the touring companies can, in some cities, generate more weekly revenue than the Broadway company due to larger venues. Table 1 shows an estimate of the revenue per performance in the sold out San Francisco venue, the Orpheum Theater which has a capacity 2203 versus the Broadway capacity (Richard Rogers Theater) of 1319.

Table 1: Hamilton San Francisco Revenue Estimates

While one would expect Broadway prices to be higher, this has not been the case. I estimate the average ticket price in San Francisco to be $339 whereas the average on Broadway is now $282. The combination of 67% higher seating capacity and 20% higher average ticket prices means the revenue per week in San Francisco is now close to $6 million. Since it was lower in the first 4 weeks of the 21 plus week run, I estimate the total revenue for the run to be about $120 million. Given the explosive revenue, I wouldn’t be surprised if the run in San Francisco was extended again. While it has not been disclosed what share of this revenue goes to the production company, normally the production company is compensated as a base guarantee level plus a share of the profits (overage) after the venue covers its labor and marketing costs. Given these high weekly grosses, I assume the production company’s share is close to 50% of the grosses given the enormous profits versus an average show at the San Francisco venue (this would include both guarantee and overage). At 50% of revenue, there would still be almost $3 million per week to go towards paying the production company expenses (guarantee) and the local theater’s labor and marketing costs. If I use a lower $2 million of company share per week as profits to the production company that annualizes at over $100 million in additional profits or $42 million more per year for financial investors. The Chicago company is generating lower revenue than in San Francisco as the theater is smaller (1800 seats) and average ticket prices appear to be closer to $200. This would make revenue roughly $2.8 million per week. When the show ramps to 6 companies (I think by early 2019) the show could be generating aggregate revenue of $18-20 million per week or more should demand hold up. So, it would not be surprising if annual ticket revenue exceeded $1 billion per year at that time.

Merchandise adds to the mix

I’m not sure what amount of income each item of merchandise generates to the production company. Items like the cast album and music downloads could generate over $25 million in revenue, but in general only 40% of the net income from this comes to the company. On the other hand, T-shirts ($50 each) and the high-end program ($20 each) have extremely large margin which I think would accrue to the production company. If an average attendee of the show across the 6 (future) or more production companies spent $15 this could mean $1.2 million in merchandise sales per week across the 6 companies or another $60 million per year in revenue. At 60% gross margin this would add another $36 million in profits.

I expect Total Revenue for Hamilton to exceed $10 billion

In addition to the sources of revenue outlined above Hamilton will also have the opportunity for licensing to schools and others to perform the show, a movie, additional touring companies and more.  It seems likely to easily surpass the $6 billion that Lion King and Phantom are reported to have grossed to date, or the $4 billion so far for Wicked. In fact, I believe it eventually will gross over a $10 billion total. How this gets divided between the various players is more difficult to fully access but investors appear likely to receive over 100x their investment, Lin-Manuel Miranda could net as much as $ 1 billion (before taxes) and many other participants should become millionaires.

Surprisingly Hamilton may not generate the Highest Multiple for Theater Investors!

Believe it or not, a very modest musical with 2 actors appears to be the winner as far as return on investment. It is The Fantasticks which because of its low budget and excellent financial performance sustained over decades is now over a 250X return on invested capital. Obviously, my son, an optimistic entrepreneur, hopes his 2 actor musical, Ernest Shackleton Loves Me, will match this record.

Lessons Learned from Anti-Consumer Practices/Technologies in Tech and eCommerce

One example of the anti-consumer practices by airline loyalty programs.

As more and more of our life consists of interacting with technology, it is easier and easier to have our time on an iPhone, computer or game device become all consuming. The good news is that it is so easy for each of us to interact with colleagues, friends and relatives; to shop from anywhere; to access transportation on demand; and to find information on just about anything anytime. The bad news is that anyone can interact with us: marketers can more easily bombard us, scammers can find new and better ways to defraud us, and identity thieves can access our financials and more. When friends email us or post something on Facebook, there is an expectation that we will respond.  This leads to one of the less obvious negatives: marketers and friends may not consider whether what they send is relevant to us and can make us inefficient.

In this post, I want to focus on lessons entrepreneurs can learn from products and technologies that many of us use regularly but that have glaring inefficiencies in their design, or those that employ business practices that are anti-consumer. One of the overriding themes is that companies should try to adjust to each consumer’s preferences rather than force customers to do unwanted things. Some of our examples may sound like minor quibbles but customers have such high expectations that even small offenses can result in lost customers.

Lesson 1: Getting email marketing right

Frequency of email 

The question: “How often should I be emailing existing and prospective customers?” has an easy answer. It is: “As often as they want you to.”  If you email them too frequently the recipients may be turned off. If you send too few, you may be leaving money on the table. Today’s email marketing is still in a rudimentary stage but there are many products that will automatically adjust the frequency of emails based on open rates. Every company should use these. I have several companies that send me too many emails and I have either opted out of receiving them or only open them on rare occasions. In either case the marketer has not optimized their sales opportunity.

Relevance of email

Given the amount of data that companies have on each of us one would think that emails would be highly personalized around a customer’s preferences and product applicability. One thing to realize is that part of product applicability is understanding frequency of purchase of certain products and not sending a marketing email too soon for a product that your customer would be unlikely to be ready to buy. One Azure portfolio company, Filter Easy, offers a service for providing air filters. Filter Easy gives each customer a recommended replacement time from the manufacturer of their air conditioner. They then let the customer decide replacement frequency and the company only attempts to sell units based on this time table. Because of this attention to detail, Filter Easy has one of the lowest customer churn rates of any B to C company. In contrast to this, I receive marketing emails from the company I purchase my running shoes from within a week of buying new ones even though they should know my replacement cycle is about every 6 months unless there is a good sale (where I may buy ahead). I rarely open their emails now, but would open more and be a candidate for other products from them if they sent me fewer emails and thought more about which of their products was most relevant to me given what I buy and my purchase frequency. Even the vaunted Amazon has sent me emails to purchase a new Kindle within a week or so of my buying one, when the replacement cycle of a Kindle is about 3 years.

In an idea world, each customer or potential customer would receive emails uniquely crafted for them. An offer to a customer would be ranked by likely value based on the customer profile and item profile. For example, customers who only buy when items are on sale should be profiled that way and only sent emails when there is a sale. Open Road, another Azure company, has created a daily email of deeply discounted e-books and gets a very high open rate due to the relevance of their emails (but cuts frequency for subscribers whose open rates start declining).

Lesson 2: Learning from Best Practices of Others

I find it surprising when a company launches a new version of a software application without attempting to incorporate best practices of existing products. Remember Lotus 123? They refused to create a Windows version of their spreadsheet for a few years and instead developed one for OS/2 despite seeing Excel’s considerable functionality and ease of use sparking rapid adoption. By the time they created a Windows version, it was too late and they eventually saw their market share erode from a dominant position to a minimal level.  In more modern times, Apple helped Blackberry survive well past it’s expected funeral by failing to incorporate many of Blackberry’s strong email features into the iPhone. Even today, after many updates to mail, Apple still is missing such simple features like being able to hit a “B” to go to the bottom of my email stack on the iPhone. Instead, one needs to scroll down through hundreds of emails to get to the bottom if you want to process older emails first. This wastes lots of time. But Microsoft Outlook in some ways is even worse as it has failed to incorporate lookup technology from Blackberry (and now from Apple) that always allows finding an email address from a person’s name. When one has not received a recent email from a person in your contact list, and the person’s email address is not their name, outlook requires an exact email address. When this happens, I wind up looking it the person’s contact information on my phone!

Best practices extends beyond software products to marketing, packaging, upselling and more. For example, every ecommerce company should study Apple packaging to understand how a best in class branding company packages its products. Companies also have learned that in many cases they need to replicate Amazon by providing free shipping.

Lesson 3: The Customer is Usually Right

Make sure customer loyalty programs are positive for customers but affordable for the company

With few exceptions, companies should adopt a philosophy that is very customer-centric. Failing to do so has negative consequences. For example, the airline industry has moved towards giving customers little consideration and this results in many customers no longer having a preferred airline, instead looking for best price and/or most convenient scheduling. Whereas the mileage programs from airlines were once a very attractive way of retaining customers, the value of miles has eroded to such a degree that travelers have lost much of the benefit. This may have been necessary for the airlines as the liability associated with outstanding points reached billions of dollars. But, in addition, airlines began using points as a profit center by selling miles to credit cards at 1.5 cents per mile. Then, to make this a profitable sale, moved average redemption value to what I estimate to be about 1 cent per point. This leads to a concern of mine for consumers. Airlines are selling points at Kiosks and online for 3 cents per point, in effect charging 3 times their cash redemption value.

The lesson here is that if you decide to initiate a loyalty points program, make sure the benefits to the customer increase retention, driving additional revenue. But also make sure that the cost of the program does not exceed the additional revenue. (This may not have been the case for airlines when their mileage points were worth 3-4 cents per mile).  It is important to recognize the future cost associated with loyalty points at the time they are given out (based on their exchange value) as this lowers the gross margin of the transaction. We know of a company that failed to understand that the value of points awarded for a transaction so severely reduced the associated gross margin that it was nearly impossible for them to be profitable.

Make sure that customer service is very customer centric

During the Thanksgiving weekend I was buying a gift online and found that Best Buy had what I was looking for on sale. I filled out all the information to purchase the item, but when I went to the last step in the process, my order didn’t seem to be confirmed. I repeated the process and again had the same experience. So, I waited a few days to try again, but by then the sale was no longer valid. My assistant engaged in a chat session with their customer service to try to get them to honor the sale price, and this was refused (we think she was dealing with a bot but we’re not positive). After multiple chats, she was told that I could try going to one of their physical stores to see if they had it on sale (extremely unlikely). Instead I went to Amazon and bought a similar product at full price and decided to never buy from Best Buy’s online store again. I know from experience that Amazon would not behave that way and Azure tries to make sure none of our portfolio companies would either. Turning down what would still have been a profitable transaction and in the process losing a customer is not a formula for success! While there may be some lost revenue in satisfying a reasonable customer request the long term consequence of failing to do so usually will far outweigh this cost.


Soundbytes

My friend, Adam Lashinsky, from Fortune has just reported that an insurance company is now offering lower rates for drivers of Teslas who deploy Autopilot driver-assistance. Recall that Tesla was one of our stock picks for 2017 and this only reinforces our belief that the stock will continue to outperform.


They got it right: Why Stephen Curry deserves to be a First Team All-Star

Curry vs. Westbrook

Much has been written about the fact that Russell Westbrook was not chosen for the first team on the Western All-Stars. The implication appears to be that he was more deserving than Curry. I believe that Westbrook is one of the greatest athletes to play the game and one of the better players currently in the league. Yet, I also feel strongly that so much weight is being placed on his triple doubles that he is being unfairly anointed as the more deserving player. This post takes a deeper dive into the available data and, I believe, shows that Curry has a greater impact on winning games and is deserving of the first team honor. So, as is my want to analyze everything, I spent some time dissecting the comparison between the two.  It is tricky comparing the greatest shooter to ever play the game to one of the greatest athletes to ever play, but I’ll attempt it, statistic by statistic.


Rebounding

Westbrook is probably the best rebounding guard of all time (with Oscar Robertson and Magic Johnson close behind). This season he is averaging 10.4 rebounds per game while Curry is at 4.3. There is no question that Westbrook wins hands down in this comparison with Curry, who is a reasonably good rebounding point guard.  But on rebounds per 36 minutes played this season, Westbrook’s stats are even better than Oscar’s in his best year. In that year, Robertson averaged 12.5 rebounds playing over 44 minutes a game which equates to 10.2 per 36 minutes vs Westbrook’s 10.8 per 36 minutes (Magic never averaged 10 rebounds per game for a season).


Assists

You may be surprised when I say that Curry is a better assist producer than Westbrook this season. How can this be when Westbrook averages 10.3 assists per game and Curry only 6.2?  Since Oklahoma City plays a very different style of offense than the Warriors, Westbrook has the ball in his hands a much larger percentage of the time. They both usually bring the ball up the court but once over half court, the difference is striking. Curry tends to pass it off a high proportion of the time while Westbrook holds onto it far longer. Because of the way Curry plays, he leads the league in secondary assists (passes that set up another player to make an assist) at 2.3 per game while Westbrook is 35th in the league at 1.1 per game. The longer one holds the ball the more likely they will shoot it, commit a turnover or have an assist and the less likely they will get a secondary assist. The reason is that if they keep the ball until the 24 second clock has nearly run out before passing, the person they pass it to needs to shoot (even if the shot is a poor one) rather than try to set up someone else who has an easier shot. For example, if a player always had the ball for the first 20 seconds of the 24 second clock, they would likely have all assists for the team while on the court.

Table 1: Assist Statistic Comparison

Curry vs. Westbrook Assists
*NBA.com statistics average per game through Feb 1st, 2017

When in the game, Westbrook holds the ball about 50% of the time his team is on offense, he gets a large proportion of the team’s assists. But that style of play also means that the team winds up with fewer assists in total. In fact, while the Warriors rank #1 in assists as a team by a huge margin at 31.1 per game (Houston is second at 25.6), Oklahoma City is 20th in the league at 21.2 per game. If you agree that the opportunity to get an assist increases with the number of minutes the ball is in the player’s possession, then an interesting statistic is the number of assists per minute that a player possesses the ball (see Table 1). If we compare the two players from that perspective, we see that Curry has 1.27 assists per minute and Westbrook 1.17. Curry also has 0.47 secondary assists per minute while Westbrook only 0.13. This brings the total primary and secondary assist comparison to 1.74 per minute of possession for Curry and 1.30 for Westbrook, a fairly substantial difference. It also helps understand why the Warriors average so many more assists per game than Oklahoma City and get many more easy baskets. This leads to them having the highest field goal percentage in the league, 50.1%.


Shooting

Russell Westbrook leads the league in scoring, yet his scoring is less valuable to his team than Stephen Curry’s is to the Warriors. This sounds counterintuitive but it is related to the shooting efficiency of the player: Curry is extremely efficient and Westbrook is inefficient as a shooter. To help understand the significance of this I’ll use an extreme example. Suppose the worst shooter on a team took every one of a team’s 80 shots in a game and made 30% of them including two 3-point shots. He would score 24 baskets and lead the league in scoring by a mile at over 50 points per game (assuming he also got a few foul shots). However, his team would only average 50 or so points per game and likely would lose every one of them. If, instead, he took 20 of the 80 shots and players who were 50% shooters had the opportunity to take the other 60, the team’s field goals would increase from 24 to 36. Westbrook’s case is not the extreme of our example but none-the-less Westbrook has the lowest efficiency of the 7 people on his team who play the most minutes. So, I believe his team overall would score more points if other players had more shooting opportunities. Let’s look at the numbers.

Table 2: Shot Statistic Comparison

shots-table
*NBA.com statistics average per game through Feb 1st, 2017

Westbrook’s shooting percentage of 42.0% is lower than the worst shooting team in the league, Memphis at 43.2%, and, as mentioned is the lowest of the 7 people on his team that play the most minutes. Curry has a 5.5% higher percentage than Westbrook. But the difference in their effectiveness is even greater as Curry makes far more three point shots. Effective shooting percentage adjusts for 3 point shots made by considering them equal to 1½ two point shots. Curry’s effective shooting percentage is 59.1% and Westbrook’s is 46.4%, an extraordinary difference. However, Westbrook gets to the foul line more often and “true shooting percent” takes that into account by assuming about 2.3 foul shots have replaced one field goal attempt (2.3 is used rather than 2.0 to account for 3 point plays and being fouled on a 3-point shot). Using the “true shooting percentage” brings Westbrook’s efficiency slightly closer to Curry’s, but it is still nearly 10% below Curry (see table 2). What this means is very simple – if Curry took as many shots as Westbrook he would score far more. In fact, at his efficiency level he would average 36.1 points per game versus Westbrook’s 30.7. While it is difficult to prove this, I believe if Westbrook reduced his number of shots Oklahoma City would score more points, as other players on his team, with a higher shooting percentage, would have the opportunity to shoot more. And he might be able to boost his efficiency as a shooter by eliminating some ill-advised shots.


Turnovers vs Steals

This comparison determines how many net possessions a player loses for his team by committing more turnovers than he has steals. Stephen Curry averages 2.9 turnovers and 1.7 steals per game, resulting in a net loss of 1.2 possessions per game. Russell Westbrook commits about 5.5 turnovers per game and has an average of 1.6 steals, resulting in a net loss of 3.9 possessions per game, over 3 times the amount for Curry.


Plus/Minus

In many ways, this statistic is the most important one as it measures how much more a player’s team scores than its opponents when that player is on the floor. However, the number is impacted by who else is on your team so the quality of your teammates clearly will contribute.  Nonetheless, the total impact Curry has on a game through high effective shooting percent and assists/minute with the ball is certainly reflected in the average point differential for his team when he is on the floor. Curry leads the league in plus/minus for the season as his team averages 14.5 more points than its opponents per 36 minutes he plays.  Westbrook’s total for the season is 41st in the league and his team averages +3.4 points per 36 minutes.


Summing Up

While Russell Westbrook is certainly a worthy all-star, I believe that Stephen Curry deserves having been voted a starter (as does James Harden but I don’t think Harden’s selection has been questioned). Westbrook stands out as a great rebounding guard, but other aspects of his amazing triple double run are less remarkable when compared to Curry. Curry is a far more efficient scorer and any impartial analysis shows that he would average more points than Westbrook if he took the same number of shots. At the same time, Curry makes his teammates better by forcing opponents to space the floor, helping create more open shots for Durant, Thompson and others. He deserves some of the credit for Durant becoming a more efficient scorer this year than any time in his career. While Westbrook records a far larger number of assists per game than Curry, Curry is a more effective assist creator for the time he has the ball, helping the Warriors flirt with the 32-year-old record for team assists per game while Oklahoma City ranks 20th of the 30 current NBA teams with 10 less assists per game than the Warriors.

Top 10 Predictions for 2017

Conceptualization of giant robot fight.

When I was on Wall Street I became very boring by having the same three strong buy recommendations for many years until I downgraded Compaq in 1998 (it was about 30X the original price at that point). The other two, Microsoft and Dell, remained strong recommendations until I left in 2000. At the time, they were each well over 100X the price of my original recommendation. I mention this because my favorite stocks for this blog include Facebook and Tesla for the 4th year in a row. They are both over 5X what I paid for them in 2013 (23 and 45, respectively) and I continue to own both. Will they get to 100X or more? This is not likely, as companies like them have had much higher valuations when going public compared with Microsoft or Dell, but I believe they continue to offer strong upside, as explained below.

In each of my stock picks, I’m expecting the stocks to outperform the market. I don’t have a forecast of how the market will perform, so in a steeply declining market, out-performance might occur with the stock itself being down (but less than the market). Given the recent rise in the market subsequent to the election of Donald Trump, on top of several years of a substantial bull market, this risk is real. While I have had solid success at predicting certain individual stocks’ performance, I do not pride myself in being able to predict the market itself. So, consider yourself forewarned regarding potential market volatility.

This top ten is unusual in having three picks that are negative forecasts as last year there were no negatives and in 2015 only one.

We’ll start with the stock picks (with prices of stocks valid as of writing this post, January 10, all higher than the beginning of the year) and then move on to the remainder of my 10 predictions.

  1. Tesla stock appreciation will continue to outpace the market (it is currently at $229/share). Tesla expected to ship 50,000 vehicles in the second half of 2016 and Q3 revenue came in at $2.3 billion. This equates to 100,000 vehicles and a $9.2 billion annualized run rate. The model 3 has over 400,000 units on back order and Tesla is ramping capacity to produce 500,000 vehicles in total in 2018. If the company stays on track, from a production point of view, this amounts to 5X the vehicle unit sales rate and about 3X the revenue run rate. While the model 3 is unlikely to have the same gross margins as the current products, tripling revenue should still lead to substantially more than tripling profits. Tesla remains the clear leader in electric vehicles and fully integrated automated features in an automobile. While others are looking towards 2020/2021 to deliver automated cars, Tesla is already delivering most of the functionality required. Between now and 2020 Tesla is likely to install numerous improvements and should remain the leader. Tesla also continues to have the strongest business model as it sells directly to the consumer, eliminating dealers. I also believe that the Solar City acquisition will prove more favorable than anticipated. Given these factors, I expect Tesla stock to have solid outperformance in 2017. The biggest risk is product delay and/or delivering a faulty product, but competitors are trailing by quite a bit so there is some headroom if this happens.

2. Facebook stock appreciation will continue to outpace the market (it is currently at $123/share). While the core Facebook user base growth has slowed considerably, Facebook has a product portfolio that also includes Instagram, WhatsApp and Oculus. This gives Facebook multiple opportunities for revenue growth: Improve the revenue per DAU (daily active user) on Facebook itself; begin to monetize Instagram and WhatsApp in more meaningful ways; and build the install base of Oculus. We have seen Facebook advertising rates increase steadily as more and more mainstream companies shift budget from traditional advertising to Facebook. This, combined with modest growth in DAUs, should lead to continued strong revenue growth from the Facebook platform itself. The opportunity to increase monetization on its other platforms should become more real during 2017, providing Facebook with additional revenue streams. And while the Oculus did not get out of the gate as fast as expected, it is still viewed as the premier product in VR. We believe the company will need to produce a lower priced version to drive sales into the millions of units annually. The wild card here is the “killer app”; if a product becomes a must have and is only available on the Oculus, sales would jump substantially in a short time.

3. Amazon stock appreciation will outpace the market (it is currently at $795/share). I had Amazon as a recommended stock in 2015 but omitted it in 2016 after the stock appreciated 137% in 2015 while revenue grew less than 20%. That meant my 2015 recommendation worked extremely well. But while I still believed in Amazon fundamentals at the beginning of 2016, I felt the stock might have reached a level that needed to be absorbed for a year or so. In fact, 2016 Amazon fundamentals continued to be quite strong with revenue growth accelerating to 26% (to get to this number, I assumed it would have its usual seasonally strong Q4). At the same time, the stock was only up 10% for the year. While it has already appreciated a bit since year end, it seems to be more fairly valued than a year ago, and I am putting it back on our recommended list as we expect it to continue to gain share in retail, have continued success with its cloud offering (strong growth and increased margin), leverage their best in class AI and voice recognition with Echo (see pick 10), and add more physical outlets that drive increased adoption.

4. Both Online and Offline Retailers will increasingly use an Omnichannel Approach. The line between online and offline retailers will become blurred over the next five years. But despite the continued increase in online’s share of the total, physical stores will be the majority of sales for many years. This means that many online retailers will decide to have some form of physical outlets. The most common will be “guide stores” like those from Warby Parker, Bonobos and Tesla where samples of product are in the store but the order is still placed online for subsequent delivery. We believe Amazon may begin to create several such physical locations over the next year or two. I expect brick and mortar retailers to up their game online as they struggle to maintain share. But currently, they continue to struggle to optimize their online presence, so much so that Walmart paid what I believe to be an extremely overpriced valuation for Jet to access better technology and skills. Others may follow suit. One retailer that appears to have done a reasonable job online is William Sonoma.

5. A giant piloted robot will be demo’d as the next form of Entertainment. Since the company producing it, MegaBots, is an Azure portfolio company, this is one of my easier predictions, assuming good execution. The robot will be 16 feet high, weigh 20,000 pounds and be able to lift a car in one hand (a link to the proto-type was in my last post). It will be able to shoot a paint ball at a speed that pierces armor. If all goes well, we will also be able to experience the first combat between two such robots in 2017. Actual giant robots as a new form of entertainment will emerge as a new category over the next few years.

6. Virtual and Augmented reality products will escalate. If 2016 was the big launch year for VR (with every major platform launching), 2017 will be the year where these platforms are more broadly evaluated by millions of consumers. The race to supplement them with a plethora of software applications, follow on devices, VR enabled laptops and 360 degree cameras will escalate the number of VR enabled products on the market. For every high-tech, expensive VR technology platform release, there will be a handful of apps that will expand VR’s reach outside of gaming (and into viewing homes, room design, travel, education etc.), allowing anyone with simple VR glasses connected to a smartphone to experience VR in a variety of settings.  For AR, we see 2017 as the year where AR applicability to retail, healthcare, agriculture and manufacturing will start to be tested, and initial use cases will emerge.

7. Magic Leap will disappoint in 2017. Magic Leap has been one of the “aha” stories in technology for the past few years as it promised to build its technology into a pair of glasses that will create virtual objects and blend them with the real world. At the Fortune Brainstorm conference in 2016, I heard CEO Rony Abovitz speak about the technology. I was struck by the fact that there was no demo shown despite the fact that the company had raised about $1.4 billion starting in early 2014 (with a last post-money at $4.5 billion). The problem for this company is that while it may have been conceptually ahead in 2014, others, like Microsoft, now appear further along and it remains unclear when Magic Leap will actually deliver a marketable product.

8. Cable companies will see slide in adoption. Despite many thinking to the contrary, the number of US cable subscribers has barely changed over the past two years, going down from 49.9 million in Q2 2014 to 48.9 million in Q2 2016 (a 2% loss). During the same period, Broadband services subscribers (video on demand for Netflix, Hulu and others) increased about 12% to 57.0 million. Given the extremely high price of cable, more people (especially millennials) are shifting to paying for what they want at considerably less cost so that the rate of erosion of the subscriber base should continue and may even accelerate over the next few years. I expect to see further erosion of traditional TV usage as well, despite the fact that overall media usage per day is rising. The reason for lower TV usage is the shift people are making to consuming media on their smart phones. This shift is much broader than millennials as every age group is increasing their media consumption through their phones.

9. Spotify will either postpone its IPO or have a disappointing one. In theory, valuation of a company should be calculated based on future earnings flows. The problem for evaluating companies that are losing money is that we can only use proxies for such flows and often wind up using them to determine a multiple of revenue that appears appropriate. To do this I first consider gross margin, cost of customer acquisition and operating cost to determine a “theoretic potential operating profit percentage” that a company can reach when it matures. I believe the higher this is, the higher the multiple and similarly the higher the revenue growth rate, the higher the multiple. When I look at Spotify numbers for 2015 (2016 financials won’t be released for several months) it strikes me (and many others) that this is a difficult business to make profitable as gross margins were a thin 16% based on hosting and royalty cost. Sales and marketing (both of which are variable costs that ramp with revenue) was an additional 12.6% leaving only 3.4% before G&A and R&D (which in 2015 were over 13% of revenue). This combination has meant that scaling revenue has not improved earnings. In fact, the 80% increase in revenue over the prior year still led to higher dollars in operating loss (about 9.5% of revenue). Unless the record labels agree to lower royalties substantially (which seems unlikely) its appears that even strong growth would not result in positive operating margins. If I give them the benefit of the doubt and assume they somehow get to 2% positive operating margin, the company’s value ($8 billion post) would still be over 175X this percent of 2015 revenue. If Spotify grew another 50% in 2016, the same calculation would bring the multiple of theoretical 2016 operating margin to about 120X. I believe it will be tough for them to get an IPO valuation as high as their last post if they went public in Q2 of this year as has been rumored.

10. Amazon’s Echo will gain considerable traction in 2017. The Echo is Amazon’s voice-enabled device that has built-in artificial intelligence and voice recognition. It has a variety of functions like controlling smart devices, answering questions, telling jokes, playing music through Sonos and other smart devices and more. Essentially an app for it is called a “skill”. There are now over 3,000 of these apps and this is growing at a rapid rate. In the first 12 months of sales, a consulting firm, Activate, estimated that about 4.4 million were sold. If we assume an average price of about $150, this would amount to over $650 million to Amazon. The chart below shows the adoption curve for five popular devices launched in the past. Year 1 unit sales for each is set at 1.0 and subsequent years show the multiple of year 1 volume that occurred in that year. As can be seen from the chart, the second year ranged from 2x to over 8X the first year’s volume and in the third year every one of them was at least 5 times the first year’s volume. Should the Echo continue to ramp in a similar way to these devices, its unit sales could increase by 2-3X in 2017 placing the device sales at $1.5-2.0 billion. But the device itself is only one part of the equation for Amazon as the Echo also facilitates ordering products, and while skills are free today, some future skills could entail payments with Amazon taking a cut.

graph-image

Re-cap of 2016 Predictions

fridge-image
Samsung FamilyHub Fridge: manage groceries, family scheduling, display photos and play music through a wifi enabled touchscreen

In my post for top 10 predictions for 2016 I noted how lucky I had been for 3 years running as all my picks seemed to work. I pointed out that all winning streaks eventually come to an end. I’m not sure if this constitutes an end to my streak but in my forecasts for 2016 I was wrong with one of the three stock picks (GoPro) and also missed on one of my seven forecasts of industry trends (that the 2016 political spend would reach record levels). My other 2 stock picks and other 6 trend forecasts did prove accurate.

I’ve listed in bold the 2016 stock picks and trend forecasts below and give a personal evaluation of how I fared on each. For context, the S&P was up 7.5% and the Nasdaq 10.0% in 2016.

1. Facebook stock appreciation will continue to outpace the market (it is currently at $97/share). One year later (January 3) Facebook opened at $117.50, a year over year gain of 21.1% from the time of my blog post. While this was short of the 40% gain in 2015, it still easily outpaced the market.

2. Tesla stock appreciation will continue to outpace the market (it is currently at $193/share). One year later, Tesla shares opened at $219.25 (January 3), a 13.5% gain from the time of my blog post. It might have been higher but the acquisition of Solar City created headwinds for the stock as revenue grew well over 100%, gross profit improved and in Q3 (last reported quarter) EBITDA was positive. Still, it outperformed the market.

3. GoPro stock appreciation should outpace the market in 2016 (shares are currently at $10.86). This pick was a clear miss as the stock declined 17.1% from the time of the blog post to January 3. In my defense, I had it partly right as the stock peaked at $17/share at the time of the drone and new camera announcements. In retrospect, given GoPro’s history of poor execution, I would have been smarter to recommend selling at the time these were announced. Instead, I mistakenly viewed execution as pretty easy and failed to suggest this. Since the company, once again, had an execution misstep, I was proven wrong and the stock subsequently declined.

The remaining predictions were about industry trends rather than stocks.

4. UAV/Drones will continue to increase in popularity. Drones continued to increase in popularity at the end of 2015 and into the first half of 2016. According to Market Watch, drone sales were up over 200% in April of 2016 as compared with April of 2015. Starting in December of 2015, the government began requiring drone operators to register on a federal database and by December 2016 had registered over 600,000 drones and users.

5. Political spend will reach record levels in 2016 and have a positive impact on advertising revenue. This forecast proved incorrect. Donald Trump won the presidency despite raising less money than any major party presidential candidate since 2008. Hillary Clinton, raised nearly twice as much as Trump, but still fell short of what President Obama raised in 2012. In the case of President-Elect Trump, more than half of his small raise consisted of $66 million he personally donated to his campaign and $280 million from donors giving $200 or less. Mrs. Clinton, despite depicting Trump as the candidate of the rich, received a substantial portion of her donations from wealthy individuals. The two candidates raising less money meant that the size of the boost in advertising from political ads fell short of my prediction.

6. Virtual/Augmented Reality will have a big year in 2016. As expected, 2016 was the big launch year for VR and AR. Highly anticipated VR product launches (the Facebook Oculus Rift in March, the HTC Vive in April and the PlayStation VR in October) showed strong consumer interest with sales of over 1.5M units. Pokemon Go’s 500M + downloads and the initial release of Microsoft’s Hololense generated intense interest in AR, creating a flurry of application development across a variety of industries including healthcare, agriculture, manufacturing and retail. Unsurprisingly, this excitement is mirrored in VC investment dollars, with a 140% growth in funding over 2015, bringing the total amount invested this past year to $1.8 Bn. This shows a strong trajectory for more development across gaming and commercial applications in AR / VR as we move into 2017.

7. Robotic market will expand to new areas in 2016. From chatbots being introduced by many companies for interacting with customers, to a giant fighting robot (16 foot tall, 20,000 pounds) that can lift and throw a car, to robots for making pizzas, to robots that help educate kids, 2016 was a year of enormous expansion in the robotics market.

8. A new generation of automated functionality will begin to be added to cars. In 2016 autonomous cars moved from concept to closer to reality. To date, the technology leaders appeared to be Tesla and Google, the former building a fully integrated product, the latter a set of components that can be integrated into many different vehicles. Tesla, who appears to be furthest along in putting a fully autonomous car on the road in volume, added more components (software and sensors) to its autonomous technology but suffered a setback when a driver ignored Tesla requirements to “supervise” the autonomous driving and suffered a fatal accident. Autonomous cars took many steps forward in 2016 as additional companies entered the fray. Uber, a company that has much to gain from driverless cars (like eliminating the need for its over 1 million drivers), began an experiment in Pittsburg to offer driverless cars (supervised by an actual person in the driver’s seat) as part of its service. These cars are being manufactured in a partnership with Volvo using technology created by Carnegie Robotics (who’s founder was one of the creators of the Google technology). Uber also acquired Otto, a startup focused on driverless trucks, to gain further technology. In August, Ford announced its intent to bring an autonomous car to market by 2021. Audi just announced a partnership with Nvidia to bring an autonomous car to the road by 2020-21. Toyota, Chrysler and others have also announced intent to create such a vehicle. While I believe that the actual mass usage of driverless cars will be further out then 2021, we seem to be close to a breakout of “supervised automated vehicles”.

9. The Internet of Things will expand further into kitchen appliances and will start being adopted by the average consumer. In the past 12 months Samsung, LG, GE and others have launched numerous smart refrigerators. These can now be thought of as devices that can connect to a smart phone through an app. The user can receive alerts like ‘a water filter needs replacing’ or ‘the door was left open’. Some have digital bulletin boards on the fridges, other features can let you know when various items stored in the fridge are running low, and still more features can be deployed to control functionality (change temperature, etc). The adoption of these devices has reached sufficient levels for them to be carried in mainstream stores like Best Buy.

10. Amazon will move to profitability on their book subscription service and improve cloud capex. Amazon did indeed make three major shifts in its book subscription strategy. First, it significantly reduced payouts to publishers for their books that were downloaded; second, it reduced the proportion of third party published books offered to subscribers to the service and third it reduced the amount it pays their own authors. While Amazon does not report these numbers, I believe this combination has reduced the cost to Amazon by over 50% and has made the service profitable. The gross margin before stock based compensation for Amazon’s cloud service increased year over year in Q3 (last reported quarter) from 27.1% in 2015 to 31.6% in 2016.


While it wasn’t in my Top 10 post for 2016, I did predict that Kevin Durant would sign with the Warriors as he would fit right in and improve his chances of winning championships. He has signed, seems to fit in well, but we’ll have to wait to see if the championships follow.

I’ll be making my 2017 picks within the next week.