Mike Kwatinetz is a Founding General Partner at Azure Capital Partners and a Venture Capitalist investing in application software (SaaS), ecommerce, consumer web and infrastructure technology companies. Successful exits include: Bill Me Later, VMware, TripIt and Top Tier.
My long term readers know that every so
often the blog wanders into the sports arena. In doing so, I apply the same
type of analysis that I do for public stocks and for VC investments to sports,
and usually, basketball. Given all the turmoil that has occurred in the NBA
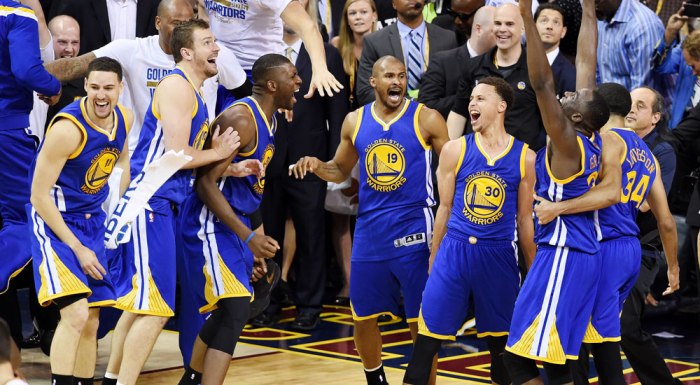
this off-season, including the Warriors losing Durant, Iguodala, Livingston,
Cousins and several other players, I thought it would be interesting to
evaluate the newly changed team. Both ESPN and CBS power rankings have them 7th
in the West and 11th in the NBA. I find that an overreaction as the
Warriors may have beaten the Raptors if Klay Thompson not been injured, they
swept Portland, and won the last 2 Rockets games without Durant. At the time
this drove a lot of chatter that the team might be better off without Durant (I
disagree).
But rather then compare the revised roster to
last year’s, it seems more closely matched with the 2014-15 team, as that was a
championship team that did not include Kevin Durant. I will make 2 key
assumptions:
Klay Thompson will return by
the end of February and be as effective as he was before his injury
The Warriors will make the
playoffs despite missing Thompson for the majority of the season
It all starts with Curry
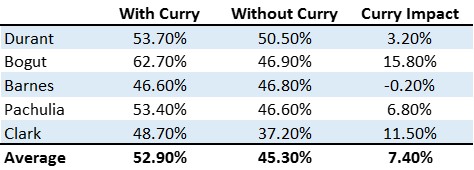
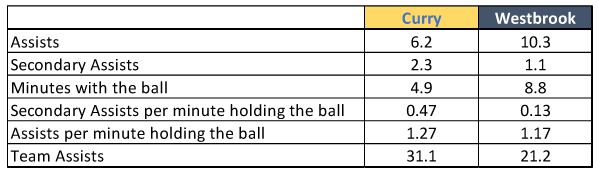
A third key assumption that has been proven over and over again is that players that come to the Warriors usually perform better as they benefit from the “Curry Effect”, namely, getting more shots without having someone closely guarding them, (The Curry Effect), resulting in an average improved shooting percentage of over 5%. In all fairness, it really is the “Curry plus Thompson Effect” as the extreme focus on preventing the two of them from taking 3 point shots is what frees up others. It helps that Curry is unselfish and readily passes the ball when he is double or triple teamed. Thompson’s passing has improved substantially but since he gets his shot off so quickly, he has less need to pass it. Last year both shot over 40% from 3 despite defensive efforts focused on preventing each of them from taking those shots.
Starting Teams: 2019-20 vs 2014-15
Table 1
Curry, Thompson and Green, the heart and soul of the Warriors, all remain from the 2014-15 roster, and now are at their peaks. In the 2014-15 season when Green first became a starter, Curry was one year away from reaching his peak and Thompson was just coming into his own especially on defense. I believe each of them is better today then they were at that time. At his best, Bogut may have been better than Cauley-Stein, but by 2014 Bogut had been through a number of injuries. Last year Cauley-Stein averaged nearly double the points of 2014 Bogut (11.9 vs 6.3), took slightly more rebounds per game and was a better free throw shooter. Stein, much like Bogut, is also considered a solid pick setter and defender. Russell is someone who should benefit greatly from playing with Curry. Even without that, last season he averaged over twice as many points per game as 2014 Barnes (21.1 vs 10.1) which should take considerable pressure off Curry (and Klay when he returns). However, Barnes was a better defender in 2014 than Russell is today. I give the edge to all 5 starters on the 2019 starting team compared to the 5 that started in 2014-15.
Thompson may be the most underrated player in the league!
It’s unfortunate that Thompson was injured in game 6 of the 2019 finals as he was once again proving just how good he can be. Not only was he playing lockdown defense, but he also drove the offense in what has been referred to as a typical Klay game 6. In just 32 minutes, before getting injured, he scored 30 points on 83% effective shooting percentage (67% on 3s), went 10 for 10 on free throws, and had 5 rebounds and 2 steals. I believe Golden State, even without Durant, would have forced a game 7 if Thompson did not get injured.
It boggles my mind that one of the websites
could refer to Thompson as “an average player” who did not merit a max contract.
This is bordering on the ridiculous and has a lot to do with the fact that the
most important measure of shooting, effective shooting percentage (where each 3
made counts as 1½ 2 point shots made) does not normally get reported (or even
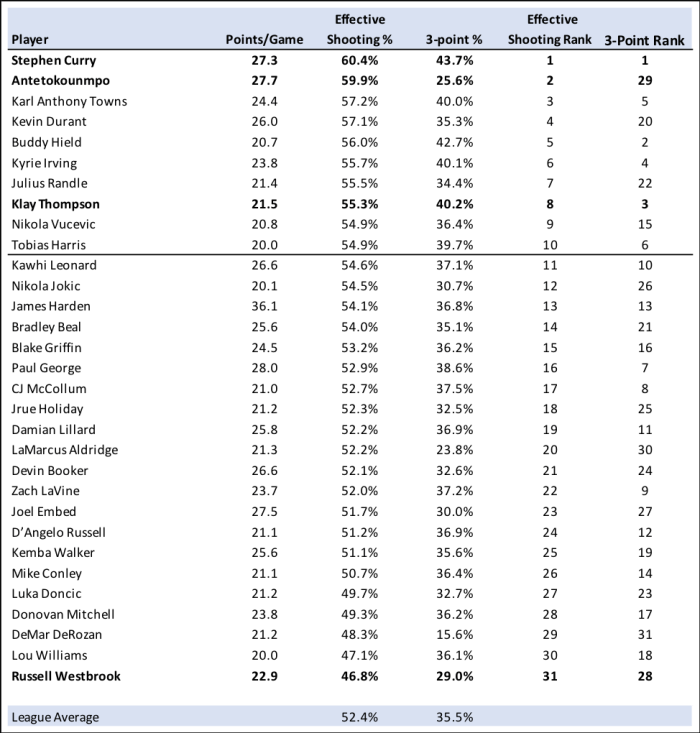
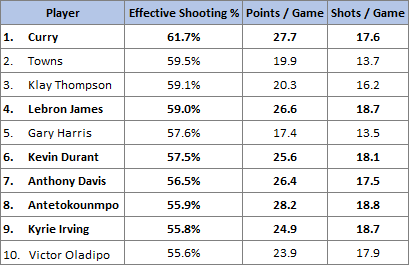
noticed). In Table 2, I list the top 31 scorers from last season (everyone who
averaged at least 20 points per game) and rank them by effective shooting.
Thompson is number 8 in effective shooting and number 3 in 3-point percentage
among this group. So, if effective shooting percentage was regularly published,
Thompson would show up consistently helping the perception of his value. When
this is coupled with his being a third team all-defensive player (i.e., one of
the top 15 defenders in the league) it appears clear that he should be
considered one of the top 15 players in the league.
Table
2: Top Scorers 2018-2019 Season
6th Man 2019-20 vs 2014-15
Kevon Looney has emerged as a potential
star in the works. While he may not yet be the defensive presence of Iguodala,
he is getting close. His scoring per minute played was higher than Andre’s
2014-15 numbers and his rebounds per minute were more than twice as much. While
Iguodala had greater presence and could run the team as well as assist others
in scoring, Looney at least partly makes up for this in his ability to set
screens. Looney also has a much higher effective shooting percentage (62.7% vs
54.0%) than Andre had in 2014-15. While Kevon doesn’t shoot 3s he gets many
points by putting back offensive rebounds and dunking lob passes. Overall, I
give the edge to Iguodala based on the Looney of last season but given Looney’s
potential to improve this might be dead even in the coming one.
Rest of the Bench for the 2 teams
It is the bench that is hardest to
evaluate. Unlike last year’s bench, the 2014-15 bench was quite strong which
spawned the Warrior logo “Strength in Numbers”. It included quality veteran
players like Leandro Barbosa, David Lee, Mareese Sprouts and Shaun Livingston, who
was playing at a much higher level than last season. The four of these together
averaged over 26 points per game. This
coming year’s bench is much younger and more athletic. It includes Alec Burks,
Glenn Robinson, Alfonzo McKinnie and Omari Spellman, plus several rookies and
Jacob Evans III. The first four are all capable of scoring and are solid 3-point
shooters (they could increase to well above average once with the Warriors). I
expect that group, coupled with one or two of the others, to exceed the 2014-15
bench in defense…but may not have as much scoring fire power. The team is
likely to give one or two of the rookies as well as Evans opportunities to earn
minutes as well. The bench is an improvement over last year but may not be as
strong as the 2014-15 squads.
Overall Assessment
I believe the 2019-2020 squad is better
than the championship team of 2015. The starting lineup features the core 3
players who have improved since then, D’Angelo Russell who was an all-star last
year, and a solid center in Willie Cauley-Stein making the edge substantial.
Looney as 6th man is already giving evidence of future stardom.
While he was not quite the Andre Iguodala of 2014-15, the difference is modest,
and Looney continues to improve. The 2014-15 bench appears superior to that of
next season, but the edge is not great as the newer group should be stronger
defensively and is not far off the older group as scorers – the question will
be how well they gel and how much the Curry/Klay factor improves their scoring.
Finally, I think Kerr is a better coach today than he was given the last 5
years of experience.
They May Have Improved vs 2014-15, but so has the Competition
ESPN and CBS power rankings reflect the
fact that multiple teams have created new “super star” two-somes:
Lakers: Lebron and Anthony
Davis
Clippers: Kawhi Leonard and
Paul George
Houston: Harden and Westbrook
(in place of Chris Paul)
Nets: Kyrie Irving and Durant
Contenders also include improving young teams
like Boston, Philadelphia, Denver, and Utah plus an improved Portland squad. This
makes the landscape much tougher than when the Warriors won their 2015
championship. Yet, none of these teams seem better than the Cleveland team (led
by a younger LeBron, Kyrie Irving and Kevin Love) the Warriors beat in 2015.
So, assuming Klay returns by late February and is back to par, I believe the
Warriors will remain strong contenders given the starting team with four all-stars
augmented by Willie Cauley-Stein and an improving Kevon Looney as 6th
man. However, it will be much tougher going in the early rounds in the playoffs,
making getting to the finals longer odds than in each of the past 5 years.
SoundBytes
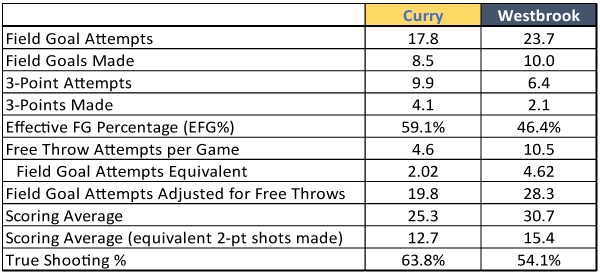
An examination of Table 2
reveals several interesting facts:
Curry, once again is the leader
among top scorers in effective shooting and the only one over 60%
Antetokounmpo is only slightly
behind despite being a very poor 3-point shooter. If he can improve his
distance shooting, he may become unstoppable
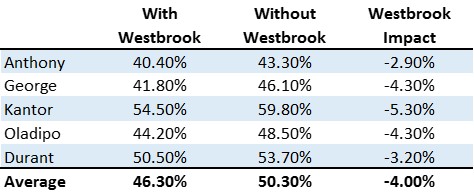
Russell Westbrook, once again,
had the worst effective shooting percent of anyone who averaged 20 points or
more. In fact, he was significantly below the league average. Part of the
reason is despite being a very poor 3-point shooter he continues to take too
many distance shots. Whereas most players find that taking 3s increases their
effective shooting percent, for Westbrook it lowers it. I haven’t been able to
check this, but one broadcaster stated that he has the lowest 3-point
percentage of any player in history that has taken over 2500 3-point shots!
I believe that Westbrook has a
diminished chance to accumulate as many triple doubles next season as he has in
the past. There is only one ball and both he and Harden tend to hold it most of
the time. When Chris Paul came to the Rockets his assists per game decreased by
about 15% compared to his prior 3 season average.
Applying Private Investment Analysis to the Rash of Mega-IPOs Occurring
The
first half of 2019 saw a steady stream of technology IPOs. First Lyft, then
Uber, then Zoom, all with different business models and revenue structures. As
an early investor in technology companies, I spend a lot of time evaluating
models for Venture Capital, but as a (recovering) investment analyst, I also
like to take a view around how to structure a probability weighted investment once
these companies have hit the public markets. The following post outlines a
recent approach that I took to manage the volatility and return in these growth
stocks.
Question: Which of the Recent technology IPOs Stands out as a Winning
Business Model?
Investing in Lyft and Uber, post IPO, had
little interest for me. On the positive side, Lyft revenue growth was 95% in Q1,
2019, but it had a negative contribution margin in 2018 and Q1 2019. Uber’s growth was a much lower 20% in Q1, but it
appears to have slightly better contribution margin than Lyft, possibly even as
high as 5%. I expect Uber and Lyft to improve their contribution margin, but it
is difficult to see either of them delivering a reasonable level of
profitability in the near term as scaling revenue does not help profitability
until contribution margin improves. Zoom Video, on the other hand, had
contribution margin of roughly 25% coupled with over 100% revenue growth. It also
seems on the verge of moving to profitability, especially if the company is
willing to lower its growth target a bit.
Zoom has a Strong Combination of Winning Attributes
There is certainly risk in Zoom but based
on the momentum we’re seeing in its usage (including an increasing number of
startups who use Zoom for video pitches to Azure), the company looks to be in
the midst of a multi-year escalation of revenue. Users have said that it is the
easiest product to work with and I believe the quality of its video is best in
class. The reasons for Zoom’s high growth include:
Revenue retention of a cohort is currently 140% – meaning that the same set of customers (including those who churn) spend 40% more a year later. While this growth is probably not sustainable over the long term, its subscription model, based on plans that increase with usage, could keep the retention at over 100% for several years.
It is very efficient in acquiring customers – with a payback period of 7 months, which is highly unusual for a SaaS software company. This is partly because of the viral nature of the product – the host of the Zoom call invites various people to participate (who may not be previous Zoom users). When you participate, you download Zoom software and are now in their network at no cost to Zoom. They then offer you a free service while attempting to upgrade you to paid.
Gross Margins (GMs) are Software GMs – about 82% and increasing, making the long-term model likely to be quite profitable
Currently the product has the reputation of being best in class (see here) for a comparison to Webex.
Zoom’s compression technology is well ahead of any competitor according to my friend Mark Leslie (a superb technologist and former CEO of Veritas).
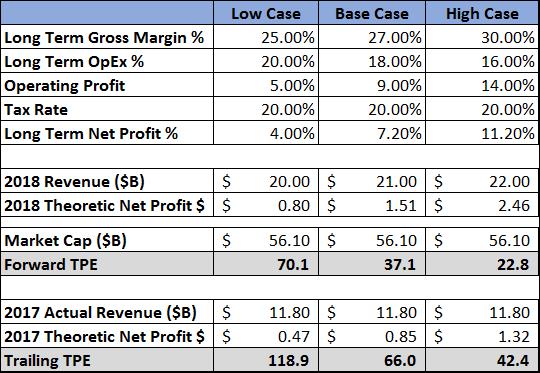
The Fly in the Ointment: My Valuation Technique shows it to be Over
Valued
My valuation technique, published in one of our blog posts, provides a method of valuing companies based on revenue growth and gross margin. It helps parse which sub-scale companies are likely to be good investments before they reach the revenue levels needed to achieve long term profitability. For Zoom Video, the method shows that it is currently ahead of itself on valuation, but if it grows close to 100% (in the January quarter it was up 108%) this year it will catch up to the valuation suggested by my method. What this means is that the revenue multiple of the company is likely to compress over time.
Forward Pricing: Constructing a Way of Winning Big on Appreciation of
Even 10%
So instead of just buying the stock, I constructed
a complex transaction on May 29. Using it, I only required the stock to
appreciate 10% in 20 months for me to earn 140% on my investment. I essentially
“pre-bought” the stock for January 2021 (or will have the stock called at a
large profit). Here is what I did:
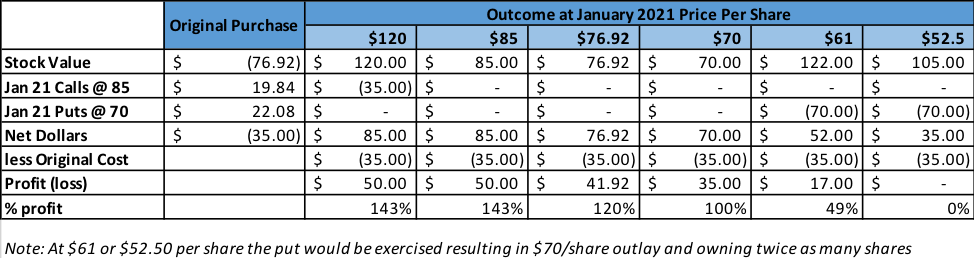
Bought shares of stock at $76.92
Sold the same number of shares of call options at $85 strike price for $19.84/share
Sold the same number of shares of put options at $70 strike for $22.08/share
Both sets of options expire in Jan 2021 (20 months)
Net out of pocket was $35/share
Given the momentum I think there is a high
probability (75% or so) that the revenue run rate in January 2021 (when options
mature) will be over 2.5x where it was in Q1 2019. If that is the case, it seems
unlikely that the stock would be at a lower price per share than the day I made
the purchase despite a potential for substantial contraction of Price/Revenue.
In January 2021, when the options expire, I will either own the same shares, or double the number of shares or I will have had my shares “called” at $85/share.
The possibilities are:
If the stock is $85 or more at the call date, the stock would be called, and my profit would be roughly 140% of the net $35 invested
If the stock is between $70 and $85, I would net $42 from the options expiring worthless plus or minus the change in value from my purchase price of $76.92. The gain would exceed 100%
If the stock is below $70, I’ll own 2x shares at an average price of $52.50/share – which should be a reasonably good price to be at 20 months out.
Of course, the options can be repurchased, and new options sold during the time period resulting in different outcomes.
Break-Even Point for the Transaction Is a 32% Decline in Zoom Video Stock
Price
Portfolio Managers that are “Value
Oriented” will undoubtedly have a problem with this, but I view this
transaction as the equivalent of a value stock purchase (of a high flyer) since
the break-even of $52/share should be a great buy in January 2021. Part of my
reasoning is the downside protection offered: where my being forced to honor
the put option would mean that in January 2021, I would own twice the number of
shares at an average price of $52.50/share. If I’m right about the likelihood
of 150% revenue growth during the period, it would mean price/revenue had
declined about 73% or more. Is there some flaw in my logic or are the premiums
on the options so high that the risk reward appears to favor this transaction?
I started writing this before Zoom reported
their April quarter earnings, which again showed over 100% revenue growth
year/year. As a result, the stock jumped and was about $100/share. I decided to
do a similar transaction where my upside is 130% of net dollars invested…but
that’s a story for another day.
Estimating the “Probabilistic” Return Using My Performance Estimates
Because I was uncomfortable with the
valuation, I created the transaction described above. I believe going almost 2
years out provides protection against volatility and lowers risk. This can
apply to other companies that are expected to grow at a high rate. As to my
guess at probabilities:
75% that revenue
run rate is 2.5x January 2019 (base) quarter in the quarter ending in January
2021. A 60% compound annual growth (CAG) for 2 years puts the revenue higher
(they grew over 100% in the January 2019 quarter to revenue of $105.8M)
95% that revenue
run rate is over 2.0X the base 2 years later (options expire in January of that
year). This requires revenue CAG of 42%. Given that the existing customer
revenue retention rate averaged 140% last year, this appears highly likely.
99% that revenue
is over 1.5X the base in the January 2021 quarter (requires slightly over 22% CAG)
1% that revenue is
less than 1.5X
Assuming the above is true, I believe that
when I did the initial transaction the probabilities for the stock were (they
are better today due to a strong April quarter):
50% that the stock
trades over 1.5X today by January 2021 (it is almost there today, but could hit
a speed bump)
80% that the stock
is over $85/share (up 10% from when I did the trade) in January 2021
10% that the stock
is between $70 and $85/share in January 2021
5% that the stock
is between $52 and $70 in January 2021
5% that the stock is
below $52
Obviously, probabilities are guesses since
they heavily depend on market sentiment, whereas my revenue estimates are more
solid as they are based upon analysis, I’m more comfortable with. Putting the
guesses on probability together this meant:
80% probability of
140% profit = 2.4X
10% probability of
100% profit = 2.0X
5% probability of
50% profit (this assumes the stock is in the middle at $61/share) = 1.5X
5% probability of
a loss assuming I don’t roll the options and don’t buy them back early. At
$35/share, loss would be 100% = (1.0X)
If I’m right on these estimates, then the
weighted probability is 120% profit. I’ve been doing something similar with Amazon
for almost 2 years and have had great results to date. I also did part of my DocuSign
buy this way in early January. Since then, the stock is up 27% and my trade is
ahead over 50%. Clearly if DocuSign (or Amazon or Zoom) stock runs I won’t make
the same money as a straight stock purchase would yield given that I’m capped
out on those DocuSign shares at slightly under 100% profit, but the trade also
provides substantial downside protection.
Conclusion: Investing in Newly Minted IPOs of High Growth Companies with
Solid Contribution Margins Can be Done in a “Value Oriented” Way
When deciding whether to invest in a
company that IPOs, first consider the business model:
Are they growing at a high rate
of at least 30%?
Experiencing increasing
contribution margins already at 20% or more?
Is there visibility to profitability
without a landscape change?
Next, try to get the stock on the IPO if
possible. If you can’t, is there a way of pseudo buying it at a lower price? The
transaction I constructed may be to complex for you to try and carries the
additional risk that you might wind up owning twice the number of shares. If
you decide to do it make sure you are comfortable with the potential future
cash outlay.
Why doesn’t Amazon produce more earnings given its dominance?
Amazon just reported earnings and, as was the case in 2017 and 2016, emphasized that 2019 will be an investment year, so the strong operating margin expansion of 2018 would be capped in 2019. This, of course, is great fodder for bears on the stock as Amazon gave sceptics renewed opportunity to point out that it is a company that has a flawed business model and would find it difficult to ever earn a reasonable return on revenue.
In contrast, I believe that Amazon continues to transform itself into a potential strong profit performer. For example, taking the longer perspective, Amazon’s gross margins are now over 40% up from 27.2% five years ago (2013). So why doesn’t Amazon deliver higher operating margin than the slightly over 6% it reported in 2018? Amazon’s dirty little secret is that it continues to invest heavily in creating future dominance through R&D. Had it spent a similar amount in R&D to its long time competitor, Walmart, EBITDA would have nearly tripled… to over 17% of revenue! I must confess that in the past I haven’t paid enough attention to how much Amazon spends on R&D. As a result, I was surprised that Apple and Microsoft trailed it in voice recognition technology and that Amazon could lead IBM and Microsoft in cloud technology. The reason this occurred is not a surprising one: Amazon outspends Apple, Microsoft and IBM in R&D.
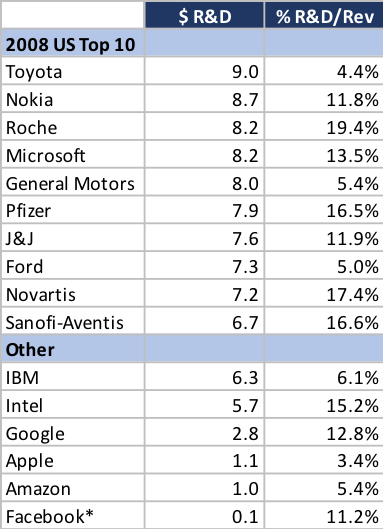
In fact, Amazon now outspends every company in the world (see Table 1) and have been dedicating a larger portion of available dollars to R&D (as measured by the % of gross margin dollars spent on R&D) than any other large technology company, except Qualcomm, for more than 10 years. Even though Amazon had less than 50% of Apple’s revenue and less than 1/3 of its gross margin dollars 5 years ago (2013) Amazon spent nearly 50% more than Apple on R&D that year… by 2018 the gap had increased to close to 100% more.
Table 1: Top 10 (and a few more) U.S. R&D Spenders in 2018 ($Bn)
Note 1: Ford and GM may be in the top 10 but so far have not reported R&D in 2018. If they report it at year end the table could change. Walmart does not report R&D and their spend is generally unavailable, but I found a reference that said they expected to spend $1.1M in 2017.
Note 2: A 2018 global list would include auto makers VW and Toyota (with R&D of $15.8B and about 10.0B), drug company Roche (&10.8B) and tech company Samsung at $15.3B in place of the lowest 4 in Table 1.
The Innovators Financial Dilemma: Increasing Future Prospects can lower Current Earnings
When I was on Wall Street covering Microsoft (and others) Bill Gates would often point out that the company was going to make large investments the following year so they could stay ahead of competition. He said he was less concerned with what that meant for earnings. That investment helped drive Microsoft to dominance by the late 1990s. Companies are often confronted with the dilemma of whether to increase spending to drive future growth or to maximize current earnings. I believe that investment in R&D, when effective, is correlated to future success.
It is interesting to see how leaders in R&D spending have transitioned over the past 10 years. In 2008 the global leaders in R&D spending included 5 pharma companies, 3 auto makers and only 2 tech companies (Nokia and Microsoft which subsequently merged). In 2018, 6 of the top 7 spenders (Samsung plus the 5 shown in Table 1) were technology companies.
Table 2 – 2008 global R&D leaders ($Bn)
Note: *Facebook data from 2009, first available financials from S-1 filing
It’s hard to change without tanking one’s stock
When a company has a business model that allocates 1% of gross margin dollars to R&D, it is not easy to turn on the dime. If Walmart had decided to invest half as much as Amazon in R&D in 2018, its earnings would have decreased by 80% – 90% and its stock would have depreciated substantially. So, instead it began a buying binge several years ago to try to close the technology gap through acquisitions (which has a much smaller impact on operating margins). It remains to be seen if this strategy will succeed going forward but in the past 5 years Walmart revenue (including acquisitions) increased only 5% while Amazon’s was up 130% in the same period (also including acquisitions).
Whatever Happened to IBM?
When I was growing up, I thought of IBM as the king of tech. In the early 1990s it still seemed to rule the roost. The biggest fear for Microsoft was that IBM could overwhelm it, yet now it appears to be an also ran in technology. From 2014 to 2018, a heyday era for tech companies, its revenue shrank from $93 billion in 2014 to $80 billion in 2018. I can’t tell how much of the problem stems from under investing in R&D versus poor execution, but for the past 5 years it has spent an average of about 13% of GM on R&D, while the 6 tech companies in Table 1 have averaged about 24% of GM dollars with Apple the only one under 20%.
Soundbytes
Soundbyte I: Tesla
I recently had a long dialogue with a very smart fund manager and was struck by what I believe to be misinformation he had read regarding Tesla. There were 3 major points that he had heard:
The quality of Tesla cars was shoddy
Tesla could not maintain reasonable margins as it began producing lower priced Model 3s
The upcoming influx of electric cars from companies like Porsche, Jaguar and Audi would take substantial market share away from Tesla
I decided to do a bit of research to determine how valid each of these issues might be.
Tesla Quality: I found it hard to believe that the majority of Tesla owners thought the car was of poor quality since every one of the 15 or so people I knew who had bought one had already bought another or were planning to for their next car. So, I found a report on customer satisfaction from Consumer Reports, and I was not surprised to find that Tesla was the number 1 ranked car by customer satisfaction.
Tesla margins: this is much harder to predict. Since Tesla is relatively young as a manufacturer it has had numerous issues with production. Yet it is probably ahead of many others when it comes to automating its facilities. This tends to cause gross margins to be lower while volume ramps and higher subsequently. The combination of that, plus moving up the learning curve, should mean that Tesla lowers the cost of producing its products. However, Tesla charges more for cars with higher capacity for distance, but as I understand it uses software to limit battery capacity for lower priced cars. This would mean that a portion of the difference between a lower priced Model 3 and a higher priced one (the battery capacity) would be minimal change in cost, putting pressure on margins. The question becomes whether Tesla’s improving cost efficiencies offset the average price decline of a Model 3 as Tesla begins fulfilling demand for lower priced versions.
March 1 Update: After this post was complete (Thursday February 28) the company announced it was closing many showrooms to reduce costs. Then late today (Friday) announced that the $35,000 version of the model 3 is now available. So, we shall soon see the impact. I believe that if Tesla has increased capacity there will be very strong sales. It also likely will experience lower gross margin percentages as it climbs the learning curve and ramps production.
Will the influx of electric cars from others impact Tesla market share?
Porsche is an electric sports car starting at $90K – at that price point it is competitive with model S not model 3. In competing with the S it comes down to whether one prefers a sports car to a sedan. I have owned a Porsche in the past and would only consider it if I wanted a sports car with limited seating capacity (but very cool). I loved my Porsche but decided to switch to sedans going forward. Since then I’ve owned only sedans for the past 10+ years. It also appears that early production is almost a year away, so it is unlikely to be competitive for 2019.
Audi is at price points that do compete with the Model 3 and expects to start delivering cars in March. However, I think that is mainly in Europe where Tesla is an emerging brand so it might not impact them at all. When I look at the Audi models I don’t think they will appeal to Tesla buyers as they are very old-line designs (I would call them ugly). The range of the cars on a charge is not yet official but seems likely to be much lower than Tesla which has a big lead in battery technology.
The Jaguar competes with the Tesla Model X but while cheaper, appears a weak competitor.
I don’t want to dismiss the fact that traditional players will be introducing a large number of electronic vehicles. The question really is whether the market size for electric cars is a fixed portion of all cars or whether it will become a much larger part of the entire market over time. I would compare this to fears that analysts had when Lotus and Wordperfect created Windows versions. They felt that Microsoft would lose share of windows spreadsheets and word processors. I agreed but pointed out that Windows was 10% of the entire market for spreadsheets, so having a 90% share gave Microsoft 9% of the overall spreadsheet market. I also predicted Microsoft would have over a 45% share when Windows was 100% of the market. So, while this would decrease Microsoft’s share of Windows spreadsheets, it would grow its total share of the market by 5X Of course we all were proven wrong as Microsoft eventually reached over 90% of the entire market.
For Tesla, the question becomes whether these rivals are helping accelerate the share electric cars will have of the overall market, rather than eroding Tesla volumes. I’m thinking that it’s the former, and that Tesla will have a great volume year in 2019 and that its biggest competitive issue will be whether the Model 3 is so strong that it will get people to buy it over the Model S. Of course, I could be wrong, but believe the odds favor Tesla in 2019, especially the first half of the year where the competitors are not that strong.
Soundbyte II: The NYC / Amazon Deal Collapses
I never cease to be amazed at how little regard some Politicians have for facts. I should likely not have been surprised by the furor created over Amazon locating a major facility in New York City. I thought the $44 billion or more in benefits to the City and State and massive job creation were such a win that no one would contest it. Instead, the dialog centered around the $ 3 billion in tax benefits to Amazon. All but 1/6 of the benefits (which was cash from the state) were based on existing laws and amounted to a reduction of future taxes rather than upfront cash. What a loss for the City.
The 2018 December selloff provides buying opportunity
One person’s loss is another’s gain. The market contraction in the last quarter of the year means that most stocks are at much lower prices than they were in Q3 of 2018. The 5 stocks that I’m recommending (and already own) were down considerably from their Q3 2018 highs. While this may be wishful thinking, returning to those highs by the end of 2019 would provide an average gain of 78%. Each of the 5 had revenue growth of 25% or more last year (and 3 were over 35%) and each is poised for another strong year in 2019.
For the 4 continued recommendations (all of which I mentioned I would recommend again in my last post), I’ll compare closing price on December 31, 2019 to the close on December 31, 2018 for calculating performance. For the new add to my list, I’ll use the stock price as I write this post. I won’t attempt to predict the overall market again (I’m just not that good at it) but feel that the 14% drop in Q4 means there is a better chance that it won’t take a nosedive. However, since stock picks are always relative to the market, success is based on whether my picks, on average, outperform the market.
I’ll start the post with stock picks and then follow with the remaining 5 predictions.
2019 Stocks
Tesla stock will outpace the market (it closed last year at $333/share and is essentially the same as I write this)
In Q3, 2018 the Tesla model 3 was the bestselling car in the U.S. in terms of revenue and 5th highest by volume. This drove a 129% revenue increase versus a year earlier and $1.75 in earnings per share versus a loss of $4.22 in the prior quarter. I expect Q4 revenue to increase sequentially and growth year/year to exceed 100%. In Q3, Tesla reported that nearly half of vehicles traded in for the Model 3 were originally priced below $35,000. As Tesla begins offering sub-$40,000 versions of it, demand should include many buyers from this high-volume price range. Since the backlog for the Model 3 is about 300,000 units I expect 2019 sales to remain supply constrained if Tesla can offer lower price points (it already has announced a $2,000 price reduction). The important caveat to demand is that tax credits will be cut in H1 2019, from $7500 to $3750 and then cut again to $1875 in the second half of the year. Part of Tesla’s rationale for a $2000 price drop is to substantially offset the initial reduction of these tax credits.
Tesla began taking orders for its Q1 launch in Europe where demand over time could replicate that in the U.S. The average price of a Model 3 will initially be about $10,000 higher than in the U.S. Tesla is also building a major manufacturing facility in China (where Model 3 prices are currently over $20,000 higher than the U.S.). This Giga-Factory is expected to begin production in the latter half of 2019. While moving production to China for vehicles sold there should eliminate trade war issues, Tesla still expects to begin delivering Model 3s to Chinese customers in March.
The combination of a large backlog, reducing prices within the U.S. and launches in Europe and China should generate strong growth in 2019. Some investors fear price reductions might lead to lower gross margins. When I followed PC stocks on Wall Street, this was a constant question. My answer is the same as what proved true there: strong opportunity for continuous cost reduction should enable gross margins to remain in the 20-25% range in any location that is at volume production. So, perhaps the Chinese Giga-Factory and a future European factory will start at lower margins while volume ramps but expect margins in the U.S. (the bulk of revenue in 2019) to remain in the targeted range. Higher prices in Europe and China due to massive initial demand allows premium pricing which may keep margins close to 20%+ in each.
Facebook stock will outpace the market (it closed last year at $131/share).
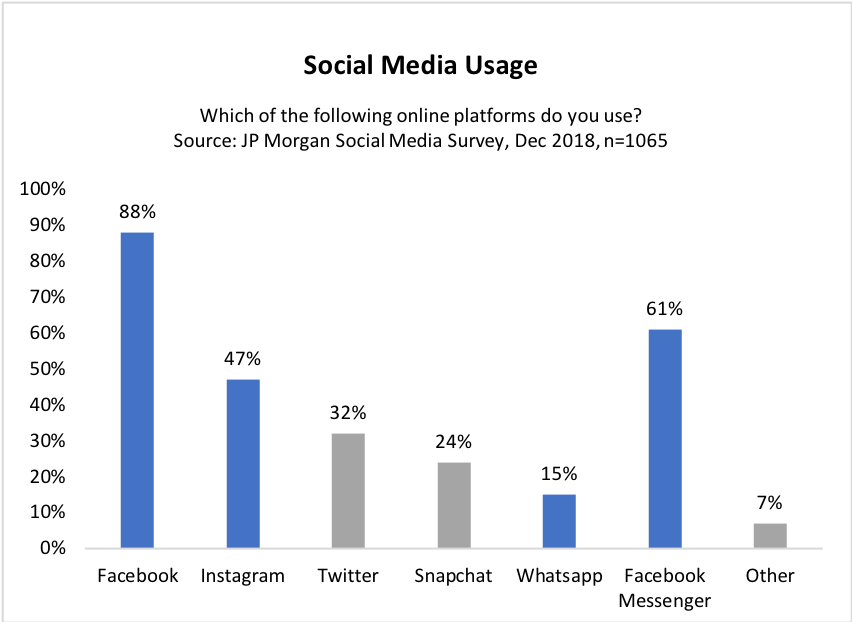
Facebook underperformed in 2018, closing the year down 28% despite revenue growth that should be 35% to 40% and EPS tracking to about 36% growth (despite a massive increase in SG&A to spur future results). The stock reacted to the plethora of criticism regarding privacy of user information coupled with the continuing charges of Russian use of Facebook to impact the election. Before the wave of negative publicity, Facebook reached a high of $218/share in July. Facebook is likely to continue to increase its spending to address privacy issues and to burnish its image. However, scaling revenue could mean it keeps operating margins at a comparable level to 2018 rather than increasing them. Rumors of Facebook’s demise seem highly exaggerated! According to a December 2018 JP Morgan survey of U.S. Internet users, the three most used social media products were Facebook (88% of participants), Facebook Messenger (61%) and Instagram (47%). Also, 82% of those surveyed picked a Facebook-owned platform as being the most important to them. Finally, the average Facebook user reported checking Facebook roughly 5 times per day with 56% of users spending 15 minutes to an hour or more on the platform on an average day. While Facebook has experienced a minor decrease in overall usage, Instagram usage has increased dramatically. Facebook, Instagram, and WhatsApp together give the company a growing and dominant position.
At the beginning of 2018 Facebook stock was trading at 34 times trailing EPS. By the end of the year the multiple of trailing EPS was below 18. If I assume EPS can grow 20%+ in 2019 (which is below my expectation but higher than the consensus forecast) than a multiple of 20 would put the stock at about $180/share by December 31. If it grew EPS, more in line with revenue and/or returned to a multiple closer to 34 it could reach well over 200.
Two key factors:
A 20% increase in revenue (I expect the increase to be about 30%) adds over $11 billion in revenue. A comparable 20% increase in SG&A would provide over $4 billion in additional money to spend, affording the company ample dollars to devote to incremental marketing without impacting operating margins.
Given the “low” stock price, Facebook increased its buyback program by $9 billion to $15 billion. Since it generates $6B – $7B in cash per quarter from operations (before capex) and has roughly $40 billion in cash and equivalents it could easily increase this further if the stock remains weak. The $15 billion could reduce the share count by as much as 3% in turn increasing EPS by a similar amount.
Amazon stock will outpace the market (it closed last year at $1502/share).
While its stock dropped from its September high of $2050, Amazon remained one of the best market performers in 2018 closing the year at $1502/share. At its 2018 high of $2050, It may have gotten ahead of itself, but at year end it was up less than 2018 revenue growth. Leveraging increased scale meant net income grew faster than revenue and is likely to triple from 2017. Growth will be lower in Q4 then Q3 as Q4 2017 was the first quarter that included all revenue from Whole Foods. Still, I would not be surprised if Amazon beat expectations in Q4 since this is already factored into analyst forecasts. Amazon trades on revenue coupled with the prospect of increasingly mining the revenue into higher profits. But the company will always prioritize making long term investments over maximizing near term earnings. Growth in the core ecommerce business is likely to gradually slow, but Amazon has created numerous revenue streams like its cloud and echo/Alexa businesses that I expect to result in maintaining revenue growth in the 20% plus range in 2019. The prospect of competing with an efficient new brick and mortar offering (see prediction 6 in this post) could drive new excitement around the stock.
Profitability in 2019 could be reduced by: announced salary increases to low end workers; increasing the number of physical store locations; and greater marketing incentives for customers. Offsets to this include higher growth in stronger margin businesses like AWS and subscription services. The stock may gyrate a bit, but I expect it to continue to outperform.
Stitch Fix stock will outpace the market (it closed last year at $17/share).
In my 2018 forecast I called this my riskiest pick and it was the most volatile which is saying a lot given the turbulence experience by Facebook, Tesla, and Amazon. I was feeling pretty smug when the stock reached a high of $52/share in September! I’m not sure how much of the subsequent drop was due to VCs and other early investors reducing their positions but this can have an impact on newly minted public companies. Whatever the case, the stock dropped from September’s high to a low point of $17.09 by year’s end. The drop was despite the company doing a good job balancing growth and profitability with October quarter revenue up 24% and earnings at $10.7 million up from $1.3 million in the prior year. Both beat analyst expectations. The stock was impacted because the number of users grew 22% (1-2% less than expected) despite revenue exceeding expectations at 24% growth. I’m not sure why this was an issue.
Stitch Fix continues to add higher-end brands and to increase its reach into men, plus sizes and kids. Its algorithms to personalize each box of clothes it ships keeps improving. Therefore, the company can spend less on acquiring new customers as it has increased its ability to get existing customers to spend more and come back more often. I believe the company can grow by roughly 20% or more in 2019. If it does and achieves anything close to the revenue multiple that it started with in 2018 (before the multiple doubled in mid-year), there would be a sizeable stock gain this year. But it is a thinly traded stock and likely to be quite volatile.
Docusign Stock will outpace the market in 2019 (it is currently at $43/share).
Docusign is a new recommendation. Like Stitch Fix, it is a recent IPO and could be volatile. Docusign is the runaway leader in e-signatures, facilitating multiple parties signing documents in a secure, reliable way on board resolutions, mortgages, investment documents, etc. Strong positives include:
A high value for a reasonable price – I am increasingly annoyed when I need to deal with manual signatures for documents.
As of October 31, 2018, Docusign had over 450,000 customers up from 350,000 customers one year earlier. Of which 50,000 are Enterprise/Commercial accounts;
There are hundreds of millions of users whose e-signatures are stored by the company making the network effect quite large;
Roughly 95% of revenue is from its SaaS product which has 80% gross margin with the rest from services where margins have improved and are now positive;
As a SaaS company with a stable revenue base growth is more predictable. The company exceeded revenue guidance each quarter with the October 31, 2018 quarter revenue up 37%;
Most customers pay annually in advance. This means cash flow from operations is positive despite the company recording an operating loss;
Customers expand their use resulting in retained customers growing revenue faster than decreases from churned customers making net revenue retention over 100%;
International expansion remains a large opportunity as international is only 18% of revenue.
Picks 6 – 10: Major Trends that will surface in 2019
I developed my primary method of stock picking at my first Wall Street firm, Stanford Bernstein. The head of research there, Chuck Cahn, emphasized that you could get small wins by correctly determining that a stock would trade up on certain news like a new product, a big customer win, and beating consensus forecasts. But larger and more predictable wins of 5X or more were possible if one identified a long-term winner riding a major trend and stuck with it for multiple years. All 5 of my stock picks fall into the latter category. I’ve been recommending Facebook, Tesla, and Amazon for 4 years or more. All 3 are now over 5X from when I first targeted them as I bought Tesla at $46 and Facebook at $24 in 2013 (before this blog) and they have been in my top 10 since. Amazon was first included in 2015 when it was at $288/share. Stitch Fix and DocuSign are riskier but if successful have substantial upside since both are early in their run of leveraging their key trends.
The next 4 picks are in early stages of trends that could lead to current and next generation companies experiencing benefits for many years. The first two go hand in hand as each describes transformation of physical retail/restaurants, namely, replacing staff with technology in a way that improves the customer experience. This is possible because we are getting closer to the tipping point where the front-end investment in technology can have a solid ROI from subsequent cost savings.
Replacing Cashiers with technology will be proven out in 2019
In October 2015 I predicted that Amazon (and others like Warby Parker) would move into physical retail between then and 2020. This has occurred with Amazon first opening bookstores and then buying Whole Foods, and Warby Parker expanding its number of physical locations to about 100 by the end of 2018. My reasoning then was simple: over 92% of purchases in the U.S. were made offline. Since Amazon had substantial share of e-commerce it would begin to have its growth limited if it didn’t create an off-line presence.
Now, for Amazon to maintain a 20% or greater revenue growth rate it’s even more important for it to increase its attack on offline commerce (now about 90% of U.S. retail) I’m not saying it won’t continue to try to increase its 50% share of online but at its current size offline offers a greater opportunity for growth.
A key to Amazon’s success has been its ability to attack new markets in ways that give it a competitive advantage. Examples of this are numerous but three of the most striking are Amazon Cloud Services (where it is the industry leader), the Kindle (allowing it to own 70% share of eBook sales) and Prime (converting millions of customers to a subscription which in turn incentivized buying more from Amazon due to free shipping).
Now the company is testing an effort to transform brick and mortar retail by replacing staff with technology and in doing so improving the buying experience. The format is called Go stores and there are currently 5 test locations. Downloading the Amazon Go App enables the user to use it to open the automated doors. The store is stocked (I think by actual people) with many of the same categories of products as a 7-Eleven, in a more modern way. Food items include La Boulangerie pastries, sushi, salads, an assortment of sandwiches and even meal kits. Like a 7-Eleven, it also has convenience items like cold medicine, aspirins, etc. The store uses cameras and sensors to track your movements, items you remove from the shelves and even whether you put an item back. When you leave, the app provides you with a digital receipt. Not only does the removal of cashiers save Amazon money but the system improves customer service by eliminating any need to wait in line. I expect Amazon to open thousands of these stores over the next 3-5 years as it perfects the concept. In the future I believe it will have locations that offer different types of inventory. While Amazon may be an early experimenter here, there is opportunity for others to offer similar locations relying on third party technology.
Replacing Cooks, Baristas and Waitstaff with robots will begin to be proven in 2019
The second step in reducing physical location staff will accelerate in 2019. There are already:
Robotic coffee bars: CafeX opened in San Francisco last year, and in them one orders drip coffee, cappuccino, latte, or hot chocolate using an app on your phone or an iPad available at a kiosk. The coffee is made and served by a robot “barista” with the charge automatically put on your credit card. Ordering, billing, and preparation are automatic, but there is still one staff member in the shop to make sure things go smoothly.
The first robotic burger restaurant: Creator opened in San Francisco last June. It was in beta mode through September before opening to the general public. While a “robot” makes the burgers, Creator is not as automated as CafeX as humans prepare the sauces and prep the items that go into the machine. Creator also hasn’t automated ordering/payment. Startup Momentum Machines expects to open a robotic burger restaurant and has gotten substantial backing from well-known VCs.
Robots replacing waitstaff: For example, at Robo Sushi in Toronto, a “Butlertron” escorts you to your table, you order via an iPad and a second robot delivers your meal. Unlike the robots in the coffee bar and burger restaurant these are made into cute characters rather than a machine. Several Japanese companies are investing in robotic machines that make several of the items offered at a sushi restaurant.
Robotic Pizza restaurants: The furthest along in automation is the Pizza industry. Zume Pizza, a startup that uses robots to make pizzas, has recently received a $375 million investment from Softbank. Zume currently uses a mix of humans and robots to create and deliver their pizzas and is operational in the Bay Area. Pizza Hut and Dominos are working on drones and/or self-driving vehicles to deliver pizzas. And Little Caesars was just issued a patent for a robotic arm and other automated mechanisms used to create a pizza.
At CES, a robot that makes breads was announced. What all these have in common is replacing low end high turnover employees with technology for repetitive tasks. The cost of labor continues to rise while the cost of technology shrinks a la Moore’s Law. It is just a matter of time before these early experiments turn into a flood of change. I expect many of these experiments will turn into “proof points” in 2019. Successful experiments will generate substantial adoption in subsequent years. Opportunities exist to invest in both suppliers and users of many robotic technologies.
“Influencers” will be increasingly utilized to directly drive Commerce
Companies have long employed Influencers as spokespersons for products and in some cases even as brands (a la Michael Jordon and Stephan Curry basketball shoes or George Forman Grills). They appear on TV ads for products and sometimes used their social reach to tout them. Blogger, a prior Azure investment, understood how to use popular bloggers in advertising campaigns. But Blogger ads, like most TV ads did not directly offer the products to potential customers. Now we are on the verge of two major changes: tech players creating structured ways to enable fans of major influencers (with millions of followers) to use one-click to directly buy products; and technology companies that can economically harness the cumulative power of hundreds of micro-influencers (tens of thousands of fans) to replicate the reach of a major influencer. I expect to see strong growth in this method of Social Commerce this year.
The Cannabis Sector should show substantial gains in 2019
In my last post I said about the Cannabis Sector: “The industry remains at a very early stage, but numerous companies are now public, and the recent market correction has the shares of most of these at more reasonable levels. While I urge great care in stock selection, it appears that the industry has emerged as one to consider investing in.” Earlier in this post, I mentioned that riding a multi-year wave with a winning company in that segment is a way to have strong returns. I’m not knowledgeable enough regarding public Cannabis companies, so I haven’t included any among my stock recommendations. However, I expect industry wide revenue to grow exponentially. The 12 largest public Cannabis companies by descending market cap are: Canopy Growth Corp (the largest at over $11B), Tilray, Aurora Cannabis, GW Pharmaceuticals, Curealeaf Holdings, Aphria, Green Thumb Industries, Cronos Group, Medmen Enterprises, Acreage Holdings, Charlotte’s Web Holdings and Trulieve Cannabis.
I believe one or more of these will deliver major returns over the next 5 years. Last year I felt we would see good fundamentals from the industry but that stocks were inflated. Given that the North American Cannabis Index opened this year at 208 well down from its 2018 high of 386 investing now seems timely. I’ll use this index as the measure of performance of this pick.
2019 will be the Year of the Unicorn IPO
Many Unicorns went public in 2018, but this year is poised to be considerably larger and could drive the largest IPO market fund raising in at least 5 years. Disbelievers will say: “the market is way down so companies should wait longer.” The reality is the Nasdaq is off from its all-time high in August by about 15% but is higher than its highest level at any time before 2018. Investment funds are looking for new high growth companies to invest in. It appears very likely that as many as 5 mega-players will go public this year if the market doesn’t trade off from here. Each of them is a huge brand that should have very strong individual support. Institutional investors may not be as optimistic if they are priced too high due to the prices private investors have previously paid. They are: Uber, Lyft, Airbnb, Pinterest, and Slack. Each is one of the dominant participants in a major wave, foreshadowing substantial future revenue growth. Because information has been relatively private, I have less knowledge of their business models so can’t comment on whether I would be a buyer. Assuming several of these have successful IPOs many of the other 300 or so Unicorns may rush to follow.
Oh, what a difference a month or 3 makes! If only 2018 had ended earlier…
I’m sure I’m not the only one who would have liked 2018 results to have been as of November 30th (or even better, October 1st). My stock forecasts were looking a lot better on those dates (and if I were smarter, perhaps I would have taken some of the gains at that point). My average gain was over 34% on October 1st (versus the S&P being up 8.5%) and was still holding at +10% as of November 30th with the S&P ahead 2.4%. Unfortunately, the year includes a disastrous December and my 4 stock picks ended the year at a 6.6% average loss. Since stock picks are always relative to the market, I take some solace in minutely beating the performance of the S&P which was down 7.0% for the year, especially since I favor very high beta stocks.
Before reviewing each of my picks from last year, I would like to provide a longer term view of my performance as it has now been 5 years that I’ve published my blog’s stock picks. Even with a down year in 2018 my compound gain is 310% versus an S&P gain of 38% over the same period. This translates to an average annual gain of 25% per year which coincidently is the target I set in my book (published years ago and now out of print).
Table 1: Mike’s Annual Blog Stock Pick Performance (5 Years)
Unlike last year, I certainly cannot take a victory lap for my 10 forecasts as I missed on 3 of the 10 and barely beat the S&P for my average among my 4 stock picks (all of which will be included again in my 2019 top ten). I’ve listed in bold each of my 2018 stock picks and trend forecasts below and give a personal, and only modestly biased, evaluation of how I fared on each.
Tesla stock appreciation will continue to outpace the market (it opened the year at $312/share)
Tesla had an extraordinary Q3, 2018 as the model 3 launch showed how potent a player the company is becoming. In the quarter the Model 3 was the best selling car in the U.S. in terms of revenue and 5th highest by volume. This drove a greater than 100% revenue increase versus a year earlier and $1.75 in earnings per share versus a loss of $4.22 in the prior quarter. Given that the starting price for a model 3 was at $49,000, it is rather amazing that it could generate that volume of sales. Since the backlog for the Model 3 appears to remain at well over 300,000 cars and Tesla is closing in on a launch in Europe, Tesla seems assured of continued strong revenue through 2019 and likely beyond. However, much of the backlog is awaiting the lower priced (sub $40,000) version of the car which I believe will be available in Q2, 2019. As I had predicted, the Model 3 ramp up in production volume led to improved gross margins which exceeded 20% in the quarter. Despite the down market, Tesla stock was up about 7% in 2018. While we will continue recommending the stock, the phaseout of tax credits for buying an electric car has already begun. In its Q3 update Tesla stated that “better than expected Model 3 cost reductions is allowing us to bring more affordable options to the market sooner.” Yet, despite this forecast, the recently announced price decreases drove the stock down.
Facebook stock appreciation will continue to outpace the market (it opened the year at $182/share).
Facebook stock did not perform well in 2018, closing the year down 28%, making this pick a losing proposition last year. This comes despite revenue growth that should be between 35% and 40%, and net income that is tracking towards about 35% growth (despite a massive increase in SG&A to spur future results). What impacted the stock heavily was the plethora of criticism regarding privacy of user information coupled with the continuing charges of Russian usage to impact the election. Before the wave after wave of negative publicity the stock had reached a new high of $218/share in July. Because of the need to improve its reputation, Facebook is likely to continue to increase its spending to address privacy issues and to burnish its image. In summary, the fundamentals of the company remained quite sound in 2018 but the barrage of issues torpedoed the stock.
Amazon stock appreciation will outpace the market (it opened the year at $1188/share).
While its stock dropped considerably from its September high of $2050, Amazon remained one of the best market performers in 2018 closing the year at over $1500/share. The company continued to execute well, growing every part of its business. It also began to leverage its scale as net income grew considerably faster than revenue and is likely to be well over triple that of 2017. Growth should be lower in Q4 2018 than earlier in the year as Q4 2017 was the first quarter that included all revenue from the acquisition of Whole Foods. Since the analyst consensus forecast already reflects Whole Foods revenue being in Q4 last year, as well as concerns over Amazon maintaining strong performance in Q4, I would not be surprised if Amazon was able to beat expectations in Q4.
Stitch Fix stock appreciation will outpace the market (it opened the year at $25/share).
In my forecast I stated that this was my riskiest pick and it certainly proved the most volatile (which is saying a lot given the turbulence experience by Facebook, Tesla, and Amazon). I was feeling pretty smug when the stock reached a high of $52/share in September with a little over 3 months left in the year! Obviously, I was less sanguine as it dropped precipitously from September’s high to a low point of $17.09 by year’s end. I’m hoping that those of you who followed my advice trimmed back when the stock soared (I confess that I didn’t). The company continued to balance growth and profitability throughout the calendar year with October quarter revenue (up 24%) and earnings ($10.7 million up from $1.3 million in the prior year) both beating analyst expectations. Yet, concerns over user growth severely impacted the stock. I’m somewhat surprised by this as the users grew 22% and revenue 24% – since revenue beat expectations this means that analysts did not forecast an increase in average revenue per user. But the bottom line is, despite solid fundamentals the stock did not perform well.
The stock market will rise in 2018 (the S&P opened the year at 2,696 on January 2).
When I made this forecast, I pointed out that I’m not particularly good at forecasting the overall market. My belief was based on the fact that the tax cut for corporations would mean a rise in earnings that exceeded the norm. I felt stronger earnings growth would be enough to offset the risk of the longest bull market in history turning negative. I sited the likelihood of higher interest rates being an additional risk. The market almost made it through the year as it was still up heading into December, but the combination of 4 interest rate hikes in the year coupled with considerable criticism of President Trumps behavior was just too much for the market by December. I view this as a partial victory as I had all the fundamentals right and came within less than a month of being right for the year when many felt the bears would gain control in early 2018.
Battles between the federal government and states will continue over marijuana use but the cannabis industry will emerge as one to invest in.
During the year the legalization of marijuana for recreational use continued to increase on a state by state basis with the number increasing from 6 at the start of the year to 10 by years end. Use of medical marijuana is now legal in 33 states. Several other states, while not formally legalizing it have lowered restrictions on individual use. The industry remains at a very early stage, but numerous companies are now public, and the recent market correction has the shares of most of these at more reasonable levels. While I would urge great care in stock selection, it appears that the industry has emerged as one to consider investing in.
At least one city will announce a new approach to urban transport.
In this prediction I cited the likelihood that at least one city would commit to testing a system of small footprint automated cars on a dedicated route (as discussed in our post on December 14, 2017) as this appears to be a more cost effective solution than rail, bus, Uber, etc. Kyoto has now announced that it signed an agreement to test the system offered by Wayfarer and the company is now out of stealth mode. Wayfarer expects to provide substantial capacity at a fraction of the cost of other alternatives: both in the initial cost of the infrastructure/equipment and the annual cost of running the system. Of course, once there is a live installation in Kyoto or one of their other prospective customers, the validity of this system will be authenticated (or not).
Offline retailers will increase the velocity of moving towards omnichannel.
This forecast discussed both acquisitions of e-commerce companies by offline retailers (with Walmart leading the way) and introducing more online technology in physical stores. Walmart did continue its online buying spree in 2018 with major acquisitions of Art.com, Bare Necessities, Eloquii, Cornershop and Flipkart (the largest at $16 billion). In the case of the acquisitions that are online brands, Walmart intends to introduce these into their physical stores and continue to sell them online. Nordstrom has also moved further to integrate its online and offline business by taking valuable floor space in stores and repurposing it for online buyers to pick up and try on clothes they have purchased online. By placing the location in a very prominent spot, I’m sure Nordstrom is thinking it will help spur more customers to buy online. By having in store locations for picking up and trying on, Nordstrom should reduce returns, lower the cost of shipping, and bring additional customers into their stores (who otherwise might not visit them).
Social Commerce will begin to emerge as a new category
Recall that social commerce involves the integration of social media with commerce through tactics like:
A feed-based user experience
Having friends’ actions impact one’s feed
Following trend setters to see what they are buying, wearing, and/or favoring
One click to buy
Now, about 25% – 30% of shoppers say that social platforms like Pinterest, Instagram, Facebook and Snapchat have influence over their purchases. On June 28, 2018 Snapchat began a program for its influencers to use Social Commerce through a tool that allows users to view a video from the influencer and then to swipe up on a product shown in the video to buy it. In September, The Verge reported that Instagram is developing a new app for social commerce. Pinterest and Facebook have been in the social commerce fray longer and have increasing success. It appears that 2018 was the year the social commerce wars accelerated.
“The Empire Strikes Back”: automobile manufacturers will begin to take steps to reclaim use of its GPS.
Carmakers face a serious problem regarding their built-in navigation systems. Consumers are forced to pay hundreds of dollars for them and then use free apps on their phones like Waze or Google maps instead. This does not endear them to consumers. The problem is that carmakers are not great at software design but have been reluctant to use third party providers for their GPS and entertainment. Now, the Renault-Nissan-Mitsubishi Alliance has agreed to design Google’s Android OS, including Google navigation, into their next generation cars expected starting in 2021. This is a win for users as that will provide a competent GPS that utilizes the existing screen in cars as opposed to having to rely on your phone app for navigation.
In another win for consumers, Amazon and Telenav (a connected car and location based services provider) announced a significant partnership today, January 7, 2019. As part of it, Amazon’s voice assistant will now be part of Telenavs in-car navigation systems. With this included, Telenav’s next generation system will enable its customers, like General Motors, to provide a “smart assistant” thereby making the system included with cars the one to use rather than one’s phone apps.
Stay tuned for my top ten predictions for 2019…but remember that I have already said the 4 stocks recommended for 2018 will remain on the list.
My December 2016 post analyzed the Trump deal to retain Carrier workers in the United States and concluded it was positive for the country and for the state of Indiana. It saved 800 jobs and had a payback to the government of more than 14X their investment. I was clear in the post that I hadn’t voted for Trump and consider myself an independent. While I remain an independent, the opportunity to analyze the recently announced deal to get Amazon to commit 25,000 – 40,000 jobs for New York City is irresistible to me as my conclusions will be in support of politicians on the opposite side of the spectrum from Trump: New York Mayor Bill de Blasio and Governor Andrew Cuomo. I believe that:
Analysis of benefits and drawbacks of any major negotiation should be politically independent.
Unfortunately, this has become less and less the case given the divisive politics that we have in our country. What was shocking to me in this case was that some members of their own party (Democrats), heavily criticized de Blasio and Cuomo.
Major Assumption: Jobs are good for a City/State if the cost to government is reasonable
One of the major responsibilities of a political leader is improving the economy in their State/City. The crux of the discussion is really the question: ‘what is a reasonable cost’ for doing so? On one hand, it can be measured in pure cash flow of moneys paid to Amazon (or any other entity a government wants to attract) versus the cash the government will receive from additional tax dollars. On the other hand, there are other factors that benefit or degrade life in the community. Since the former is more measurable, I’ll start with that.
What are the Actual Out-of-Pocket dollars New York City (NYC) and New York State (NYS) will give to Amazon?
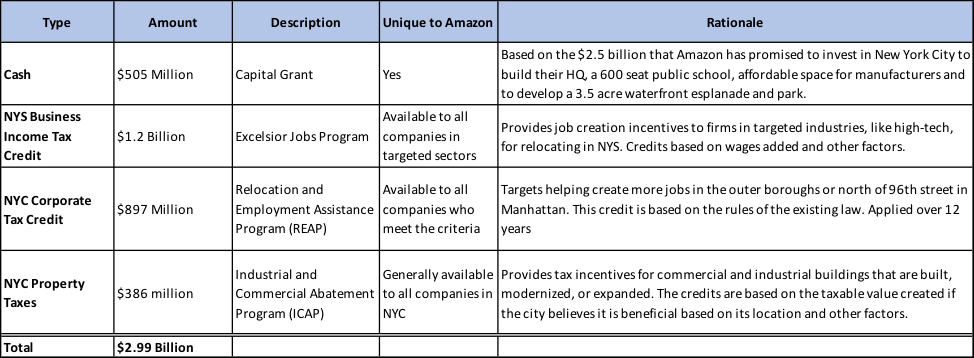
I can’t tell if its rhetoric or a lack of clear communication, but many detractors, like state Senator Michael Gianaris, are saying “We’ve got $3 billion dollars to spend, how would you spend it? Amazon would be very low on the list of where that money would go.” To be blunt, this is a ridiculous comment. NYC is spending zero dollars in cash and while the state is providing $505 million of actual cash as a capital grant, far more money will flow back to it. The Capital grant is based on $2.5 billion that Amazon has promised to invest in New York City (to build their HQ, a 600-seat public school, affordable space for manufacturers and to develop a 3.5-acre waterfront esplanade and park).
The rest of the $3 billion falls into 3 incentive programs that have existed for many years to help woo companies to NYS. They are:
The Excelsior Jobs Program was created in 2010 to replace the expiring Empire Zone Program. Like the prior program, it’s objectives are to provide job creation incentives to firms in targeted industries, like high-tech, for relocating in NYS. The credits are based on the wages added and several other factors. This program, which is available to all companies in the targeted sectors, will generate $1.2 billion in state business income tax credits for Amazon if it meets its commitments.
The Relocation and Employment Assistance Program (REAP), first established in 2003, targets creating jobs in parts of the city more in need of them, rather than adding to the heavy cluster in downtown and midtown Manhattan, namely the outer boroughs or north of 96th street in Manhattan. The tax credits generated from this program total $897 million and can be used towards reducing Amazon’s New York City corporate taxes over 12 years. This credit is based on the rules of the existing law.
The Industrial and Commercial Abatement Program (ICAP), which replaced a prior program, created in 2008, provides tax incentives for commercial and industrial buildings that are built, modernized, or expanded. The credits are based on the taxable value created if the city believes it is beneficial based on its location and other factors. This program is generally available and the $386 million in credits are directly tied to the rules of the law.
Table 1: Benefits to Amazon from NYS and NYC
It is important to note most of the benefits to Amazon are “as of right”, so any company can get them. Since these programs scale based on the number of employees or the amount of capital investment, the sheer size of the Amazon commitment creates a “sticker shock” given the associated benefits. The 3 programs were not created for Amazon but have been in existence for years to encourage job creation and industrial development in targeted areas. The credits under REAP and ICAP appear to be as mandated by those programs and not discretionary. It’s harder for me to tie the state tax abatement amount granted under the Excelsior program (by the state) to the law, but the calculation appears to follow it with some judgement in the cap of what is awarded. The capital grant seems to be the only discretionary part of the package and is the only portion that involves out of pocket dollars from the state (the city will not provide any cash incentives).
Could New York Have won the HQ with lesser incentives?
Given the large return on investment to NYC and NYS, the only question in my mind is whether they could have succeeded with even less incentives and generated an even greater return! A whitepaper by Reis, an analytic company for real estate evaluation, judged New York City as a top candidate without considering incentives offered to Amazon. It’s difficult to judge whether New York City would have been chosen with reduced incentives. On the one hand it has the best public transportation, strong cultural advantages, and several great Universities (as a source of employees), especially the new Cornell-Technion campus located directly next to Amazon’s HQ2 location. On the other hand, it is a very expensive place to do business which is why these incentive programs were created to begin with. As a basis of comparison, consider the bundle of incentives Wisconsin offered to get the Taiwanese technology company Foxconn to build a U.S. plant there. For the 13,000 jobs (at an average annual wage of $53,000) that Foxconn has committed to, Wisconsin plus the County and local village have provided about $3.8 billion in tax credits and breaks. The taxable wages in NY will be 6-9 times as much and the incentives are lower. Therefore, I suspect other locations offered Amazon incentives at the same or a greater level as those from New York.
How Does Revenue to the City and State Compare to the out of pocket cost?
I’m going to make the following assumptions:
New York State Corporate Tax is 6.5% and NYC is 8.85% but I’m assuming the business tax incentives from Excelsior and REAP will be sufficient to preclude Amazon paying any incremental taxes to NYC or NYS (above what they currently pay) for the 12 years they apply. Subsequently, there should be substantial incremental taxes for the additional 8 years of the time horizon I’m using. Since I’m not including this income flow to the city and state, there is considerable upside to my calculations.
The PILOT program payments, estimated by Deputy Mayor Alicia Glen, at $600 to $650 million are the only real estate taxes Amazon will pay. I’m not sure what it would have been without the ICAP credit but the range for the PILOT program amount appears to be known.
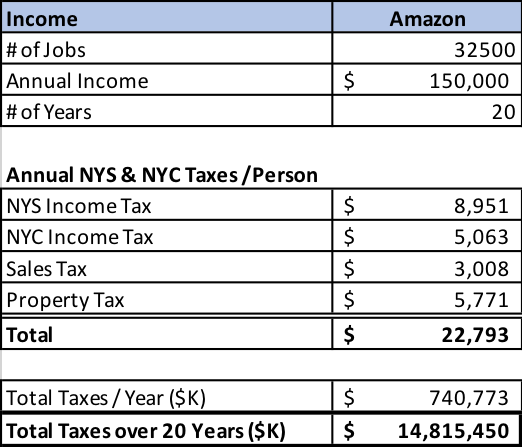
NYS and/or NYC will benefit from income, sales and property taxes on employees hired by Amazon and taxes on any additional jobs that get created because of Amazon. I’ll assume taxes are on full wages but that employees have no other income (like interest, capital gains, etc.) and all individuals are single. This puts my model for some who are married without a working spouse at higher taxes then they will pay, but my estimates will be too low for those with a working spouse or any with other sources of income. For this purpose, I’ll use the initial 25,000 jobs plus half of the additional 15,000 (32,500) as the average number over a 20 year period. Since the incremental employment should average longer, that seemed a conservative average to use. I’ll also use an average starting salary of $150,000 for the future Amazon employees as that has been in the announcement. As another assumption, to keep my calculations below what should occur, I haven’t assumed any increases in salary. Even a 4% increase per year would cause salaries to more than double by the end of the 20 years (and NYS and NYC income taxes grow by even more). Since those involved in the project would likely have wage increases over time their income and other taxes would be considerably higher than those based on my assumptions. This coupled with the fact that the negotiators for NYC and NYS used 25 years as the horizon, means their tax calculations will be considerably higher (and more accurate) than mine for the direct employees.
I used the website Smart Asset calculator to generate estimates of NYS and NYC Income tax, sales tax, and property tax per year for each income level. As stated before, the actual numbers will be higher because many of these individuals will have other sources of income, a working spouse and will have salaries escalating over time. Table 2 shows the totals for these estimated taxes to be nearly $15B.
Table 2: NYS & NYC Tax Impact from Amazon HQ
Scholars have found strong evidence of the presence of a local multiplier effect. These come from the direct employees hired, indirect jobs created from suppliers and partners and induced jobs that are a result of the spending of the direct and indirect jobs as well as each layer of induced jobs. For example, a noted scholar on the subject, Enrico Moretti, determined that when Apple Computer was employing 12,000 workers locally, an additional 60,000 jobs were created. These included 36,000 unskilled positions like restaurant or retail workers, and 24,000 skilled jobs like lawyers or doctors. If I assume this 5 to 1 ratio would hold for the highly paid Amazon workers, then 32,500 technology jobs would generate 162,500 more jobs in NYC! Based on the Apple example, 60% of these would be unskilled and 40% highly skilled. Assuming an average salary of $35,000 for the unskilled, an average of $100,00 for half of the skilled and $150,000 for the other half, taxes generated from the multiplier effect over the 20 years would be over $28 billion.
The $2.5 billion Amazon has committed to spend on capital projects would in turn generate further jobs in construction and an associated multiplier impact, but since this is a temporary benefit over 2-5 years, I have omitted it from the analysis.
The $43 billion estimated total of these income streams to the city and state assume the tax abatements cause no incremental corporate taxes from Amazon. While Amazon will be paying rent on the land leased from the city, I also left out this benefit as I couldn’t estimate the amount. While I believe the actual benefit could be higher, consider that even if I’m off by 75% on the multiplier effect, the total would still be over $22 billion and the payback about 44X the $505 million cash outlay!
Other Benefits and Negatives of Attracting Amazon
There are a variety of more difficult factors to analyze than the straight forward financial windfall the city and state will get from this agreement. Living in the San Francisco Bay Area has taught me that what I may view as obvious might not be so to others. Becoming the Florence of the Tech World has meant that the Bay Area is incredibly wealthy, in turn generating a huge tax base for government to use to fund helping the homeless, stem research and many other perceived public good initiatives. Attracting 25,000 – 40,000 technology jobs will vault New York City into a clear contender for tech community leadership. It will lead to others following and to the creation of more startups, one or two who could become the next Amazon, Apple, Google, Facebook, or Microsoft (generating more jobs and more tax income to NYC and NYS). This is not universally celebrated in the Bay Area as it also has led to traffic congestion, higher housing prices, and increased cost of entertainment. But It has meant increased employment opportunities across the full spectrum of jobs. However, an average worker, while making more than elsewhere, can find it a difficult place to afford. In New York City these issues are partly offset for those renting apartments due to rent control and rent stabilization as over 50% of all rental units are under some form of regulation.
New York City is large enough to be able to absorb 25,000 to 40,000 workers relatively easily, but it could add to the problems for the already strained subway system. I believe it’s no accident that Amazon chose a location near the water so that its employees could take advantage of the new, highly praised, NYC Ferry system. While many of the workers may choose to live near the Amazon facilities, some may decide to buy houses in locations that require utilizing mass transit. If I were to guess, I would say a portion of the increased cash flow, to the city will be used to improve the subway system, Long Island Railroad and to add more Ferries each of which will benefit all New Yorkers.
Conclusion: The Amazon Agreement for HQ2 to be in NYC is a Huge Positive for NYC and NYS
While detractors may nitpick at the deal, it has a great ROI for the City and State, will increase employment, provide revenue to improve mass transit and follows incentives mandated by existing laws. Clearly a coup for Mayor de Blasio and Governor Cuomo.
Soundbytes
The SF Chronicle published an article on November 28, 2018 touting Stephan Curry’s strong credentials as a possible MVP this year. In it they used several of the statistics we discussed a year ago. Namely, how much better his teammates shoot when they play with Curry and his amazing plus/minus.
Sticking with sports, I can’t help ruminating on how the NFL keeps shooting itself in the foot. I won’t comment on the latest unsavory incidents among players towards women or the Kaepernick fiasco. Instead, I keep thinking about what to call the team about to leave Oakland:
Oakland Raiders, their current name
Oakland Traders, given their propensity to exchange top players for draft choices
Oakland Traitors, trading away their best current players, which has insured a terrible season – thus completing the betrayal of the City of Oakland and the most loyal and colorful fan base in the league
This post is the third in my series on Key Performance Indicators (KPIs), with a heavy emphasis on contribution margin (CM). Previously, I analyzed why CM is such a strong predictor of success. Given that, companies should consistently look at ways of improving it while still maintaining sufficient growth in their business.
In Azure’s recent full day marketing seminar for our consumer (B2C) focused companies, my session highlighted 6 methods of improving CM:
Increase follow-on sales from existing customers
Raise the average invoice value of the initial and subsequent sales to a customer
Increase GM (Gross Margin) through price increases
Increase GM by reducing cost of goods sold (COGs)
Reduce Blended CAC (cost of customer acquisition) by increasing free or very low cost traffic
Decrease marketing spend as a % of revenue
Before drilling down on each of these I want to define several key terms that will be used throughout the discussion:
Contribution Margin = GM – Marketing/Sales Costs – other cost that vary with sales
Paid CAC = Market Spend/New Customers acquired through this spend
Blended CAC = Market Spend/All new customers
CAC Recovery Time (CAC RT) = the number of months until variable profit on a customer equals CAC
LTV/CAC = Life Time Value (LTV) of a customer/CAC
I will now review each of these strategies and provide some thoughts on how to activate these in consumer-facing businesses:
1. Increase Follow-On sales from existing customers
Since existing customers have little or no cost associated with getting them to buy, this will decrease blended CAC, increasing CM.
Increasing customer retention through improvements in customer care, more interesting and more targeted emails to a customer, or launching a subscription of one kind or another can all help.
On the first point here is an email I received shortly after subscribing to Harry’s, that I thought did an excellent job at engaging me with their customer support, increasing my likelihood to keep my subscription active:
Hi there,
My name is Katie, and I’m a member of the Harry’s team. I wanted to reach out and say thanks for supporting Harry’s.
You are important to us, and I am here to personally help you however I can to make your Harry’s experience as smooth as possible – both literally and figuratively. Please don’t hesitate to reach out with any thoughts or questions about your Harry’s products or Shave Plan, or just life in general. (And just a reminder that your next box is scheduled to ship on October 27th.) Thanks again for your support, and I hope to speak soon!
All the best, Katie
On the subscription concept, think about Amazon Prime. How many of you buy more frequently from Amazon because of being a prime member?
Add to product portfolio. By giving your customers more options of what to buy (all within the concept of your brand) customers are given the opportunity to spend more often.
Make sure your emails are interesting. This will increase the open rate and drive more follow on sales. If all your emails are about discounting your product, then customers will have less interest in opening them and your brand will be devalued. I’ve received emails from numerous sites that say an X% discount is available until a certain date, and then when that date passes, I receive a new offer that is the same or sometimes better. The most frequently opened emails have headers and content that creates interest beyond whatever products you sell. A/B test different headers and different content. It doesn’t matter how small or large you are or how many emails you send, it always pays to try different variations to increase open rates and conversion. Experiment with different messaging to different customer segments like those who purchased recently, those who “liked” an item, those that have never purchased, etc.
Build a Community of your customers. The more you can get customers engaged with you and with each other, the more committed to you they become and the longer they are retained. Think through how you can build an active community among your users through shared photos, videos, chatting, podcasts or events. Most of this should not involve trying to push new purchases but engaging your community to interact with you and each other.
2. Raise the average invoice value of the initial and subsequent sales to a customer
Since shipping costs will not increase proportionately, this will raise GM dollars and therefore CM.
Increase pricing. Most startups underprice their product thinking that will increase market adoption. Even some of the largest companies in the world have found there was ample room to increase prices. Thinking differently, Apple upped prices to over $1,000 for an iPhone. And then increased it again to $1,349 for the top of the line product. Five years ago, how many of you thought people would pay over $1,000 for a cell phone? This shows that unless you A/B test different price points you have no idea whether a price increase is the right strategy.
Upsell logical add-on products. While trying to get a customer to add to their shopping cart may seem obvious, many companies do not do this on a consistent basis. Some examples of ones that have: a flower company added vases to the offer, a mattress company added pillows and sheets; a subscription razor company added shaving gel; a cell phone company added a case. All of these led to reasonable attach rates of the add-on product and higher average invoice value. Testing what you could add to generate upsell should be a constant process.
“Selling” value added services is another form of upsell. This could include things like concierge customer service, service contacts, premier membership with benefits like: invites to special events, early access to new products, reduced shipping cost, preferred discounts on products, etc. If you get your customers to engage in one or more services, you will significantly increase their connection to your product and likely increase retention.
3. Increase Gross Margin through price Increases
Surprisingly, sometimes higher prices position a product as premium (having more value) and generate increased unit sales. Often higher prices generate more revenue even when fewer unit sales result. What may be counter intuitive is that GM$ can increase even if revenue declines. For example, suppose a company has COGs of $50 for a product and is currently pricing it at $100. If a price increase of 20% causes 20% lower unit sales, revenue would decline by 4% while GM$ would increase 12%. Higher gross margin dollars provide more ability to spend on marketing.
4. Improving GM by reducing COGs
Better Pricing: When your volume increases, ask for better pricing from suppliers. Just as its important to price test regularly, its also important to talk to multiple potential suppliers of your parts/product. An existing supplier may not be eager to voluntarily offer a price discount that goes with increased volume but is more likely to do so if it knows you are checking with others.
Changing Packaging: Packaging should be re-examined regularly as improvements may help customer retention. But it also may be possible to lower the cost of the packaging or to change it in a way that lowers shipping costs since that may be based on the size of the box rather than weight.
Shipping Costs: Lower shipping cost per $ of revenue (increasing GM and CM) by generating larger orders. In addition to upsell, this can be done by offering better discounts if the order size is larger. One site I have purchased from offers 10% discount if your net spend (after discount) is over $100, 15% if over $150 and 20% if over $200. Getting to the highest discount lowers the price of the product by enough to motivate buyers (including me) to try to buy over $200 in merchandise. The extra revenue creates incremental product margin dollars and decreases shipping cost as a percentage of revenue. This in turn increases GM$.
For a subscription company this can be done by scheduling less frequent (larger) deliveries. The shipping cost of the larger order will be a much smaller percent of revenue, raising GM.
Opening a Second distribution center to reduce shipping cost. Orders shipped from a west coast distribution center to an east coast customer will have 5 zone pricing. By having a second distribution center in a place like Columbus, Ohio (a frequently used location) those same orders will usually be 1 zone, sometimes 2 zone pricing, resulting in substantial savings per order. The caveat here is that a company needs enough volume for the total savings on orders to exceed the fixed cost of a second distribution center.
5. Improving CM by driving “free” or “nearly free” traffic
The higher the proportion of free or inexpensive traffic to total traffic, the lower the blended CAC.
Improving SEO (search engine optimization). I’ve learned from SEO experts that optimizing SEO is not free, but rather very low cost compared to paid traffic. Our previous post walks through some of the science involved in making improvements. I would suggest using an SEO consultant as it is likely to lead to far better results.
Convert a visitor not ready to buy to an email recipient. If you do that than you will have subsequent opportunities to market to her or him. A slightly costlier version of this is to use remarketing to woo visitors who came to your site but didn’t buy. While using remarketing (advertising) has a cost, it is usually much lower CAC than other methods.
Produce emails that get forwarded and go viral. Such emails need to motivate recipients to forward them due to being very funny, of human interest, etc. While there is typically a product offering embedded in them, the header emphasizes the reason to read it. One Azure portfolio company, Shinesty, recently had an email that was opened by about 7X the number of people it was initially sent to. That generated a lot of potential customers without spending extra marketing dollars. Engaging emails has enabled Shinesty to maintain high CM and high growth.
Use social networking to generate incremental customers. Having the right posts on a social network like Instagram can lead to new potential customers finding out about you and lead to additional sales.
Optimize Customer Retention. Or as my good friend Chris Bruzzo (CMO of EA) spoke about at the Azure Marketing conference: “Love the ones you’re with.” Existing customers are usually the largest source of “free” buyers in a period. The longer you retain a customer, the more repeat buyers you have, increasing contribution margin. So, it’s imperative to take great care of your existing customers.
Drive PR. Like SEO, there is some cost involved in this but if you are judicious in any agency spend and thoughtful in creating news worthy press releases this can be a great source of traffic at a modest cost. However, I recommend you try to understand what you are getting from PR because I have seen situations where the spend did not produce meaningful results.
6. Decrease Marketing Spend as a % of Revenue.
The CAC Recovery Time plays a major role in how to manage your market spend to balance growth and burn. For example, if CAC Recovery Time is one month, spending more will not drive up burn appreciably. If it takes more than a year to recover your CAC, moderating market spend is critical to achieving a reasonable CM. If you recoup CAC faster, you can invest more quickly in the next round of customers. In the consumer space, I won’t invest in a company that has a long (a year or more) CAC Recovery Time as customers are likely to churn in an average of 2-3 years, making it difficult to achieve a reasonable business model. For B2B company’s customer longevity tends to be much longer, and the LTV/CAC can be 5X or more even if CAC Recovery Time is a year.
When a company decreases its market spend as a % of revenue it may experience lower growth but better CM. However, many companies have waste in their marketing spend so it’s important to measure the efficacy of each area of spend separately and to eliminate programs with a low return. This will allow you to reduce the spend with minimal impact on growth rates. There is a balance needed to try to optimize the relationship between CM and revenue growth as higher burn requires raising money more frequently and can put your company at risk. On the other hand, a company generating $1M in revenue needs to be growing at 100% or more to warrant most VCs to consider investing. Since CM should improve with scale, spending more on marketing may be a viable strategy for early stage companies. Once a company reaches $10M in revenue, annual growth of 50% will get it to $76M in revenue in 5 years so such a company should consider better CM rather than driving much higher growth rates and continuing to burn excessive cash.
In summary, Contribution Margin is the lifeblood of a company. If it is weak, the company is likely to fail over time. If it is strong and revenue growth is high, success seems likely. Improving CM is an ongoing process. I realize many of you probably feel much of what I’ve said is obvious, but my question is:“How many of these suggestions are you already doing on a regular basis?”
While you may be using several of the suggestions in this post, I encourage you to try more and to also double down where you can on the ones you already are trying. The results will make your company more valuable!
SoundBytes
I just want to remind readers that my collaborator on my blog posts, Andrea Drager, doesn’t typically take a bow for her significant contributions. Also, in this post, Chris Bruzzo added several improvements that have been incorporated. So many thanks to Andrea and Chris.
Can’t help but comment on the start to the NBA season. Not surprisingly, the Warriors are off to a great start with Curry and Durant leading the way. Greene and Thompson now have moved close to their usual contribution so I’m hopeful that the team can keep up its current pace.
What surprised me early on was the lack of recognition that both Toronto and San Antonio would be greatly improved. Remember, while San Antonio lost Kawhi, he only played a few games last year so with the addition of DeRozan should improve and once again reach the playoffs. For Toronto the change to Kawhi is a marked improvement placing them very competitive with the Celtics for eastern leadership.
I also feel it necessary to comment on the “Las Vegas” Raiders. I call them that already as they have shown zero regard for Oakland fans. While commentators have criticized their trading of all-star level players for draft choices, this is precisely on-strategy. When they get to Vegas they want a brand-new set of rising stars that the new fan base can identify with (using the numerous first round draft choices they traded for), and they don’t mind having the worst record in the league while still in Oakland. I believe Oakland fans should stop attending games as a response. I also think the NFL continues to shoot itself in the foot, allowing one of the most loyal and visible fan bases in the league to once again be abandoned
In the last post I concluded with a brief discussion of Contribution Margin as a key KPI. Recall:
Contribution Margin = Variable Profits – Sales and Marketing Cost
The higher the contribution margin, the more dollars available towards covering G&A. Once contribution margin exceeds G&A, a company reaches operating profits. For simplicity in this post, I’ll use gross margin (GM) as the definition of variable profits even though there may be other costs that vary directly with revenue.
The Drivers of Contribution Margin (CM)
There is an absolute correlation between GM percent and CM. Very high gross margin companies will, in general, get to strong contribution margins and low gross margin companies will struggle to get there. But the sales and marketing needed to drive growth is just as important. There are several underlying factors in how much needs to be spent on sales and marketing to drive growth:
The profits on a new customer relative to the cost of acquiring her (or him). That is, the CAC (customer acquisition cost) for customers derived from paid advertising compared to the profits on those customers’ first purchase
The portion of new traffic that is “free” from SEO (search engine optimization), PR, existing customers recommending your products, etc.
The portion of revenue that comes from repeat customers
The Relationship Between CAC and First Purchase Profits Has a Dramatic Impact on CM
Suppose Company A spends $60 to acquire a customer and has GM of $90 on the initial purchase by that customer. The contribution margin will already be positive $30 without accounting for customers that are organic or those that are repeat customers; in other words, this tends to be extremely positive! Of course, the startups I see in eCommerce are rarely in this situation but those that are can get to profitability fairly quickly if this relationship holds as they scale.
It would be more typical for companies to find that the initial purchase GM only covers a portion of CAC but that subsequent purchases lead to a positive relationship between the LTV (life time value) of the customer and CAC. If I assume the spend to acquire a customer is $60 and the GM is $30 then the CM on the first purchase would be negative (-$30), and it would take a second purchase with the same GM dollars to cover that initial cost. Most startups require several purchases before recovering CAC which in turn means requiring investment dollars to cover the outlay.
Free Traffic and Contribution Margin
If a company can generate a high proportion of free/organic traffic, there is a benefit to contribution margin. CAC is defined as the marketing spend divided by the number of new customers derived from this spend. Blended CAC is defined as the marketing spend divided by all customers who purchased in the period. The more organically generated and return customers, the lower the “blended CAC”. Using the above example, suppose 50% of the new customers for Company A come from organic (free) traffic. Then the “blended CAC“ would be 50% of the paid CAC. In the above example that would be $30 instead of $60 and if the GM was only $30 the initial purchase would cover blended CAC.
Of course, in addition to obtaining customers for free from organic traffic, companies, as they build their customer base, have an increasing opportunity to obtain free traffic by getting existing customers to buy again. So, a company should never forget that maintaining a persistent relationship with customers leads to improved Contribution Margin.
Spending to Drive Higher Growth Can Mean Lower Contribution Margin
Unless the GM on the first purchase a new customer makes exceeds their CAC, there is an inverse relationship between expanding growth and achieving high contribution margin. Think of it this way: suppose that going into a month the likely organic traffic and repeat buyers are somewhat set. Boosting that month’s growth means increasing the number of new paid customers, which in turn makes paid customers a higher proportion of blended CAC and therefore increases CAC. For an example consider the following assumptions for Company B:
The GM is $60 on an average order of $100
Paid CAC is $150
The company will have 1,000 new customers through organic means and 2,000 repeat buyers or $300,000 in revenue with 60% GM ($180,000) from these customers before spending on paid customers
G&A besides marketing for the month will be $150,000
Last year Company B had $400,000 in revenue in the same month
The company is considering the ramifications of targeting 25%, 50% or 100% year-over-year growth
Table 1: The Relationship Between Contribution Margin & Growth
Since the paid CAC is $150 while Gross Margin is only $60 per new customer, each acquired customer generates negative $90 in contribution margin in the period. As can be seen in Table 1, the company would shrink 25% if there is no acquisition spend but would have $180,000 in contribution margin and positive operating profit. On the other end of the spectrum, driving 100% growth requires spending $750,000 to acquire 5,000 new customers and results in a negative $270,000 in contribution margin and an Operating Loss of $420,000 in the period. Of course, if new customers are expected to make multiple future purchases than the number of repeat customers would rise in future periods.
Subscription Models Create More Consistency but are not a Panacea
When a company’s customers are monthly subscribers, each month starts with the prior month’s base less churn. To put it another way, if churn from the prior month is modest (for example 5%) then that month already has 95% of the prior months revenue from repeat customers. Additionally, if the company increases the average invoice value from these customers, it might even have a starting point where return customers account for as much revenue as the prior month. For B-to-B companies, high revenue retention is the norm, where an average customer will pay them for 10 years or more.
Consumer ecommerce subscriptions typically have much more substantial churn, with an average life of two years being closer to the norm. Additionally, the highest level of churn (which can be as much as 30% or more) occurs in the second month, and the next highest, the third month before tapering off. What this means is that companies trying to drive high sequential growth will have a higher % churn rate than those that target more modest growth. Part of a company’s acquisition spend is needed just to stay even. For example, if we assume all new customers come from paid acquisition, the CAC is $200, and that 15% of 10,000 customers churn then the first $300,000 in marketing spend would just serve to replace the churned customers and additional spend would be needed to drive sequential growth.
Investing in Companies with High Contribution Margin
As a VC, I tend to appreciate strong business models and like to invest after some baseline proof points are in place. In my last post I outlined a number of metrics that were important ways to track a company’s health with the ratio of LTV (life time value) to CAC being one of the most important. When a company has a high contribution margin they have the time to build that ratio by adding more products or establishing subscriptions without burning through a lot of capital. Further, companies that have a high LTV/CAC ratio should have a high contribution margin as they mature since this usually means customers buy many times – leading to an expansion in repeat business as part of each month’s total revenue.
This thought process also applies to public companies. One of the most extreme is Facebook, which I’ve owned and recommended for five years. Even after the recent pullback its stock price is about 7x what it was five years ago (or has appreciated at a compound rate of nearly 50% per year since I’ve been recommending it). Not a surprise as Facebook’s contribution margin runs over 70% and revenue was up year/year 42% in Q2. These are extraordinary numbers for a company its size.
To give the reader some idea of how this method can be used as one screen for public companies, Table 2 shows gross margin, contribution margin, revenue growth and this year’s stock market performance for seven public companies.
Table 2: Public Company Contribution Margin Analysis
Two of the seven companies shown stand out as having both high Contribution Margin and strong revenue growth: Etsy and Stitch Fix. Each had year/year revenue growth of around 30% in Q2 coupled with 44% and 29% contribution margins, respectively. This likely has been a factor in Stitch Fix stock appreciating 53% and Etsy 135% since the beginning of the year.
Three of the seven have weak models and are struggling to balance revenue growth and contribution margin: Blue Apron, Overstock, and Groupon. Both Blue Apron and Groupon have been attempting to reduce their losses by dropping their marketing spend. While this increased their CM by 10% and 20% respectively, it also meant that they both have negative growth while still losing money. The losses for Blue Apron were over 16% of revenue. This coupled with shrinking revenue feels like a lethal combination. Blue Apron stock is only down a marginal amount year-to-date but is 59% lower than one year ago. Groupon, because of much higher gross margins than Blue Apron (52% vs 35%), still seems to have a chance to turn things around, but does have a lot of work to do. Overstock went in the other direction, increasing marketing spend to drive modest revenue growth of 12%. But this led to a negative CM and substantially increased losses. That strategy did not seem to benefit shareholders as the stock has declined 53% since the beginning of the year.
eBay is a healthy company from a contribution margin point of view but has sub 10% revenue growth. I can’t tell if increasing their market spend by a substantial amount (at the cost of lower CM) would be a better balance for them.
For me, Spotify is the one anomaly in the table as its stock has appreciated 46% since the IPO despite weak contribution margins which was one reason for my negative view expressed in a prior post. I think that is driven by three reasons: its product is an iconic brand; there is not a lot of float in the stock creating some scarcity; and contribution margin has been improving giving bulls on the stock a belief that it can get to profitability eventually. I say it is an anomaly, as comparing it to Facebook, it is hard to justify the relative valuations. Facebook grew 42% in Q2, Spotify 26%; Facebook is trading at a P/E of 24 whereas even if we assume Spotify can eventually get to generating 6% net profit (it currently is at a 7% loss before finance charges and 31% loss after finance charges, so this feels optimistic) Spotify would be trading at 112 times this theoretic future earnings.
SoundBytes
I found the recent controversy over Elon Musk’s sharing his thoughts on taking Tesla private interesting. On the one hand, people want transparency from companies and Elon certainly provides that! On the other hand, it clearly impacted the stock price for a few days and the SEC abhors anything that can be construed as stock manipulation. Of course, Elon may not have been as careful as he should have been when he sent out his tweet regarding whether financing was lined up…but like most entrepreneurs he was optimistic.
In working with early stage businesses, I often get the question as to what metrics should management and the board use to help understand a company’s progress. It is important for every company to establish a set of consistent KPIs that are used to objectively track progress. While these need to be a part of each board package, it is even more important for the executive team to utilize this for managing their company. While this post focuses on SaaS/Subscription companies, the majority of it applies to most other types of businesses.
Areas KPIs Should Cover
P&L Trends
MRR (Monthly Recurring Revenue) and LTR (Lifetime Revenue)
CAC (Cost of Customer Acquisition)
Marketing to create leads
Customers acquired electronically
Customers acquired using sales professionals
Gross Margin and LTV (Life Time Value of a customer)
Marketing Efficiency
Many companies will also need KPIs regarding inventory in addition to the ones above.
While there may be very complex analysis behind some of these numbers, it’s important to try to keep KPIs to 2-5 pages of a board package. Use of the right KPIs will give a solid, objective, consistent top-down view of the company’s progress. The P&L portion of the package is obviously critical, but I have a possibly unique view on how this should be included in the body of a board package.
P&L Trends: Less is More
One mistake many companies make is confusing detail with better analysis. I often see models that have 50-100 line items for expenses and show this by month for 3 or more years out… but show one or no years of history. What this does is waste a great deal of time on predicting things that are inconsequential and controllable (by month), while eliminating all perspective. Things like seasonality are lost if one is unable to view 3 years of revenue at a time without scrolling from page to page. Of course, for the current year’s budget it is appropriate for management to establish monthly expectations in detail, but for any long-term planning, success revolves around revenue, gross margins, marketing/sales spend and the number of employees. For some companies that are deep technology players there may be significant costs in R&D other than payroll, but this is the exception. By using a simple formula for G&A based on the number of employees, the board can apply a sanity check on whether cost estimates in the long-term model will be on target assuming revenue is on target. So why spend excessive time on nits? Aggregating cost frees up time for better understanding how and why revenue will ramp, the relationship between revenue types and gross margin, the cost of acquiring a customer, the lifetime value of a customer and the average spend per employee.
In a similar way, the board is well served by viewing a simple P&L by quarter for 2 prior years plus the current one (with a forecast of remaining quarters). The lines could be:
Table1: P&L by Quarter
A second version of the P&L should be produced for budget comparison purposes. It should have the same rows but have the columns be current period actual, current period budget, year to date (YTD) actual, year to date budget, current full year forecast, budget for the full year.
Table 2: P&L Actual / Budget Comparison
Tracking MRR and LTR
For any SaaS/Subscription company (I’ll simply refer to this as SaaS going forward) MRR growth is the lifeblood of the company with two caveats: excessive churn makes MRR less valuable and excessive cost in growing MRR also leads to deceptive prosperity. More about that further on. MRR should be viewed on a rolling basis. It can be done by quarter for the board but by month for the management team. Doing it by quarter for the board enables seeing a 3-year trend on one page and gives the board sufficient perspective for oversight. Management needs to track this monthly to better manage the business. A relatively simple set of KPIs for each of 12 quarterly periods would be:
Table 3: MRR and Retention
Calculating Life Time Revenue through Cohort Analysis
The detailed method of calculating LTR does not need to be shown in every board package but should be included at least once per year, but calculated monthly for management.
The LTR calculation uses a grid where the columns would be the various Quarterly cohorts, that is all customers that first purchased that quarter (management might also do this using monthly instead of quarterly). This analysis can be applied to non-SaaS companies as well as SaaS entities. The first row would be the number of customers in the cohort. The next row would be the first month’s revenue for the cohort, the next the second months revenue, and so on until reaching 36 months (or whatever number the board prefers for B2B…I prefer 60 months). The next row would be the total for the full period and the final row would be the average Lifetime Revenue, LTR, per member of the cohort.
Table 4: Customer Lifetime Revenue
A second table would replicate the grid but show average per member of the cohort for each month (row). That table allows comparisons of cohorts to see if the average revenue of a newer cohort is getting better or worse than older ones for month 2 or month 6 or month 36, etc.
Table 5: Average Revenue per Cohort
Cohorts that have a full 36 months of data need to be at least 36 months old. What this means is that more recent cohorts will not have a full set of information but still can be used to see what trends have occurred. For example, is the second months average revenue for a current cohort much less than it was for a cohort one year ago? While newer cohorts do not have full sets of monthly revenue data, they still are very relevant in calculating more recent LTR. This can be done by using average monthly declines in sequential months and applying them to cohorts with fewer months of data.
Customer Acquisition Cost (CAC)
Calculating CAC is done in a variety of ways and is quite different for customers acquired electronically versus those obtained by a sales force. Many companies I’ve seen have a combination of the two.
Marketing used to generate leads should always be considered part of CAC. The marketing cost in a month first is divided by the number of leads to generate a cost/lead. The next step is to estimate the conversion rate of leads to customers. A simple table would be as follows:
Table 6: Customer Acquisition Costs
For an eCommerce company, the additional cost to convert might be one free month of product or a heavily subsidized price for the first month. If the customer is getting the item before becoming a regular paying customer than the CAC would be:
CAC = MCTC / the percent that converts from the promotional trial to a paying customer.
CAC when a Sales Force is Involved
For many eCommerce companies and B2B companies that sell electronically, marketing is the primary cost involved in acquiring a paying customer. For those utilizing a sales force, the marketing expense plus the sales expense must be accumulated to determine CAC.
Typically, what this means is steps 1 through 3 above would still be used to determine CPL, but step 1 above might include marketing personnel used to generate leads plus external marketing spend:
CPL (cost per lead) as above
Sales Cost = current month’s cost of the sales force including T&E
New Customers in the month = NC
Conversion Rate to Customer = NC/number of leads= Y%
CAC = CPL/Y% + (Sales Cost)/NC
There are many nuances ignored in the simple method shown. For example, some leads may take many months to close. Some may go through a pilot before closing. Therefore, there are more sophisticated methods of calculating CAC but using this method would begin the process of understanding an important indicator of efficiency of customer acquisition.
Gross Margin (GM) is a Critical Part of the Equation
While revenue is obviously an important measure of success, not all revenue is the same. Revenue that generates 90% gross margin is a lot more valuable per dollar than revenue that generates 15% gross margin. When measuring a company’s potential for future success it’s important to understand what level of revenue is required to reach profitability. A first step is understanding how gross margin may evolve. When a business scales there are many opportunities to improve margins:
Larger volumes may lead to larger discounts from suppliers
Larger volumes for products that are software/content may lower the hosting cost as a percent of revenue
Shipping to a larger number of customers may allow opening additional distribution centers (DCs) to facilitate serving customers from a DC closer to their location lowering shipping cost
Larger volumes may mean improved efficiency in the warehouse. For example, it may make more automation cost effective
When forecasting gross margin, it is important to be cautious in predicting some of these savings. The board should question radical changes in GM in the forecast. Certain efficiencies should be seen in a quarterly trend, and a marked improvement from the trend needs to be justified. The more significant jump in GM from a second DC can be calculated by looking at the change in shipping rates for customers that will be serviced from the new DC vs what rates are for these customers from the existing one.
Calculating LTV (Lifetime Value)
Gross Margin, by itself may be off as a measure of variable profits of a customer. If payment is by credit card, then the credit card cost per customer is part of variable costs. Some companies do not include shipping charges as part of cost of goods, but they should always be part of variable cost. Customer service cost is typically another cost that rises in proportion to the number of customers. So:
Variable cost = Cost of Goods sold plus any cost that varies directly with sales
The calculation of VP% should be based on current numbers as they will apply going forward. Determining a company’s marketing efficiency requires comparing LTV to the cost of customer acquisition. As mentioned earlier in the post, if the CAC is too large a proportion of LTV, a company may be showing deceptive (profitless) growth. So, the next set of KPIs address marketing efficiency.
Marketing Efficiency
It does not make sense to invest in an inefficient company as they will burn through capital at a rapid rate and will find it difficult to become profitable. A key measure of efficiency is the relationship between LTV and CAC or LTV/CAC. Essentially this is how many dollars of variable profit the company will make for every dollar it spends on marketing and sales. A ratio of 5 or more usually means the company is efficient. The period used for calculating LTR will influence this number. Since churn tends to be much lower for B2B companies, 5 years is often used to calculate LTR and LTV. But, using 5 years means waiting longer to receive resulting profits and can obscure cash flow implications of slower recovery of CAC. So, a second metric important to understand burn is how long it takes to recover CAC:
CAC Recovery Time = number of months until variable profit equals the CAC
The longer the CAC recovery time, the more capital required to finance growth. Of course, existing customers are also contributing to the month’s revenue alongside new customers. So, another interesting KPI is contribution margin which measures the current state of balance between marketing/sales and Variable Profits:
Contribution Margin = Variable Profits – Sales and Marketing Cost
Early on this number will be negative as there aren’t enough older customers to cover the investment in new ones. But eventually the contribution margin in a month needs to turn positive. To reach profitability it needs to exceed all other costs of the business (G&A, R&D, etc.). By reducing a month’s marketing cost, a company can improve contribution margin that month at the expense of sequential growth… which is why this is a balancing act.
I realize this post is long but wanted to include a substantial portion of KPIs in one post. However, I’ll leave more detailed measurement of sales force productivity and deeper analysis of several of the KPIs discussed here for one or more future posts.
Soundbytes
I’ll begin by apologizing for a midyear brag, but I always tell others to enjoy success and therefore am about to do that myself. In my top ten predictions for 2018 I included a market prediction and 4 stock predictions. I was feeling pretty good that they were all working well when I started to create this post. However, the stock prices for high growth stocks can experience serious shifts in very short periods. Facebook and Tesla both had (what I consider) minor shortfalls against expectations in the 10 days since and have subsequently declined quite a bit in that period. But given the strength of my other two recommendations, Amazon and Stitchfix, the four still have an average gain of 15% as of July 27. Since I’ve only felt comfortable predicting the market when it was easy (after 9/11 and after the 2008 mortgage blowup), I was nervous about predicting the S&P would be up this year as it was a closer call and was somewhat controversial given the length of the bull market prior to this year. But it seemed obvious that the new tax law would be very positive for corporate earnings. So, I thought the S&P would be up despite the likelihood of rising interest rates. So far, it is ahead 4.4% year to date driven by stronger earnings. Since I always fear that my record of annual wins can’t continue I wanted to take a midyear victory lap just in case everything collapses in the second half of the year (which I don’t expect but always fear). So I continue to hold all 4 stocks and in fact bought a bit more Facebook today.
On June 13th, 2018, Azure held our 12th Annual CEO Summit, hosted at the Citrix Templeton Conference Center. Success for our companies is typically predicated on the breadth and depth of their networks in Silicon Valley and beyond. This event is a cornerstone of how we support this, providing a highly curated, facilitated opportunity to expand connections for business development, fund-raising, and strategic partner dialogue. It is also an opportunity for our portfolio companies to develop strong relationships with our investors, networks, and among each other, which provides business partnership opportunities, potential future investors and is a first step towards engaging with future acquirers. An incidental benefit to Azure is that the appeal of the event also leads to expansion of our own network.
Throughout the day, we had participation of nearly 70 corporate entities, venture funds and financial institutions, including Amazon, Google, Apple, P&G, Citrix, Ericsson, Intel, Microsoft, Oracle, Trinet, Arcserv, Citibank, SVB, and UBS, in addition to 28 of Azure’s portfolio companies, and six Canadian startups which were invited as part of Azure’s Canada-Bridge initiative. The Canadian companies were selected from a group of about 100 nominated by Canadian VCs. At the event, the six winners gained access to Azure’s Silicon Valley network not only through participation along with our portfolio CEOs in the approximately 370 one-on-one meetings we arranged but also through networking opportunities throughout the rest of the day and into the evening.
Nearly all the Azure portfolio companies participating gave demo-day style presentations to the full audience, which expanded the reach of their message beyond the more intimate one-on-one meetings.
Visionary Keynote Speakers
Azure was quite fortunate in once again having several visionary keynote speakers who provided inspiration and thought-provoking inputs from their experiences as highly successful entrepreneurs and investors.
The first was David Ko, currently President and COO, Rally Health, and formerly SVP, Yahoo and COO, Zynga (famous for Farmville which peaked at 34.5 million daily active users). David provided his vision for the consumer-focused future for managing health and shared lessons learned from his journeys both in taking Zynga public and in leading Rally Health as it has grown in eight years from a company with low single-digit millions in revenue to more than a billion in revenue. Rally works with more than 200,000 employers to help drive employee engagement in their health. Accessible to more than 35 million people, Rally’s digital platform and solutions help people adopt healthier lifestyles, select health benefits, and choose the best doctor at the right price for their needs. The company’s wellness solution focuses on four key areas to improve health: nutrition, exercise, stress reduction and preventive health. Given the astronomical increase in the portion of U.S. GDP spent on healthcare, David pointed out how critical it is to help individuals improve their “wellness” tactics. He believes this is one of the waves of the future to curb further acceleration of healthcare cost.
Shai Agassi, Former President, Product and Technology Group, SAP, and former CEO, Better Place responded to questions posed by me and the audience during a fireside chat. Shai first shared his experience of building a business that successfully became integrated into SAP, but the heart of his session revolved around his perspectives on the evolution of the electric car and the future emergence of (safe) automated vehicles. He painted a vivid picture of what the oncoming transition to a new generation of vehicles means for the future, where automated, electric cars will become the norm (in 5-10 years). As a result, he believes people will reduce their use of their own cars and instead, use an “automated Uber-like service” for much of their transportation. In such a world, many people won’t own a car and for those that do, their autos will have much longer useful lives thereby reducing the need to replace cars with the same frequency. If he proves correct, this would clearly have major ramifications for auto manufacturers and the oil industry.
Our final keynote speaker was Ron Suber, President Emeritus, Prosper Marketplace, who is referred to as “The Godfather of Fintech”. Ron shared with us his perspective that we’re at the beginning stages of the ‘Golden Age of Fintech’ which he believes will be a 20-year cycle. He expects to continue to see a migration to digital, accessible platforms driven by innovation by existing players and new entrants to the market that will disrupt the incumbents. What must be scary to incumbents is that the new entrants in fintech include tech behemoths like Paypal, Google, Amazon, Tencent (owner of WeChat), Facebook and Apple. While traditional banks may have access to several hundred million customers, these players can leverage their existing reach into relationships with billions of potential customers. For example, WeChat and Instagram have both recently surpassed one billion users. With digital/mobile purchasing continuing to gain market share, a player like Apple can nearly force its users to include Apple Pay as one of their apps giving Apple some unique competitive advantages. Amazon and WeChat (in China) are in a strong position to leverage their user bases.
All That Plus a Great Dinner
After an action packed daytime agenda, the Summit concluded with a casual cocktail hour and outdoor dinner in Atherton. Most attendees joined, and additional members of the Azure network were invited as well. The dinner enabled significant networking to continue and provided an additional forum for some who were not able to be at the daytime event to meet some of our portfolio executives.
The Bottom Line – It’s About Results
How do we measure the success of the Summit? We consider it successful if several of our companies garner potential investors, strike business development deals, etc. As I write this, only nine days after the event, we already know of a number of investment follow-ups, more than ten business-development deals being discussed, and multiple debt financing conversations. Investment banks and corporate players have increased awareness of the quality of numerous companies who presented. Needless to say, Azure is pleased with the bottom line.
Applying the Gross Margin Multiple Method to Public Company Valuation
In my last two posts I’ve laid out a method to value companies not yet at their mature business models. The method provides a way to value unprofitable growth companies and those that are profitable but not yet at what could be their mature business model. This often occurs when a company is heavily investing in growth at the expense of near-term profits. In the last post, I showed how I would estimate what I believed the long-term model would be for Tesla, calling the result “Potential Earnings” or “PE”. Since this method requires multiple assumptions, some of which might not find agreement among investors, I provided a second, simplified method that only involved gross margin and revenue growth.
The first step was taking about 20 public companies and calculating how they were valued as a multiple of gross margin (GM) dollars. The second step was to determine a “least square line” and formula based on revenue growth and the gross margin multiple for these companies. The coefficient of 0.62 shows that there is a good correlation between Gross Margin and Revenue Growth, and one significantly better than the one between Revenue Growth and a company’s Revenue Multiple (that had a coefficient of 0.36 which is considered very modest).
Where’s the Beef?
The least square formula derived in my post for relating revenue growth to an implied multiple of Gross Margin dollars is:
GM Multiple = (24.773 x Revenue growth percent) + 4.1083
Implied Company Market Value = GM Multiple x GM Dollars
Now comes the controversial part. I am going to apply this formula to 10 companies using their data (with small adjustments) and compare the Implied Market Value (Implied MKT Cap) to their existing market Cap as of several days ago. I’ll than calculate the Implied Over (under) Valuation based on the comparison. If the two values are within 20% I view it as normal statistical variation.
Table 1: Valuation Analysis of 10 Tech Companies
* Includes net cash included in expected market cap
** Uses adjusted GM%
*** Uses 1/31/18 year end
**** Growth rate used in the model is q4 2017 vs q4 2016. See text
This method suggests that 5 companies are over-valued by 100% or more and a fifth, Workday, by 25%. Since Workday is close to a normal variation, I won’t discuss it further. I have added net cash for Facebook, Snap, Workday and Twitter to the implied market cap as it was material in each case but did not do so for the six others as the impact was not as material.
I decided to include the four companies I recommended, in this year’s top ten list, Amazon, Facebook, Tesla and Stitchfix, in the analysis. To my relief, they all show as under-valued with Stitchfix, (the only one below the Jan 2 price) having an implied valuation more than 100% above where it currently trades. The other three are up year to date, and while trading below what is suggested by this method, are within a normal range. For additional discussion of these four see our 2018 top Ten List.
Digging into the “Overvalued” Five
Why is there such a large discrepancy between actual market cap and that implied by this method for 5 companies? There are three possibilities:
The method is inaccurate
The method is a valid screen but I’m missing some adjustment for these companies
The companies are over-valued and at some point, will adjust, making them risky investments
While the method is a good screen on valuation, it can be off for any given company for three reasons: the revenue growth rate I’m using will radically change; a particular company has an ability to dramatically increase gross margins, and/or a particular company can generate much higher profit margins than their gross margin suggests. Each of these may be reflected in the company’s actual valuation but isn’t captured by this method.
To help understand what might make the stock attractive to an advocate, I’ll go into a lot of detail in analyzing Snap. Since similar arguments apply to the other 4, I’ll go into less detail for each but still point out what is implicit in their valuations.
Snap
Snap’s gross margin (GM) is well below its peers and hurts its potential profitability and implied valuation. Last year, GM was about 15%, excluding depreciation and amortization, but it was much higher in the seasonally strong Q4. It’s most direct competitor, Facebook, has a gross margin of 87%. The difference is that Facebook monetizes its users at a much higher level and has invested billions of dollars and executed quite well in creating its own low-cost infrastructure, while Snap has outsourced its backend to cloud providers Google and Amazon. Snap has recently signed 5-year contracts with each of them to extend the relationships. Committing to lengthy contracts will likely lower the cost of goods sold. Additionally, increasing revenue per user should also improve GM. But, continuing to outsource puts a cap on how high margins can reach. Using our model, Snap would need 79% gross margin to justify its current valuation. If I assume that scale and the longer-term contracts will enable Snap to double its gross margins to 30%, the model still shows it as being over-valued by 128% (as opposed to the 276% shown in our table). The other reason bulls on Snap may justify its high valuation is that they expect it to continue to grow revenue at 100% or more in 2018 and beyond. What is built into most forecasts is an assumed decline in revenue growth rates over time… as that is what typically occurs. The model shows that growing revenue 100% a year for two more years without burning cash would leave it only 32% over-valued in 2 years. But as a company scales, keeping revenue growth at that high a level is a daunting task. In fact, Snap already saw revenue growth decline to 75% in Q4 of 2017.
Twitter
Twitter is not profitable. Revenue declined in 2017 after growing a modest 15% in 2016, and yet it trades at a valuation that implies that it is a growth company of about 50%. While it has achieved such levels in the past, it may be difficult to even get back to 15% growth in the future given increased competition for advertising.
Netflix
I recommended Netflix in January 2015 as one of my stock picks for the year, and it proved a strong recommendation as the stock went up about 140% that year. However, between January 2015 and January 2018, the stock was up over 550% while trailing revenue only increased 112%. I continue to like the fundamentals of Netflix, but my GM model indicates that the stock may have gotten ahead of itself by a fair amount, and it is unlikely to dramatically increase revenue growth rates from last year’s 32%.
Square
Square has followed what I believe to be the average pattern of revenue growth rate decline as it went from 49% growth in 2015, down to 35% growth in 2016, to under 30% growth in 2017. There is no reason to think this will radically change, but the stock is trading as if its revenue is expected to grow at a nearly 90% rate. On the GM side, Square has been improving GM each year and advocates will point out that it could go higher than the 38% it was in 2017. But, even if I use 45% for GM, assuming it can reach that, the model still implies it is 90% over-valued.
Blue Apron
I don’t want to beat up on a struggling Blue Apron and thought it might have reached its nadir, but the model still implies it is considerably over-valued. One problem that the company is facing is that investors are negative when a company has slow growth and keeps losing money. Such companies find it difficult to raise additional capital. So, before running out of cash, Blue Apron began cutting expenses to try to reach profitability. Unfortunately, given their customer churn, cutting marketing spend resulted in shrinking revenue in each sequential quarter of 2017. In Q4 the burn was down to $30 million but the company was now at a 13% decline in revenue versus Q4 of 2016 (which is what we used in our model). I assume the solution probably needs to be a sale of the company. There could be buyers who would like to acquire the customer base, supplier relationships and Blue Apron’s understanding of process. But given that it has very thin technology, considerable churn and strong competition, I’m not sure if a buyer would be willing to pay a substantial premium to its market cap.
An Alternative Theory on the Over Valued Five
I have to emphasize that I am no longer a Wall Street analyst and don’t have detailed knowledge of the companies discussed in this post, so I easily could be missing some important factors that drive their valuation. However, if the GM multiple model is an accurate way of determining valuation, then why are they trading at such lofty premiums to implied value? One very noticeable common characteristic of all 5 companies in question is that they are well known brands used by millions (or even tens of millions) of people. Years ago, one of the most successful fund managers ever wrote a book where he told readers to rely on their judgement of what products they thought were great in deciding what stocks to own. I believe there is some large subset of personal and professional investors who do exactly that. So, the stories go:
“The younger generation is using Snap instead of Facebook and my son or daughter loves it”
“I use Twitter every day and really depend on it”
“Netflix is my go-to provider for video content and I’m even thinking of getting rid of my cable subscription”
Once investors substitute such inclinations for hard analysis, valuations can vary widely from those suggested by analytics. I’m not saying that such thoughts can’t prove correct, but I believe that investors need to be very wary of relying on such intuition in the face of evidence that contradicts it.
This post is part 2 of our valuation discussion (see this post for part 1). As I write this post Tesla’s market cap is about $56 billion. I thought it would be interesting to show how the rules discussed in the first post apply to Tesla, and then to take it a step further for startups.
Revenue and Revenue Growth
Revenue for Tesla in 2017 was $11.8 billion, about 68% higher than 2016, and it is likely to grow faster this year given the over $20 billion in pre-orders (and growing) for the model 3 coupled with continued strong demand for the model S and model X. Since it is unclear when the new sports car or truck will ship, I assume no revenue in those categories. As long as Tesla can increase production at the pace they expect, I estimate 2018 revenue will be up 80% – 120% over 2017, with Q4 year over year growth at or above 120%.
If I’m correct on Tesla revenue growth, its 2018 revenue will exceed $20 billion. So, Rule Number 1 from the prior post indicates that Tesla’s high growth rates should merit a higher “theoretical PE” than the S&P (by at least 4X if one believes that growth will continue at elevated rates).
Calculating TPE
Tesla gross margins have varied a bit while ramping production for each new model, but in the 16 quarters from Q1, 2014 to Q4, 2017 gross margin averaged 23% and was above 25%, 6 of the 16 quarters. Given that Tesla is still a relatively young company it appears likely margins will increase with scale, leading me to believe that long term gross margins are very likely to be above 25%. While it will dip during the early production ramp of the model 3, 25% seems like the lowest percent to use for long term modeling and I expect it to rise to between 27% and 30% with higher production volumes and newer factory technology.
Tesla recognizes substantial cost based on stock-based compensation (which partly occurs due to the steep rise in the stock). Most professional investors ignore artificial expenses like stock-based compensation, as I will for modeling purposes, and refer to the actual cost as net SG&A and net R&D. Given that Tesla does not pay commissions and has increased its sales footprint substantially in advance of the roll-out of the model 3, I believe Net SG&A and Net R&D will each increase at a much slower pace than revenue. If they each rise 20% by Q4 of this year and revenue is at or exceeds $20 billion, this would put their total at below 20% of revenue by Q4. Since they should decline further as a percent of revenue as the company matures, I am assuming 27% gross margin and 18% operating cost as the base case for long term operating profit. While this gross margin level is well above traditional auto manufacturers, it seems in line as Tesla does not have independent dealerships (who buy vehicles at a discount) and does not discount its cars at the end of each model year.
Estimated TPE
Table 1 provides the above as the base case for long term operating profit. To provide perspective on the Tesla opportunity, Table 1 also shows a low-end case (25% GM and 20% operating cost) and a high-end profit case (30% GM and 16% operating cost). Recall, theoretic earnings are derived from applying the mature operating profit level to trailing and to forward revenue. For calculating theoretic earnings, I will ignore interest payments and net tax loss carry forwards as they appear to be a wash over the next 5 years. Finally, to derive the Theoretic Net Earnings Percent a potential mature tax rate needs to be applied. I am using 20% for each model case which gives little credit for tax optimization techniques that could be deployed. That would make theoretic earnings for 2017 and 2018 $0.85 billion and $1.51 billion, respectively and leads to:
2017 TPE=$ 56.1 billion/$0.85 = 66.0
2018 TPE= $ 56.1 billion/1.51 = 37.1
The S&P trailing P/E is 25.5 and forward P/E is about 19X. Based on our analysis of the correlation between growth and P/E provided in the prior post, Tesla should be trading at a minimum of 4X the trailing S&P ratio (or 102 TP/E) and at least 3.5X S&P forward P/E (or 66.5 TP/E). To me that shows that the current valuation of Tesla does not appear out of market. If the market stays at current P/E levels and Tesla reaches $21B in revenue in 2018 this indicates that there is strong upside for the stock.
Table 1: Tesla TPE 2017 & 2018
The question is whether Tesla can continue to grow revenue at high rates for several years. Currently Tesla has about 2.4% share of the luxury car market giving it ample room to grow that share. At the same time, it is entering the much larger medium-priced market with the launch of the Model 3 and expects to produce vehicles in other categories over the next few years. Worldwide sales of new cars for the auto market is about 90 million in 2017 and growing about 5% a year. Tesla is the leader in several forward trends: electric vehicles, automated vehicles and technology within a car. Plus, it has a superior business model as well. If it reaches $21 billion in revenue in 2018, its share of the worldwide market would be about 0.3%. It appears poised to continue to gain share over the next 3-5 years, especially as it fills out its line of product. Given that it has achieved a 2.4% share of the market it currently plays in, one could speculate that it could get to a similar share in other categories. Even achieving a 1% share of the worldwide market in 5 years would mean about 40% compound growth between 2018 and 2022 and imply a 75X-90X TP/E at the end of this year.
The Bear Case
I would be remiss if I omitted the risks that those negative on the stock point out. Tesla is a very controversial stock for a variety of reasons:
Gross Margin has been volatile as it adds new production facilities so ‘Bears’ argue that even my 25% low case is optimistic, especially as tax rebate subsidies go away
It has consistently lost money so some say it will never reach the mature case I have outlined
As others produce better electric cars Tesla’s market share of electric vehicles will decline so high revenue growth is not sustainable
Companies like Google have better automated technology that they will license to other manufacturers leading to a leap frog of Tesla
As they say, “beauty is in the eyes of the beholder” and I believe my base case is realistic…but not without risk. In response to the bear case that Tesla revenue growth can’t continue, it is important to recognize that Tesla already has the backlog and order momentum to drive very high growth for the next two years. Past that, growing market share over the 4 subsequent years to 1% (a fraction of their current share of the luxury market) would generate compound annual growth of 40% for that 4-year period. In my opinion, the biggest risk is Tesla’s own execution in ramping production. Bears will also argue that Tesla will never reach the operating margins of my base case for a variety of reasons. This is the weakness of the TPE approach: it depends on assumptions that have yet to be proven. I’m comfortable when my assumptions depend on momentum that is already there, gross margin proof points and likelihood that scale will drive operating margin improvements without any radical change to the business model.
Applying the rules to Startups
As a VC I am often in the position of helping advise companies regarding valuation. This occurs when they are negotiating a round of financing or in an M&A situation. Because the companies are even earlier than Tesla, theoretic earnings are a bit more difficult to establish. Some investors ignore the growth rates of companies and look for comps in the same business. The problem with the comparable approach is that by selecting companies in the same business, the comps are often very slow growth companies that do not merit a high multiple. For example, comparing Tesla to GM or Ford to me seems a bit ludicrous when Tesla’s revenue grew 68% last year and is expected to grow even faster this year while Ford and GM are growing their revenue at rates below 5%. It would be similar if investors compared Apple (in the early days of the iPhone) to Nokia, a company it was obsoleting.
Investors look for proxies to use that best correlate to what future earnings will be and often settle on a multiple of revenue. As Table 2 shows, there is a correlation between valuation as a multiple of revenue and revenue growth regardless of what industry the companies are in. This correlation is closer than one would find by comparing high growth companies to their older industry peers.
Table 2: Multiple of Revenue and Revenue Growth
However, using revenue as the proxy for future earnings suffers from a wide variety of issues. Some companies have 90% or greater gross margins like our portfolio company Education.com, while others have very low gross margins of 10% – 20%, like Spotify. It is very likely that the former will generate much higher earnings as a percent of revenue than the latter. In fact, Education.com is already cash flow positive at a relatively modest revenue level (in the low double-digit millions) while Spotify continues to lose a considerable amount of money at billions of dollars in revenue. Notice, this method also implies that Tesla should be valued about 60% higher than its current market price.
This leads me to believe a better proxy for earnings is gross margin as it is more closely correlated with earnings levels. It also removes the issue of how revenue is recognized and is much easier to analyze than TPE. For example, Uber recognizing gross revenue or net revenue has no impact on gross margin dollars but would radically change its price to revenue. Table 3 uses the same companies as Table 2 but shows their multiple of gross margin dollars relative to revenue growth. Looking at the two graphs, one can see how much more closely this correlates to the valuation of public companies. The correlation coefficient improves from 0.36 for the revenue multiple to 0.62 for the gross margin multiple.
Table 3: Multiple of Gross Margin vs. Revenue Growth
So, when evaluating a round of financing for a pre-profit company the gross margin multiple as it relates to growth should be considered. For example, while there are many other factors to consider, the formula implies that a 40% revenue growth company should have a valuation of about 14X trailing gross margin dollars. Typically, I would expect that an earlier stage company’s mature gross margin percent would likely increase. But they also should receive some discount from this analysis as its risk profile is higher than the public companies shown here.
Notice that the price to sales graph indicates Tesla should be selling at 60% more than its multiple of 5X revenue. On the other hand, our low-end case for Tesla Gross Margin, 25%, puts Tesla at 20X Gross Margin dollars, just slightly undervalued based on where the least square line in Table 3 indicates it should be valued.
After many years of successfully picking public and private companies to invest in, I thought I’d share some of the core fundamentals I use to think about how a company should be valued. Let me start by saying numerous companies defy the logic that I will lay out in this post, often for good reasons, sometimes for poor ones. However, eventually most companies will likely approach this method, so it should at least be used as a sanity check against valuations.
When a company is young, it may not have any earnings at all, or it may be at an earnings level (relative to revenue) that is expected to rise. In this post, I’ll start by considering more mature companies that are approaching their long-term model for earnings to establish a framework, before addressing how this framework applies to less mature companies. The post will be followed by another one where I apply the rules to Tesla and discuss how it carries over into private companies.
Growth and Earnings are the Starting Points for Valuing Mature Companies
When a company is public, the most frequently cited metric for valuation is its price to earnings ratio (PE). This may be done based on either a trailing 12 months or a forward 12 months. In classic finance theory a company should be valued based on the present value of future cash flows. What this leads to is our first rule:
Rule 1: Higher Growth Rates should result in a higher PE ratio.
When I was on Wall Street, I studied hundreds of growth companies (this analysis does not apply to cyclical companies) over the prior 10-year period and found that there was a very strong correlation between a given year’s revenue growth rate and the next year’s revenue growth rate. While the growth rate usually declined year over year if it was over 10%, on average this decline was less than 20% of the prior year’s growth rate. What this means is that if we took a group of companies with a revenue growth rate of 40% this year, the average organic growth for the group would likely be about 33%-38% the next year. Of course, things like recessions, major new product releases, tax changes, and more could impact this, but over a lengthy period of time this tended to be a good sanity test. As of January 2, 2018, the average S&P company had a PE ratio of 25 on trailing earnings and was growing revenue at 5% per year. Rule 1 implies that companies growing faster should have higher PEs and those growing slower, lower PEs than the average.
Graph 1: Growth Rates vs. Price Earnings Ratios
The graph shows the correlation between growth and PE based on the valuations of 21 public companies. Based on Rule 1, those above the line may be relatively under-priced and those below relatively over-priced. I say ‘may be’ as there are many other factors to consider, and the above is only one of several ways to value companies. Notice that most of the theoretically over-priced companies with growth rates of under 5% are traditional companies that have long histories of success and pay a dividend. What may be the case is that it takes several years for the market to adjust to their changed circumstances or they may be valued based on the return from the dividend. For example, is Coca Cola trading on: past glory, its 3.5% dividend, or is there something about current earnings that is deceptive (revenue growth has been a problem for several years as people switch from soda to healthier drinks)? I am not up to speed enough to know the answer. Those above the line may be buys despite appearing to be highly valued by other measures.
Relatively early in my career (in 1993-1995) I applied this theory to make one of my best calls on Wall Street: “Buy Dell sell Kellogg”. At the time Dell was growing revenue over 50% per year and Kellogg was struggling to grow it over 4% annually (its compounded growth from 1992 to 1995, this was partly based on price increases). Yet Dell’s PE was about half that of Kellogg and well below the S&P average. So, the call, while radical at the time, was an obvious consequence of Rule 1. Fortunately for me, Dell’s stock appreciated over 65X from January 1993 to January 2000 (and well over 100X while I had it as a top pick) while Kellogg, despite large appreciation in the overall stock market, saw its stock decline slightly over the same 7-year period (but holders did receive annual dividends).
Rule 2: Predictability of Revenue and Earnings Growth should drive a higher trailing PE
Investors place a great deal of value on predictability of growth and earnings, which is why companies with subscription/SaaS models tend to get higher multiples than those with regular sales models. It is also why companies with large sales backlogs usually get additional value. In both cases, investors can more readily value the companies on forward earnings since they are more predictable.
Rule 3: Market Opportunity should impact the Valuation of Emerging Leaders
When one considers why high growth rates might persist, the size of the market opportunity should be viewed as a major factor. The trick here is to make sure the market being considered is really the appropriate one for that company. In the early 1990s, Dell had a relatively small share of a rapidly growing PC market. Given its competitive advantages, I expected Dell to gain share in this mushrooming market. At the same time, Kellogg had a stable share of a relatively flat cereal market, hardly a formula for growth. In recent times, I have consistently recommended Facebook in this blog for the very same reasons I had recommended Dell: in 2013, Facebook had a modest share of the online advertising, a market expected to grow rapidly. Given the advantages Facebook had (and they were apparent as I saw every Azure ecommerce portfolio company moving a large portion of marketing spend to Facebook), it was relatively easy for me to realize that Facebook would rapidly gain share. During the time I’ve owned it and recommended it, this has worked out well as the share price is up over 8X.
How the rules can be applied to companies that are pre-profit
As a VC, it is important to evaluate what companies should be valued at well before they are profitable. While this is nearly impossible to do when we first invest (and won’t be covered in this post), it is feasible to get a realistic range when an offer comes in to acquire a portfolio company that has started to mature. Since they are not profitable, how can I apply a PE ratio?
What needs to be done is to try to forecast eventual profitability when the company matures. A first step is to see where current gross margins are and to understand whether they can realistically increase. The word realistic is the key one here. For example, if a young ecommerce company currently has one distribution center on the west coast, like our portfolio company Le Tote, the impact on shipping costs of adding a second eastern distribution center can be modeled based on current customer locations and known shipping rates from each distribution center. Such modeling, in the case of Le Tote, shows that gross margins will increase 5%-7% once the second distribution center is fully functional. On the other hand, a company that builds revenue city by city, like food service providers, may have little opportunity to save on shipping.
Calculating variable Profit Margin
Once the forecast range for “mature” gross margin is estimated, the next step is to identify other costs that will increase in some proportion to revenue. For example, if a company is an ecommerce company that acquires most of its new customers through Facebook, Google and other advertising and has high churn, the spend on customer acquisition may continue to increase in direct proportion to revenue. Similarly, if customer service needs to be labor intensive, this can also be a variable cost. So, the next step in the process is to access where one expects the “variable profit margin” to wind up. While I don’t know the company well, this appears to be a significant issue for Blue Apron: marketing and cost of goods add up to about 90% of revenue. I suspect that customer support probably eats up (no pun intended) 5-10% of what is left, putting variable margins very close to zero. If I assume that the company can eventually generate 10% variable profit margin (which is giving it credit for strong execution), it would need to reach about $4 billion in annual revenue to reach break-even if other costs (product, technology and G&A) do not increase. That means increasing revenue nearly 5-fold. At their current YTD growth rate this would take 9 years and explains why the stock has a low valuation.
Estimating Long Term Net Margin
Once the variable profit margin is determined, the next step would be to estimate what the long-term ratio of all other operating cost might be as a percent of revenue. Using this estimate I can determine a Theoretic Net Earnings Percent. Applying this percent to current (or next years) revenue yields a Theoretic Earnings and a Theoretic PE (TPE):
TPE= Market Cap/Theoretic Earnings
To give you a sense of how I successfully use this, review my recap of the Top Ten Predictions from 2017 where I correctly predicted that Spotify would not go public last year despite strong top line growth as it was hard to see how its business model could support more than 2% or so positive operating margin, and that required renegotiating royalty deals with record labels. Now that Spotify has successfully negotiated a 3% lower royalty rate from several of the labels, it appears that the 16% gross margins in 2016 could rise to 19% or more by the end of 2018. This means that variable margins (after marketing cost) might be 6%. This would narrow its losses, but still means it might be several years before the company achieves the 2% operating margins discussed in that post. As a result, Spotify appears headed for a non-traditional IPO, clearly fearing that portfolio managers would not be likely to value it at its private valuation price since that would lead to a TPE of over 200. Since Spotify is loved by many consumers, individuals might be willing to overpay relative to my valuation analysis.
Our next post will pick up this theme by walking through why this leads me to believe Tesla continues to have upside, and then discussing how entrepreneurs should view exit opportunities.
SoundBytes
I’ve often written about effective shooting percentage relative to Stephen Curry, and once again he leads the league among players who average 15 points or more per game. What also accounts for the Warriors success is the effective shooting of Klay Thompson, who is 3rd in the league, and Kevin Durant who is 6th. Not surprisingly, Lebron is also in the top 10 (4th). The table below shows the top ten among players averaging 15 points or more per game. Of the top ten scorers in the league, 6 are among the top 10 effective shooters with James Harden only slightly behind at 54.8%. The remaining 3 are Cousins (53.0%), Lillard (52.2%), and Westbrook, the only one below the league average of 52.1% at 47.4%.
Table: Top Ten Effective Shooters in the League
*Note: Bolded players denote those in the top 10 in Points per Game
In my recap of 2017 predictions I pointed out how boring my stock predictions have been with Tesla and Facebook on my list every year since 2013 and Amazon on for two of the past three years. But what I learned on Wall Street is that sticking with companies that have strong competitive advantages in a potentially mega-sized market can create great performance over time (assuming one is correct)! So here we go again, because as stated in my January 5 post, I am again including Tesla, Facebook and Amazon in my Top ten list for 2018. I believe they each continue to offer strong upside, as explained below. I’m also adding a younger company, with a modest market cap, thus more potential upside coupled with more risk. The company is Stitch Fix, an early leader in providing women with the ability to shop for fashion-forward clothes at home. My belief in the four companies is backed up by my having an equity position in each of them.
I’m expecting the four stocks to outperform the market. So, in a steeply declining market, out-performance might occur with the stock itself being down (but less than the market). Having mentioned the possibility of a down market, I’m predicting the market will rise this year. This is a bit scary for me, as predicting the market as a whole is not my specialty.
We’ll start with the stock picks (with January 2 opening prices of stocks shown in parenthesis) and then move on to the remainder of my 10 predictions.
1. Tesla stock appreciation will continue to outpace the market (it opened the year at $312/share).
The good news and bad news on Tesla is the delays in production of the Model 3. The good part is that we can still look forward to massive increases in the number of cars the company sells once Tesla gets production ramping (I estimate the Model 3 backlog is well in excess of 500,000 units going into 2018 and demand appears to be growing). In 2017, Tesla shipped between 80,000 and 100,000 vehicles with revenue up 30% in Q3 without help from the model 3. If the company is successful at ramping capacity (and acquiring needed parts), it expects to reach a production rate of 5,000 cars per week by the end of Q1 and 10,000 by the end of the year. That could mean that the number of units produced in Q4 2018 will be more than four times that sold in Q4 2017 (with revenue about 2.0-2.5x due to the Model 3 being a lower priced car). Additionally, while it is modest compared to revenue from selling autos, the company appears to be the leader in battery production. It recently announced the largest battery deal ever, a $50 million contract (now completed on time) to supply what is essentially a massive backup battery complex for energy to Southern Australia. While this type of project is unlikely to be a major portion of revenue in the near term, it can add to Tesla’s growth rate and profitability.
2. Facebook stock appreciation will continue to outpace the market (it opened the year at $182/share).
The core Facebook user base growth has slowed considerably but Facebook has a product portfolio that includes Instagram, WhatsApp and Oculus. This gives Facebook multiple opportunities for revenue growth: Improve the revenue per DAU (daily active user) on Facebook itself; increase efforts to monetize Instagram and WhatsApp in more meaningful ways; and build the install base of Oculus. Facebook advertising rates have been increasing steadily as more mainstream companies shift budget from traditional advertising to Facebook, especially in view of declining TV viewership coupled with increased use of DVRs (allowing viewers to skip ads). Higher advertising rates, combined with modest growth in DAUs, should lead to continued strong revenue growth. And while the Oculus product did not get out of the gate as fast as expected, it began picking up steam in Q3 2017 after Facebook reduced prices. At 210,000 units for the quarter it may have contributed up to 5% of Q3 revenue. The wild card here is if a “killer app” (a software application that becomes a must have) launches that is only available on the Oculus, sales of Oculus could jump substantially in a short time.
3. Amazon stock appreciation will outpace the market (it opened the year at $1188/share).
Amazon, remarkably, increased its revenue growth rate in 2017 as compared to 2016. This is unusual for companies of this size. In 2018, we expect online to continue to pick up share in retail and Amazon to gain more share of online. The acquisition of Whole Foods will add approximately $4B per quarter in revenue, boosting year/year revenue growth of Amazon an additional 9%-11% per quarter, if Whole Foods revenue remains flattish. If Amazon achieves organic growth of 25% (in Q3 it was 29% so that would be a drop) in 2018, this would put the 3 quarters starting in Q4 2017 at about 35% growth. While we do expect Amazon to boost Whole Foods revenue, that is not required to reach those levels. In Q4 2018, reported revenue will return to organic growth levels. The Amazon story also features two other important growth drivers. First, I expect the Echo to have another substantial growth year and continue to emerge as a new platform in the home. Additionally, Amazon appears poised to benefit from continued business migration to the cloud coupled with increased market share and higher average revenue per cloud customer. This will be driven by modest price increases and introduction of more services as part of its cloud offering. The success of the Amazon Echo with industry leading voice technology should continue to provide another boost to Amazon’s revenue. Additionally, having a large footprint of physical stores will allow Amazon to increase distribution of many products.
4. Stitch Fix stock appreciation will outpace the market (it opened the year at $25/share and is at the same level as I write this post).
Stitch Fix is my riskiest stock forecast. As a new public company, it has yet to establish a track record of performance that one can depend upon. On the other hand, it’s the early leader in a massive market that will increasingly move online, at-home shopping for fashion forward clothes. The number of people who prefer shopping at home to going to a physical store is on the increase. The type of goods they wish to buy expands every year. Now, clothing is becoming a new category on the rapid rise (it grew from 11% of overall clothing retail sales in 2011 to 19% in 2016). It is important for women buying this way to feel that the provider understands what they want and facilitates making it easy to obtain clothes they prefer. Stitch Fix uses substantial data analysis to personalize each box it sends a customer. The woman can try them on, keep (and pay for) those they like, and return the rest very easily.
5. The stock market will rise in 2018 (the S&P opened the year at 2,696 on January 2).
While I have been accurate on recommending individual stocks over a long period, I rarely believe that I understand what will happen to the overall market. Two prior exceptions were after 9/11 and after the 2008 mortgage crisis generated meltdown. I was correct both times but those seemed like easy calls. So, it is with great trepidation that I’m including this prediction as it is based on logic and I know the market does not always follow logic! To put it simply, the new tax bill is quite favorable to corporations and therefore should boost after-tax earnings. What larger corporations pay is often a blend of taxes on U.S. earnings and those on earnings in various countries outside the U.S. There can be numerous other factors as well. Companies like Microsoft have lower blended tax rates because much of R&D and corporate overhead is in the United States and several of its key products are sold out of a subsidiary in a low tax location, thereby lowering the portion of pre-tax earnings here. This and other factors (like tax benefits in fiscal 2017 from previous phone business losses) led to blended tax rates in fiscal 2015, 2016 and 2017 of 34%, 15% and 8%, respectively. Walmart, on the other hand, generated over 75% of its pre-tax earnings in the United States over the past three fiscal years, so their blended rate was over 30% in each of those years
Table 1: Walmart Blended Tax Rates 2015-2017
The degree to which any specific company’s pre-tax earnings mix changes between the United States and other countries is unpredictable to me, so I’m providing a table showing the impact on after-tax earnings growth for theoretical companies instead. Table 2 shows the impact of lowering the U.S. corporate from 35% to 21% on four example companies. To provide context, I show two companies growing pre-tax earnings by 10% and two companies by 30%. If blended tax rates didn’t change, EPS would grow by the same amount as pre-tax earnings. For Companies 1 and 3, Table 2 shows what the increase in earnings would be if their blended 2017 tax rate was 35% and 2018 shifts to 21%. For companies 2 and 4, Table 2 shows what the increase in earnings would be if the 2017 rate was 30% (Walmart’s blended rate the past three years) and the 2018 blended rate is 20%.
Table 2: Impact on After-Tax Earnings Growth
As you can see, companies that have the majority of 2018 pre-tax earnings subject to the full U.S. tax rate could experience EPS growth 15%-30% above their pre-tax earnings growth. On the other hand, if a company has a minimal amount of earnings in the U.S. (like the 5% of earnings Microsoft had in fiscal 2017), the benefit will be minimal. Whatever benefits do accrue will also boost cash, leading to potential investments that could help future earnings. If companies that have maximum benefits from this have no decline in their P/E ratio, this would mean a substantial increase in their share price, thus the forecast of an up market. But as I learned on Wall Street, it’s important to sight risk. The biggest risks to this forecast are the expected rise in interest rates this year (which usually is negative for the market) and the fact that the market is already at all-time highs.
6. Battles between the federal government and states will continue over marijuana use but the cannabis industry will emerge as one to invest in.
The battle over legalization of Marijuana reached a turning point in 2017 as polls showed that over 60% of Americans now favor full legalization (as compared to 12% in 1969). Prior to 2000, only three states (California, Oregon and Maine) had made medical cannabis legal. Now 29 states have made it legal for medical use and six have legalized sale for recreational use. Given the swing in voter sentiment (and a need for additional sources of tax revenue), more states are moving towards legalization for recreational and medical purposes. This has put the “legal” marijuana industry on a torrid growth curve. In Colorado, one of the first states to broadly legalize use, revenue is over $1 billion per year and overall 2017 industry revenue is estimated at nearly $8 billion, up 20% year/year. Given expected legalization by more states and the ability to market product openly once it is legal, New Frontier Data predicts that industry revenue will more than triple by 2025. The industry is making a strong case that medical use has compelling results for a wide variety of illnesses and high margin, medical use is forecast to generate over 50% of the 2025 revenue. Given this backdrop, public cannabis companies have had very strong performance. Despite this, in 2016, VCs only invested about $49 million in the sector. We expect that number to escalate dramatically in 2017 through 2019. While public cannabis stocks are trading at nosebleed valuations, they could have continued strong performance as market share consolidates and more states (and Canada) head towards legalization. One caveat to this is that Federal law still makes marijuana use illegal and the Trump administration is adopting a more aggressive policy towards pursuing producers, even in states that have made use legal. The states that have legalized marijuana use are gearing up to battle the federal government.
7. At least one city will announce a new approach to Urban transport
Traffic congestion in cities continues to worsen. Our post on December 14, 2017 discussed a new approach to urban transportation, utilizing small footprint automated cars (one to two passengers, no trunk, no driver) in a dedicated corridor. This appears much more cost effective than a Rapid Bus Transit solution and far more affordable than new subway lines. As discussed in that post, Uber and other ride services increase traffic and don’t appear to be a solution. The thought that automating these vehicles will relieve pressure is overly optimistic. I expect at least one city to commit to testing the method discussed in the December post before the end of this year – it is unlikely to be a U.S. city. The approach outlined in that post is one of several that is likely to be tried over the coming years as new thinking is clearly needed to prevent the traffic congestion that makes cities less livable.
8. Offline retailers will increase the velocity of moving towards omnichannel.
Retailers will adopt more of a multi-pronged approach to increasing their participation in e-commerce. I expect this to include:
An increased pace of acquisition of e-commerce companies, technologies and brands with Walmart leading the way. Walmart and others need to participate more heavily in online as their core offline business continues to lose share to online. In 2017, Walmart made several large acquisitions and has emerged as the leader among large retailers in moving online. This, in turn, has helped its stock performance. After a stellar 12 months in which the stock was up over 40%, it finally exceeded its January 2015 high of $89 per share (it reached $101/share as we are finalizing the post). I expect Walmart and others in physical retail to make acquisitions that are meaningful in 2018 so as to speed up the transformation of their businesses to an omnichannel approach.
Collaborating to introduce more online/technology into their physical stores (which Amazon is likely to do in Whole Foods stores). This can take the form of screens in the stores to order online (a la William Sonoma), having online purchases shipped to your local store (already done by Nordstrom) and adding substantial ability to use technology to create personalized items right at the store, which would subsequently be produced and shipped by a partner.
9. Social commerce will begin to emerge as a new category.
Many e-commerce sites have added elements of social, and many social sites have begun trying to sell various products. But few of these have a fully integrated social approach to e-commerce. The elements of a social approach to e-commerce include:
A feed-based user experience
Friends’ actions impact your feed
Following trend setters to see what they are buying, wearing, and favoring
Notifications based on your likes and tastes
One click to buy
Following particular stores and/or friends
I expect to see existing e-commerce players adding more elements of social, existing social players improving their approach to commerce and a rising trend of emerging companies focused on fully integrated social commerce.
10. “The Empire Strikes Back”: automobile manufacturers will begin to take steps to reclaim use of its GPS.
It is almost shameful that automobile manufacturers, other than Tesla, have lost substantial usage of their onboard GPS systems as many people use their cell phones or a small device to run Google, Waze (owned by Google) or Garmin instead of the larger screen in their car. In the hundreds of times I’ve taken an Uber or Lyft, I’ve never seen the driver use their car’s system. To modernize their existing systems, manufacturers may need to license software from a third party. Several companies are offering next generation products that claim to replicate the optimization offered by Waze but also add new features that go beyond it like offering to order coffee and other items to enable the driver to stop at a nearby location and have the product prepaid and waiting for them. In addition to adding value to the user, this also leads to a lead-gen revenue opportunity. In 2018, I expect one or more auto manufacturers to commit to including a third-party product in one or more of their models.
Soundbytes
Tesla model 3 sample car generates huge buzz at Stanford Mall in Menlo Park California. This past weekend my wife and I experienced something we had not seen before – a substantial line of people waiting to check out a car, one of the first Model 3 cars seen live. We were walking through the Stanford Mall where Tesla has a “Guide Store” and came upon a line of about 60 people willing to wait a few hours to get to check out one of the two Model 3’s available for perusal in California (the other was in L.A.). An hour later we came back, and the line had grown to 80 people. To be clear, the car was not available for a test drive, only for seeing it, sitting in it, finding out more info, etc. Given the buzz involved, it seems to me that as other locations are given Model 3 cars to look at, the number of people ordering a Model 3 each week might increase faster than Tesla’s capacity to fulfill.
“When I was on Wall Street I became very boring by having the same three strong buy recommendations for many years… until I downgraded Compaq in 1998 (it was about 30X the original price at that point). The other two, Microsoft and Dell, remained strong recommendations until I left Wall Street in 2000. At the time, they were each well over 100X the price of my original recommendation. I mention this because my favorite stocks for this blog include Facebook and Tesla for the 4th year in a row. They are both over 5X what I paid for them in 2013 ($23 and $45, respectively) and I continue to own both. Will they get to 100X or more? This is not likely, as companies like them have had much higher valuations when going public compared with Microsoft or Dell, but I believe they continue to offer strong upside, as explained below.”
Be advised that my top ten for 2018 will continue to include all three picks from 2017. I’m quite pleased that I continue to be fortunate, as the three were up an average of 53% in 2017. Furthermore, each of my top ten forecasts proved pretty accurate, as well!
I’ve listed in bold the 2017 stock picks and trend forecasts below, and give a personal evaluation of how I fared on each. For context, the S&P was up 19% and the Nasdaq 28% in 2017.
Tesla stock appreciation will continue to outpace the market. Tesla, once again, posted very strong performance. While the Model 3 experienced considerable delays, backorders for it continued to climb as ratings were very strong. As of mid-August, Tesla was adding a net of 1,800 orders per day and I believe it probably closed the year at over a 500,000-unit backlog. So, while the stock tailed off a bit from its high ($385 in September), it was up 45% from January 3, 2017 to January 2, 2018 and ended the year at 7 times the original price I paid in 2013 when I started recommending it. Its competitors are working hard to catch up, but they are still trailing by quite a bit.
Facebook stock appreciation will continue to outpace the market. Facebook stock appreciated 57% year/year and opened on January 2, 2018 at $182 (nearly 8 times my original price paid in 2013 when I started recommending it). This was on the heels of 47% revenue growth (through 3 quarters) and even higher earnings growth.
Amazon stock appreciation will outpace the market. Amazon stock appreciated 57% in 2017 and opened on January 2, 2018 at $1,188 per share. It had been on my recommended list in 2015 when it appreciated 137%. Taking it off in 2016 was based on Amazon’s stock price getting a bit ahead of itself (and revenue did catch up that year growing 25% while the stock was only up about 12%). In 2017, the company increased its growth rate (even before the acquisition of Whole Foods) and appeared to consolidate its ability to dominate online retail.
Both online and offline retailers will increasingly use an omnichannel approach. Traditional retailers started accelerating the pace at which they attempted to blend online and offline in 2017. Walmart led, finally realizing it had to step up its game to compete with Amazon. While its biggest acquisition was Jet.com for over $3 billion, it also acquired Bonobos, Modcloth.com, Moosejaw, Shoebuy.com and Hayneedle.com, creating a portfolio of online brands that could also be sold offline. Target focused on becoming a leader in one-day delivery by acquiring Shipt and Grand Junction, two leaders in home delivery. While I had not predicted anything as large as a Whole Foods acquisition for Amazon, I did forecast that they would increase their footprint of physical locations (see October 2016 Soundbytes). The strategy for online brands to open “Guide” brick and mortar stores ( e.g. Tesla, Warby Parker, Everlane, etc.) continued at a rapid pace.
A giant piloted robot will be demo’d as the next form of entertainment. As expected, Azure portfolio company, Megabots, delivered on this forecast by staging an international fight with a giant robot from Japan. The fight was not live as the robots are still “temperamental” (meaning they occasionally stop working during combat). However, interest in this new form of entertainment was incredible as the video of the fight garnered over 5 million views (which is in the range of an average prime-time TV show). There is still a large amount of work to be done to convert this to an ongoing form of entertainment, but all the ingredients are there.
Virtual and Augmented reality products will escalate. Sales of VR/AR headsets appear to have well exceeded 10 million units for the year with some market gain for higher-end products. The types of applications have expanded from gaming to room design (and viewing), travel, inventory management, education, healthcare, entertainment and more. While the actual growth in unit sales fell short of what many expected, it still was substantial. With Apple’s acquisition of Vrvana (augmented reality headset maker) it seems clear that Apple plans to launch multiple products in the category over the next 2-3 years, and with Facebook’s launch of ArKIT, it’s social AR development platform, there is clearly a lot of focus and growth ahead.
Magic Leap will disappoint in 2017. Magic Leap, after 5 years of development and $1.5 billion of investment, did not launch a product in 2017. But, in late December they announced that their first product will launch in 2018. Once again, the company has made strong claims for what its product will do, and some have said early adopters (at a very hefty price likely to be in the $1,500 range) are said to be like those who bought the first iPod. So, while it disappointed in 2017, it is difficult to tell whether or not this will eventually be a winning company as it’s hard to separate hype from reality.
Cable companies will see a slide in adoption. According to eMarketer, “cord cutting”, i.e. getting rid of cable, reached record proportions in 2017, well exceeding their prior forecast. Just as worrisome to providers, the average time watching TV dropped as well, implying decreased dependence on traditional consumption. Given the increase now evident in cord cutting, UBS (as I did a year ago) is now forecasting substantial acceleration of the decline in subscribers. While the number of subscribers bounced around a bit between 2011 and 2015, when all was said and done, the aggregate drop in that four-year period was less than 0.02%. UBS now forecasts that between the end of 2016 and the end of 2018 the drop will be 7.3%. The more the industry tries to offset the drop by price increases, the more they will accelerate the pace of cord cutting.
Spotify will either postpone its IPO or have a disappointing one. When we made this forecast, Spotify was expected to go public in Q2 2017. Spotify postponed its IPO into 2018 while working on new contracts with the major music labels to try to improve its business model. It was successful in these negotiations in that the labels all agreed to new terms. Since the terms were not announced, we’ll need to see financials for Q1 2018 to better understand the magnitude of improvement. In the first half of the year, Spotify reported that gross margins improved from 16% to 22%, but this merely cut its loss level rather than move the company to profitability. It has stated that it expects to do a non-traditional IPO (a direct listing without using an investment bank) in the first half of 2018. If the valuation approaches its last private round, I would caution investors to stay away, as that valuation, coupled with 22% gross margins (and over 12% of revenue in sales and marketing cost to acquire customers), implies net margin in the mid-single digits at best (assuming they can reduce R&D and G&A as a percent of revenue). This becomes much more challenging in the face of a $1.6 billion lawsuit filed against it for illegally offering songs without compensating the music publisher. Even if they managed to successfully fight the lawsuit and improve margin, Spotify would be valued at close to 100 times “potential earnings” and these earnings may not even materialize.
Amazon’s Echo will gain considerable traction in 2017. Sales of the Echo exploded in 2017 with Amazon announcing that it “sold 10s of millions of Alexa-enabled devices” exceeding our aggressive forecast of 2-3x the 4.4 million units sold in 2016. The Alexa app was also the top app for both Android and iOS phones. It clearly has carved out a niche as a new major platform.
Stay tuned for my top 10 predictions of 2018!
SoundBytes
In our December 20, 2017 post, I discussed just how much Steph Curry improves teammate performance and how effective a shooter he is. I also mentioned that Russell Westbrook leading the league in scoring in the prior season might have been detrimental to his team as his shooting percentage falls well below the league average. Now, in his first game returning to the lineup, Curry had an effective shooting percentage that exceeded 100% while scoring 38 points (this means scoring more than 2 points for every shot taken). It would be interesting to know if Curry is the first player ever to score over 35 points with an effective shooting percentage above 100%! Also, as of now, the Warriors are scoring over 15 points more per game this season with Curry in the lineup than they did for the 11 games he was out (which directly ties to the 7.4% improvement in field goal percentage that his teammates achieve when playing with Curry as discussed in the post).
In my blog post dated February 3, 2017, I discussed several statistics that are noteworthy in analyzing how much a basketball player contributes to his team’s success. In it, I compared Stephen Curry and Russell Westbrook using several advanced statistics that are not typically highlighted.
The first statistic: Primary plus Secondary Assists per Minute a player has the ball. Time with the ball equates to assist opportunity, so holding the ball most of the time one’s team is on offense reduces the opportunity for others on the team to have assists. This may lead to fewer assisted baskets for the whole team, but more for the individual player. As of the time of the post, Curry had 1.74 assists (primary plus secondary) per minute he had the ball, while Westbrook only had 1.30 assists per minute. Curry’s efficiency in assists is one of the reasons the Warriors total almost 50% more assists per game than the Thunder, make many more easy baskets, and lead the league in field goal percentage.
The second statistic: Effective Field Goal Percentages (where making a 3-point shot counts the same as making 1 ½ 2-point shots). Again, Curry was vastly superior to Westbrook at 59.1% vs 46.4%. What this means is that Westbrook scores more because he takes many more shots, but these shots are not very efficient for his team, as Westbrook’s shooting percentage continued to be well below the league average of 45.7% (Westbrook’s was 42.5% last season and is 39.6% this season to date).
The third statistic: Plus/Minus. Plus/Minus reflects the number of points your team outscores opponents while you are on the floor. Curry led the league in this in 2013, 2014, and 2016 and leads year-to-date this season. In 2015 he finished second by a hair to a teammate. Westbrook has had positive results, but last year averaged 3.2 per 36 minutes vs Curry’s 13.8. One challenge to the impressiveness of this statistic for Curry is whether his leading the league in Plus/Minus is due to the quality of players around him. In refute, it is interesting to note that he led the league in 2013 when Greene was a sub, Durant wasn’t on the team and Thompson was not the player he is today.
The background shown above brings me to today’s post which outlines another way of looking at a player’s value. The measurement I’m advocating is: How much does he help teammates improve? My thesis is that if the key player on a team creates a culture of passing the ball and setting up teammates, everyone benefits. Currently the value of helping teammates is only measured by the number of assists a player records. But, if I’m right, and the volume of assists is the wrong measure of helping teammates excel (as sometimes assists are the result of holding the ball most of the time) then I should be able to verify this through teammate performance. If most players improve their performance by getting easier shots when playing with Westbrook or Curry, then this should translate into a better shooting percentage. That would mean we should be able to see that most teammates who played on another team the year before or the year after would show a distinct improvement in shooting percentage while on his team. This is unlikely to apply across the board as some players get better or worse from year to year, and other players on one’s team also impact this data. That being said, looking at this across players that switch teams is relevant, especially if there is a consistent trend.
To measure this for Russell Westbrook, I’ve chosen 5 of the most prominent players that recently switched teams to or from Oklahoma City: Victor Oladipo, Kevin Durant, Carmelo Anthony, Paul George and Enes Kantor. Three left Oklahoma City and two went there from another team. For the two that went there, Paul George and Carmelo Anthony, I’ll compare year-to-date this season (playing with Westbrook) vs their shooting percentage last year (without Westbrook). For Kantor and Oladipo, the percentage last year will be titled “with Westbrook” and this year “without Westbrook” and for Durant, the seasons in question are the 2015-16 season (with Westbrook) vs the 2016-17 season (without Westbrook).
Shooting Percentage
Given that the league average is to shoot 45.7%, shooting below that can hurt a team, while shooting above that should help. An average team takes 85.4 shots per game, so a 4.0% swing translates to over 8.0 points a game. To put that in perspective, the three teams with the best records this season are the Rockets, Warriors and Celtics and they had first, second and fourth best Plus/Minus for the season at +11.0, +11.0 and +5.9, respectively. The Thunder came in at plus 0.8. If they scored 8 more points a game (without giving up more) their Plus/Minus would have been on a par with the top three teams, and their record likely would be quite a bit better than 12 and 14.
Curry and His Teammates Make Others Better
How does Curry compare? Let’s look at the same statistics for Durant, Andrew Bogut, Harrison Barnes, Zaza Pachulia and Ian Clark (the primary player who left the Warriors). For Barnes, Bogut, Pachulia and Durant I’ll compare the 2015 and 2016 seasons and for Clark I’ll use 2016 vs this season-to-date.
So, besides being one of the best shooters to play the game, Curry also has a dramatic impact on the efficiency of other players on his team. Perhaps it’s because opponents need to double team him, which allows other players to be less guarded. Perhaps it’s because he bought into Kerr’s “spread the floor, move the ball philosophy”. Whatever the case, his willingness to give up the ball certainly has an impact. And that impact, plus his own shooting efficiency, clearly leads to the Warriors being an impressive scoring machine. As an aside, recent Warrior additions Casspi and Young are also having the best shooting percentages of their careers.
Westbrook is a Great Player Who Could be Even Better
I want to make it clear that I believe Russell Westbrook is a great player. His speed, agility and general athleticism allow him to do things that few other players can match. He can be extremely effective driving to the basket when it is done under control. But, he is not a great outside shooter and could help his team more by taking fewer outside shots and playing less one/one basketball. Many believed that the addition of George and Anthony would make Oklahoma City a force to be reckoned with, but to date this has not been the case. Despite the theoretic offensive power these three bring to the table, the team is 24th in the league in scoring at 101.8 per game, 15 points per game behind the league leading Warriors. This may change over the course of the season but I believe that each of them playing less one/one basketball would help.
As our population increases, the traffic congestion in cities continues to worsen. In the Bay Area my commute into the city now takes about 20% longer than it did 10 years ago, and driving outside of typical rush hours is now often a major problem. In New York, the subway system helps quite a bit, but most of Manhattan is gridlocked for much of the day.
The two key ways of relieving cities from traffic snarl are:
Reduce the number of vehicles on city streets
Increase the speed at which vehicles move through city streets
Metro areas have been experimenting with different measures to improve car speed, such as:
Encouraging carpooling and implementing high occupancy vehicle lanes on arteries that lead to urban centers
Converting more streets to one-way with longer periods of green lights
Prohibiting turns onto many streets as turning cars often cause congestion
No matter what a city does, traffic will continue to get worse unless compelling and effective urban transportation systems are created and/or enhanced. With that in mind, this post will review current alternatives and discuss various ways of attacking this problem.
Ride sharing services have increased congestion
Uber and Lyft have not helped relieve congestion. They have probably even led to increasing it, as so many rideshare vehicles are cruising the streets while awaiting their next ride. While the escalation of ridesharing services like Uber and Lyft may have reduced the number of people who commute using their own car to work, they have merely substituted an Uber driver for a personal driver. Commuters parked their cars when arriving at work while ridesharing drivers continue to cruise after dropping off a passenger, so the real benefit here has been in reducing demand for parking, not improving traffic congestion.
A simple way to think about this is that the total cars on the street at any point in time consists of those with someone going to a destination plus those cruising awaiting picking up a passenger. Uber does not reduce the number of people going to a destination by car (and probably increases it as some Uber riders would have taken public transportation if not for Uber).
The use of optimal traffic-aware routing GPS apps like Waze doesn’t reduce traffic but spreads it more evenly among alternate routes, therefore providing a modest increase in the speed that vehicles move through city streets. The thought that automating these vehicles will relieve pressure is unrealistic, as automated vehicles will still be subject to the same movement as those with drivers (who use Waze). Automating ridesharing cars can modestly reduce the number of cruising vehicles, as Uber and Lyft can optimize the number that remain in cruise mode. However, this will not reduce the number of cars transporting someone to a destination. So, it is clear to me that ridesharing services increase rather than reduce the number of vehicles on city streets and will continue to do so even when they are driverless.
Metro rail systems effectively reduce traffic but are expensive and can take decades to implement
Realistically, improving traffic flow requires cities to enhance their urban transport system, thereby reducing the number of vehicles on their streets. There are several historic alternatives but the only one that can move significant numbers of passengers from point A to point B without impacting other traffic is a rail system. However, construction of a rail system is costly, highly disruptive, and can take decades to go from concept to completion. For example, the New York City Second Avenue Line was tentatively approved in 1919. It is educational to read the history of reasons for delays, but the actual project didn’t begin until 2005 despite many millions of dollars being spent on planning, well before that date. The first construction commenced in April 2007. The first phase of the construction cost $4.5 billion and included 3 stations and 2 miles of tunnels. This phase was complete, and the line opened in January 2017. By May daily ridership was approximately 176,000 passengers. A second phase is projected to cost an additional $6 billion, add 1.5 more miles to the line and be completed 10-12 years from now (assuming no delays). Phase 1 and 2 together from actual start to hopeful finish will be over two decades from the 2005 start date…and about a century from when the line was first considered!
Dedicated bus rapid transit, less costly and less effective
Most urban transportation networks include bus lines through city streets. While buses do reduce the number of vehicles on the roads, they have several challenges that keep them from being the most efficient method of urban transport:
They need to stop at traffic lights, slowing down passenger movement
When they stop to let one passenger on or off, all other passengers are delayed
They are very large and often cause other street traffic to be forced to slow down
One way of improving bus efficiency is a Dedicated Bus Rapid Transit System (BRT). Such a system creates a dedicated corridor for buses to use. A key to increasing the number of passengers such a system can transport is to remove them from normal traffic (thus the dedicated lanes) and to reduce or eliminate the need to stop for traffic lights by either altering the timing to automatically accommodate minimal stoppage of the buses or by creating overpasses and/or underpasses. If traffic lights are altered, the bus doesn’t stop for a traffic light but that can mean cross traffic stops longer, thus increasing cross traffic congestion. Elimination of interference using underpasses and/or overpasses at each intersection can be quite costly given the substantial size of buses. San Francisco has adopted the first, less optimal, less costly, approach along a two-mile corridor of Van Ness Avenue. The cost will still be over $200 million (excluding new buses) and it is expected to increase ridership from about 16,000 passengers per day to as much as 22,000 (which I’m estimating translates to 2,000-3,000 passengers per hour in each direction during peak hours). Given the increased time cross traffic will need to wait, it isn’t clear how much actual benefit will occur.
Will Automated Car Rapid Transit (ACRT) be the most cost effective solution?
I recently met with a company that expects to create a new alternative using very small automated car rapid transit (ACRT) that costs a fraction of and has more than double the capacity of a BRT. The basic concept is to create a corridor similar to that of a BRT, utilizing underpasses under some streets and bridges over other streets. Therefore, cross traffic would not be affected by longer traffic light stoppages. Since the size of an underpass (tunnel) to accommodate a very small car is a fraction of that of a very large bus, so is the cost. The cars would be specially designed driverless automated cars that have no trunk, no back seats and hold one or two passengers. The same 3.5 to 4.0-meter-wide lane needed for a BRT would be sufficient for more than two lanes of such cars. Since the cars would be autonomous, speed and distance between cars could be controlled so that all cars in the corridor move at 30 miles per hour unless they exited. Since there would be overpasses and underpasses across each cross street, the cars would not stop for lights. Each vehicle would hold one or two passengers going to the same stop, so the car would not slow until it reached that destination. When it did, it would pull off the road without reducing speed until it was on the exit ramp.
The company claims that it will have the capacity to transport 10,000 passengers per hour per lane with the same setup as the Van Ness corridor if underpasses and overpasses were added. Since a capacity of 10,000 passengers per hour in each direction would provide significant excess capacity compared to likely usage, 2 lanes (3 meters in total width instead of 7-8 meters) is all that such a system would require. The reduced width would reduce construction cost while still providing excess capacity. Passengers would arrive at destinations much sooner than by bus as the autos would get there at 30 miles per hour without stopping even once. This translates to a 2-mile trip taking 4 minutes! Compare that to any experience you have had taking a bus. The speed of movement also helps make each vehicle available to many more passengers during a day. While it is still unproven, this technology appears to offer significant cost/benefit vs other alternatives.
Conclusion
The population expansion within urban areas will continue to drive increased traffic unless additional solutions are implemented. If it works as well in practice as it does in theory, an ACRT like the one described above offers one potential way of improving transport efficiency. However, this is only one of many potential approaches to solving the problem of increased congestion. Regardless of the technology used, this is a space where innovation must happen if cities are to remain livable. While investment in underground rail is also a potential way of mitigating the problem, it will remain an extremely costly alternative unless innovation occurs in that domain.
Search Engine Optimization: A step by step process recommended by experts
Azure just completed its annual ecommerce marketing day. It was attended by 15 of our portfolio companies, two high level executives at major corporations, a very strong SEO consultant and the Azure team. The purpose of the day is to help the CMOs in the Azure portfolio gain a broader perspective on hot marketing topics and share ideas and best practices. This year’s agenda included the following sessions:
Working with QVC/HSN
Brand building
Using TV, radio and/or podcasts for marketing
Techniques to improve email marketing
Measuring and improving email marketing effectiveness
Storytelling to build your brand and drive marketing success
Working with celebrities, brands, popular YouTube personalities, etc.
Optimizing SEO
Product Listing Ads (PLAs) and Search Engine Marketing (SEM)
One pleasant aspect of the day is that it generated quite a few interesting ideas for blog posts! In other words, I learned a lot regarding the topics covered. This post is on an area many of you may believe you know well, Search Engine Optimization (SEO). I thought I knew it well too… before being exposed to a superstar consultant, Allison Lantz, who provided a cutting-edge presentation on the topic. With her permission, this post borrows freely from her content. Of course, I’ve added my own ideas in places and may have introduced some errors in thinking, and a short post can only touch on a few areas and is not a substitute for true expertise.
SEO is Not Free if You Want to Optimize
I have sometimes labeled SEO as a free source of visitors to a site, but Allison correctly points out that if you want to focus on Optimization (the O in SEO) with the search engines, then it isn’t free, but rather an ongoing process (and investment) that should be part of company culture. The good news is that SEO likely will generate high quality traffic that lasts for years and leads to a high ROI against the cost of striving to optimize. All content creators should be trained to write in a manner that optimizes generating traffic by using targeted key words in their content and ensuring these words appear in the places that are optimal for search. To be clear, it’s also best if the content is relevant, well written and user-friendly. If you were planning to create the content anyway, then the cost of doing this is relatively minor. However, if the content is incremental to achieve higher SEO rankings, then the cost will be greater. But I’m getting ahead of myself and need to review the step by step process Allison recommends to move towards optimization.
Keyword Research
The first thing to know when developing an SEO Strategy is what you are targeting to optimize. Anyone doing a search enters a word or phrase they are searching for. Each such word or phrase is called a ‘keyword’. If you want to gain more users through SEO, it’s critical to identify thousands, tens of thousands or even hundreds of thousands of keywords that are relevant to your site. For a fashion site, these could be brands, styles, and designers. For an educational site like Education.com (an Azure portfolio company that is quite strong in SEO and ranks on over 600,000 keywords) keywords might be math, english, multiplication, etc. The broader the keywords, the greater the likelihood of higher volume. But along with that comes more competition for search rankings and a higher cost per keyword. The first step in the process is spending time brainstorming what combinations of words are relevant to your site – in other words if someone searched for that specific combination would your site be very relevant to them? To give you an idea of why the number gets very high, consider again Education.com. Going beyond searching on “math”, one can divide math into arithmetic, algebra, geometry, calculus, etc. Each of these can then be divided further. For example, arithmetic can include multiplication, addition, division, subtraction, exponentiation, fractions and more. Each of these can be subdivided further with multiplication covering multiplication games, multiplication lesson plans, multiplication worksheets, multiplication quizzes and more.
Ranking Keywords
Once keywords are identified the next step is deciding which ones to focus on. The concept leads to ranking keywords based upon the likely number of clicks to your site that could be generated from each one and the expected value of potential users obtained through these clicks. Doing this requires determining for each keyword:
Monthly searches
Competition for the keyword
Conversion potential
Effort (and possible cost) required to achieve a certain ranking
Existing tools report the monthly volume of searches for each keyword (remember to add searches on Bing to those on Google). Estimating the strength of competition requires doing a search using the keyword and learning who the top-ranking sites are currently (given the volume of keywords to analyze, this is very labor intensive). If Amazon is a top site they may be difficult to surpass but if the competition includes relatively minor players, they would be easier to outrank.
The next question to answer for each keyword is: “What is the likelihood of converting someone who is searching on the keyword if they do come to my site”. For example, for Education.com, someone searching on ‘sesame street math games’ might not convert well since they don’t have the license to use Sesame Street characters in their math games. But someone searching on ‘1st grade multiplication worksheets’ would have a high probability of converting since the company is world-class in that area. The other consideration mentioned above is the effort required to achieve a degree of success. If you already have a lot of content relevant to a keyword, then search optimizing that content for the keyword might not be very costly. But, if you currently don’t have any content that is relevant or the keyword is very broad, then a great deal more work might be required.
Example of Keyword Ranking Analysis
Source: Education.com
Comparing Effort Required to Estimated Value of Keywords
Once you have produced the first table, you can make a very educated guess on your possible ranking after about 12 months (the time it may take Google/Bing to recognize your new status for that keyword).
There are known statistics on what the likely click-through rates (share of searches against the keyword) will be if you rank 1st, 2nd, 3rd, etc. Multiplying that by the average search volume for that keyword gives a reasonable estimate of the monthly traffic that this would generate to your site. The next step is to estimate the rate at which you will convert that traffic to members (where they register so you get their email) and/or customers (I’ll assume customers for the rest of this post but the same method would apply to members). Since you already know your existing conversion rate, in general, this could be your estimate. But, if you have been buying clicks on that keyword from Google or Bing, you may already have a better estimate of conversion. Multiplying the number of customers obtained by the LTV (Life Time Value) of a customer yields the $ value generated if the keyword obtains the estimated rank. Subtract from this the current value being obtained from the keyword (based on its current ranking) to see the incremental benefit.
Content Optimization
One important step to improve rankings is to use keywords in titles of articles. While the words to use may seem intuitive, it’s important to test variations to see how each may improve results. Will “free online multiplication games” outperform “free times table games”. The way to test this is by trying each for a different 2-week (or month) time period and see which gives a higher CTR (Click Through Rate). As discussed earlier, it’s also important to optimize the body copy against keywords. Many of our companies create a guide for writing copy that provides rules that result in better CTR.
The Importance of Links
Google views links from other sites to yours as an indication of your level of authority. The more important the site linking to you, the more it impacts Google’s view. Having a larger number of sites linking to you can drive up your Domain Authority (a search engine ranking score) which in turn will benefit rankings across all keywords. However, it’s important to be restrained in acquiring links as those from “Black Hats” (sites Google regards as somewhat bogus) can actually result in getting penalized. While getting another site to link to you will typically require some motivation for them, Allison warns that paying cash for a link is likely to result in obtaining some of them from black hat sites. Instead, motivation can be your featuring an article from the other site, selling goods from a partner, etc.
Other Issues
I won’t review it here but site architecture is also a relevant factor in optimizing SEO benefits. For a product company with tens of thousands of products, it can be extremely important to have the right titles and structure in how you list products. If you have duplicative content on your site, removing it may help your rankings, even if there was a valid reason to have such duplication. Changing the wording of content on a regular basis will help you maintain rankings.
Summary
SEO requires a well-thought-out strategy and consistent, continued execution to produce results. This is not a short-term fix, as an SEO investment will likely only start to show improvements four to six months after implementation with ongoing management. But as many of our portfolio companies can attest, it’s well worth the effort.
SoundBytes
It’s a new basketball season so I can’t resist a few comments. First, as much as I am a fan of the Warriors, it’s pretty foolish to view them as a lock to win as winning is very tenuous. For example, in game 5 of the finals last year, had Durant missed his late game three point shot the Warriors may have been facing the threat of a repeat of the 2016 finals – going back to Cleveland for a potential tying game.
Now that Russell Westbrook has two star players to accompany him we can see if I am correct that he is less valuable than Curry, who has repeatedly shown the ability to elevate all teammates. This is why I believe that, despite his two MVPs, Curry is under-rated!
With Stitchfix filing for an IPO, we are seeing the first of several next generation fashion companies emerging. In the filing, I noted the emphasis they place on SEO as a key component of their success. I believe new fashion startups will continue to exert pressure on traditional players. One Azure company moving towards scale in this domain is Le Tote – keep an eye on them!
Dining and shopping today is very different than in days gone by – the Amazon acquisition of Whole Foods is a result
“I used to drink it,” said Andy Warhol once of Campbell’s soup. “I used to have the same lunch every day, for 20 years, I guess, the same thing over and over again.” In Warhol’s signature medium, silkscreen, the artist reproduced his daily Campbell’s soup can over and over again, changing only the label graphic on each one.
When I was growing up I didn’t have exactly the same thing over and over like Andy Warhol, but virtually every dinner was at home, at our kitchen table (we had no dining room in the 4-room apartment). Eating out was a rare treat and my father would have been abhorred if my mom brought in prepared food. My mom, like most women of that era, didn’t officially work, but did do the bookkeeping for my dad’s plumbing business. She would shop for food almost every day at a local grocery and wheel it home in her shopping cart.
When my wife and I were raising our kids, the kitchen remained the most important room in the house. While we tended to eat out many weekend nights, our Sunday through Thursday dinners were consumed at home, but were sprinkled with occasional meals brought in from the outside like pizza, fried chicken, ribs, and Chinese food. Now, given a high proportion of households where both parents work, eating out, fast foods and prepared foods have become a large proportion of how Americans consume dinner. This trend has reached the point where some say having a traditional kitchen may disappear as people may cease cooking at all.
In this post, I discuss the evolution of our eating habits, and how they will continue to change. Clearly, the changes that have already occurred in shopping for food and eating habits were motivations for Amazon’s acquisition of Whole Foods.
The Range of How We Dine
Dining can be broken into multiple categories and families usually participate in all of them. First, almost 60% of dinners eaten at home are still prepared there. While the percentage has diminished, it is still the largest of the 4 categories for dinners. Second, many meals are now purchased from a third party but still consumed at home. Given the rise of delivery services and greater availability of pre-cooked meals at groceries, the category spans virtually every type of food. Thirdly, many meals are purchased from a fast food chain (about 25% of Americans eat some type of fast food every day1) and about 20% of meals2 are eaten in a car. Finally, a smaller percentage of meals are consumed at a restaurant. (Sources: 1Schlosser, Eric. “Americans Are Obsessed with Fast Food: The Dark Side of the All-American Meal.” CBSNews. Accessed April 14, 2014 / 2Stanford University. “What’s for Dinner?” Multidisciplinary Teaching and Research at Stanford. Accessed April 14, 2014).
The shift to consuming food away from home has been a trend for the last 50 years as families began going from one worker to both spouses working. The proportion of spending on food consumed away from home has consistently increased from 1965-2014 – from 30% to 50%.
Source: Calculated by the Economic Research Service, USDA, from various data sets from the U.S. Census Bureau and the Bureau of Labor Statistics.
With both spouses working, the time available to prepare food was dramatically reduced. Yet, shopping in a supermarket remained largely the same except for more availability of prepared meals. Now, changes that have already begun could make eating dinner at home more convenient than eating out with a cost comparable to a fast food chain.
Why Shopping for Food Will Change Dramatically over the Next 30 Years
Eating at home can be divided between:
Cooking from scratch using ingredients from general shopping
Buying prepared foods from a grocery
Cooking from scratch from recipes supplied with the associated ingredients (meal kits)
Ordering meals that have previously been prepared and only need to be heated up
Ordering meals from a restaurant that are picked up or delivered to your home
Ordering “fast food” type meals like pizza, ribs, chicken, etc. for pickup or delivery.
I am starting with the assumption that many people will still want to cook some proportion of their dinners (I may be romanticizing given how I grew up and how my wife and I raised our family). But, as cooking for yourself becomes an even smaller percentage of dinners, shopping for food in the traditional way will prove inefficient. Why buy a package of saffron or thyme or a bag of onions, only to see very little of it consumed before it is no longer usable? And why start cooking a meal, after shopping at a grocery, only to find you are missing an ingredient of the recipe? Instead, why not shop by the meal instead of shopping for many items that may or may not end up being used.
Shopping by the meal is the essential value proposition offered by Blue Apron, Plated, Hello Fresh, Chef’d and others. Each sends you recipes and all the ingredients to prepare a meal. There is little food waste involved (although packaging is another story). If the meal preparation requires one onion, that is what is included, if it requires a pinch of saffron, then only a pinch is sent. When preparing one of these meals you never find yourself missing an ingredient. It takes a lot of the stress and the food waste out of the meal preparation process. But most such plans, in trying to keep the cost per meal to under $10, have very limited choices each week (all in a similar lower cost price range) and require committing to multiple meals per week. Chef’d, one of the exceptions to this, allows the user to choose individual meals or to purchase a weekly subscription. They also offer over 600 options to choose from while a service like Blue Apron asks the subscriber to select 3 out of 6 choices each week.
Blue Apron meals portioned perfectly for the amount required for the recipes
My second assumption is that the number of meals that are created from scratch in an average household will diminish each year (as it already has for the past 50 years). However, many people will want to have access to “preferred high quality” meals that can be warmed up and eaten, especially in two-worker households. This will be easier and faster (but perhaps less gratifying) than preparing a recipe provided by a food supplier (along with all the ingredients). I am talking about going beyond the pre-cooked items in your average grocery. There are currently sources of such meals arising as delivery services partner with restaurants to provide meals delivered to your doorstep. But this type of service tends to be relatively expensive on a per meal basis.
I expect new services to arise (we’ve already seen a few) that offer meals that are less expensive prepared by “home chefs” or caterers and ordered through a marketplace (this is category 4 in my list). The marketplace will recruit the chefs, supply them with packaging, take orders, deliver to the end customers, and collect the money. Since the food won’t be from a restaurant, with all the associated overhead, prices can be lower. Providing such a service will be a source of income for people who prefer to work at home. Like drivers for Uber and Lyft, there should be a large pool of available suppliers who want to work in this manner. It will be very important for the marketplaces offering such service to curate to ensure that the quality and food safety standards of the product are guaranteed. The availability of good quality, moderately priced prepared meals of one’s choice delivered to the home may begin shifting more consumption back to the home, or at a minimum, slow the shift towards eating dinners away from home.
Where will Amazon be in the Equation?
In the past, I predicted that Amazon would create physical stores, but their recent acquisition of Whole Foods goes far beyond anything I forecast by providing them with an immediate, vast network of physical grocery stores. It does make a lot of sense, as I expect omnichannel marketing to be the future of retail. My reasoning is simple: on the one hand, online commerce will always be some minority of retail (it currently is hovering around 10% of total retail sales); on the other hand, physical retail will continue to lose share of the total market to online for years to come, and we’ll see little difference between e-commerce and physical commerce players. To be competitive, major players will have to be both, and deliver a seamless experience to the consumer.
Acquiring Whole Foods can make Amazon the runaway leader in categories 1 and 2, buying ingredients and/or prepared foods to be delivered to your home. Amazon Fresh already supplies many people with products that are sourced from grocery stores, whether they be general food ingredients or traditional prepared foods supplied by a grocery. They also have numerous meal kits that they offer, and we expect (and are already seeing indications) that Amazon will follow the Whole Foods acquisition by increasing its focus on “meal kits” as it attempts to dominate this rising category (3 in our table).
One could argue that Whole Foods is already a significant player in category 4 (ordering meals that are prepared, and only need to be heated up), believing that category 4 is the same as category 2 (buying prepared meals from a grocery). But it is not. What we envision in the future is the ability to have individuals (who will all be referred to as “Home Chefs” or something like that) create brands and cook foods of every genre, price, etc. Customers will be able to order a set of meals completely to their taste from a local home chef. The logical combatants to control this market will be players like Uber and Lyft, guys like Amazon and Google, existing recipe sites like Blue Apron…and new startups we’ve never heard of.
A key marketing tool for companies is to hold an event like a user’s conference or a topical forum to build relationships with their customers and partners, drive additional revenue and/or generate business development opportunities. Azure held its 11th annual CEO Summit last week, and as we’re getting great feedback on the success of the conference, I thought it might be helpful to dig deeply into what makes a conference effective. I will use the Azure event as the example but try to abstract rules and lessons to be learned, as I have been asked for my advice on this topic by other firms and companies.
Step 1. Have a clear set of objectives
For the Azure CEO Summit, our primary objectives are to help our portfolio companies connect with:
Corporate and Business Development executives from relevant companies
Potential investors (VCs and Family Offices)
Investment banks so the companies are on the radar and can get invited to their conferences
Debt providers for those that can use debt as part of their capital structure
A secondary objective of the conference is to build Azure’s brand thereby increasing our deal flow and helping existing and potential investors in Azure understand some of the value we bring to the table.
When I created a Wall Street tech conference in the late 90’s, the objectives were quite different. They still included brand building, but I also wanted our firm to own trading in tech stocks for that week, have our sell side analysts gain reputation and following, help our bankers expand their influence among public companies, and generate a profit for the firm at the same time. We didn’t charge directly for attending but monetized through attendees increasing use of our trading desk and more companies using our firm for investment banking.
When Fortune began creating conferences, their primary objective was to monetize their brand in a new way. This meant charging a hefty price for attending. If people were being asked to pay, the program had to be very strong, which they market quite effectively.
Conferences that have clear objectives, and focus the activities on those objectives, are the most successful.
Step 2. Determine invitees based on who will help achieve those objectives
For our Summit, most of the invitees are a direct fallout from the objectives listed above. If we want to help our portfolio companies connect with the above-mentioned constituencies, we need to invite both our portfolio CEOs and the right players from corporations, VCs, family offices, investment banks and debt providers. To help our brand, inviting our LPs and potential LPs is important. To insure the Summit is at the quality level needed to attract the right attendees we also target getting great speakers. As suggested by my partners and Andrea Drager, Azure VP (and my collaborator on Soundbytes) we invited several non-Azure Canadian startups. In advance of the summit, we asked Canadian VCs to nominate candidates they thought would be interesting for us and we picked the best 6 to participate in the summit. This led to over 70 interesting companies nominated and added to our deal flow pipeline.
Step 3. Create a program that will attract target attendees to come
This is especially true in the first few years of a conference while you build its reputation. It’s important to realize that your target attendees have many conflicting pulls on their time. You won’t get them to attend just because you want them there! Driving attendance from the right people is a marketing exercise. The first step is understanding what would be attractive to them. In Azure’s case, they might not understand the benefit of meeting our portfolio companies, but they could be very attracted by the right keynotes.
Azure’s 2017 Summit Keynote Speakers: Mark Lavelle, CEO of Magento Commerce & Co-founder of Bill Me Later. Cameron Lester, Managing Director and Co-Head of Global Technology Investment Banking, Jeffries. Nagraj Kashyap, Corporate VP & Global Head, Microsoft Ventures.
Over the years we have had the heads of technology investment banking from Qatalyst, Morgan Stanley, Goldman, JP Morgan and Jeffries as one of our keynote speakers. From the corporate world, we also typically have a CEO, former CEO or chairman of notable companies like Microsoft, Veritas, Citrix, Concur and Audible as a second keynote. Added to these were CEOs of important startups like Stance and Magento and terrific technologists like the head of Microsoft Labs.
Finding the right balance of content, interaction and engagement is challenging, but it should be explicitly tied to meeting the core objectives of the conference.
Step 4. Make sure the program facilitates meeting your objectives
Since Azure’s primary objective is creating connections between our portfolio (and this year, the 6 Canadian companies) with the various other constituencies we invite, we start the day with speed dating one-on-ones of 10 minutes each. Each attendee participating in one-on-ones can be scheduled to meet up to 10 entities between 8:00AM and 9:40. Following that time, we schedule our first keynote.
In addition to participating in the one-on-ones, which start the day, 26 of our portfolio companies had speaking slots at the Summit, intermixed with three compelling keynote speakers. Company slots are scheduled between keynotes to maximize continued participation. This schedule takes us to about 5:00pm. We then invite the participants and additional VCs, lawyers and other important network connections to join us for dinner. The dinner increases everyone’s networking opportunity in a very relaxed environment.
These diverse types of interaction phases throughout the conference (one-on-ones, presentations, discussions, and networking) all facilitate a different type of connection between attendees, focused on maximizing the opportunity for our portfolio companies to build strong connections.
Azure Portfolio Company CEO Presentations: Chairish, Megabots & Atacama
Step 5. Market the program you create to the target attendees
I get invited to about 30 conferences each year plus another 20-30 events. It’s safe to assume that most of the invitees to the Azure conference get a similar (or greater) number of invitations. What this means is that it’s unlikely that people will attend if you send an invitation but then don’t effectively market the event (especially in the first few years). It is important to make sure every key invitee gets a personal call, email, or other message from an executive walking them through the agenda and highlighting the value to them (link to fortune could also go here). For the Azure event, we highlight the great speakers but also the value of meeting selected portfolio companies. Additionally, one of my partners or I connect with every attendee we want to do one-on-ones with portfolio companies to stress why this benefits them and to give them the chance to alter their one-on-one schedule. This year we managed over 320 such meetings.
When I created the first “Quattrone team” conference on Wall Street, we marketed it as an exclusive event to portfolio managers. While the information exchanged was all public, the portfolio managers still felt they would have an investment edge by being at a smaller event (and we knew the first year’s attendance would be relatively small) where all the important tech companies spoke and did one-on-one meetings. For user conferences, it can help to land a great speaker from one of your customers or from the industry. For example, if General Electric, Google, Microsoft or some similar important entity is a customer, getting them to speak will likely increase attendance. It also may help to have an industry guru as a speaker. If you have the budget, adding an entertainer or other star personality can also add to the attraction, as long as the core agenda is relevant to attendees.
Step 6. Decide on the metrics you will use to measure success
It is important to set targets for what you want to accomplish and then to measure whether you’ve achieved those targets. For Azure, the number of entities that attend (besides our portfolio), the number of one-on-one meetings and the number of follow-ups post the conference that emanate from one-on-one are three of the metrics we measure. One week after the conference, I already know that we had over 320 one-on-ones which, so far, has led to about 50 follow ups that we are aware of including three investments in our portfolio. We expect to learn of additional follow up meetings but this has already exceeded our targets.
Step 7. Make sure the value obtained from the conference exceeds its cost
It is easy to spend money but harder to make sure the benefit of that spend exceeds its cost. On one end of the spectrum, some conferences have profits as one of the objectives. But in many cases, the determination of success is not based on profits, but rather on meeting objectives at a reasonable cost. I’ve already discussed Azure’s objectives but most of you are not VCs. For those of you dealing with customers, your objectives can include:
Signing new customers
Reducing churn of existing customers
Developing a better understanding of how to evolve your product
Strong press pickup / PR opportunity
Spending money on a conference should always be compared to other uses of those marketing dollars. To the degree you can be efficient in managing it, the conference can become a solid way to utilize marketing dollars. Some of the things we do for the Azure conference to control cost which may apply to you include:
Partnering with a technology company to host our conference instead of holding it at a hotel. This only works if there is value to your partner. Cost savings is about 60-70%.
Making sure our keynotes are very relevant but are at no cost. You can succeed at this with keynotes from your customers and/or the industry. Cost savings is whatever you might have paid someone.
Having the dinner for 150 people at my house. This has two benefits: it is a much better experience for those attending and the cost is about 70% less than having it at a venue.
Summary
I have focused on using the Azure CEO Summit as the primary example but the rules laid out apply in general. They not only will help you create a successful conference but following them means only holding it if its value to you exceeds its cost.
If you look at that post, you’ll see that my logic appears to have been born out, as my main reason was that Durant was likely to win a championship and this would be very instrumental in helping his reputation/legacy.
Not mentioned in that post was the fact that he would also increase his enjoyment of playing, because playing with Curry, Thompson, Green and the rest of the Warriors is optimizing how the game should be played
Now it’s up to both Durant and Curry to agree to less than cap salaries so the core of the team can be kept intact for many years. If they do, and win multiple championships, they’ll probably increase endorsement revenue. But even without that offset my question is “How much is enough?” I believe one can survive nicely on $30-$32 million a year (Why not both agree to identical deals for 4 years, not two?). Trying for the maximum is an illusion that can be self-defeating. The difference will have zero impact on their lives, but will keep players like Iguodala and Livingston with the Warriors, which could have a very positive impact. I’m hoping they can also keep West, Pachulia and McGee as well.
It would also be nice if Durant and Curry got Thompson and Green to provide a handshake agreement that they would follow the Durant/Curry lead on this and sign for the same amount per year when their contracts came up. Or, if Thompson and Green can extend now, to do the extension at equal pay to what Curry and Durant make in the extension years. By having all four at the same salary at the end of the period, the Warriors would be making a powerful statement of how they feel about each other.
Amazon & Whole Foods…
Amazon’s announced acquisition of Whole Foods is very interesting. In a previous post, we predicted that Amazon would open physical stores. Our reasoning was that over 90% of retail revenue still occurs offline and Amazon would want to attack that. I had expected these to be Guide Stores (not carrying inventory but having samples of products). Clearly this acquisition shows that, at least in food, Amazon wants to go even further. I will discuss this in more detail in a future post.
I have become quite interested in analyzing theater, in particular, Broadway and Off-Broadway shows for two reasons:
I’m struck by the fact that revenue for the show Hamilton is shaping up like a Unicorn tech company
My son Matthew is producing a show that is now launching at a NYC theater, and as I have been able to closely observe the 10-year process of it getting to New York, I see many attributes that are consistent with a startup in tech.
Incubation
It is fitting that Matthew’s show, Ernest Shackleton Loves Me, was first incubated at Theatreworks, San Francisco, as it is the primary theater of Silicon Valley. Each year the company hosts a “writer’s retreat” to help incubate new shows. Teams go there for a week to work on the shows, all expenses paid. Theatreworks supplies actors, musicians, and support so the creators can see how songs and scenes seem to work (or not) when performed. Show creators exchange ideas much like what happens at a tech incubator. At the culmination of the week, a part of each show is performed before a live audience to get feedback.
Creation of the Beta Version
After attending the writer’s retreat the creators of Shackleton needed to do two things: find a producer (like a VC, a Producer is a backer of the show that recruits others to help finance the project); and add other key players to the team – a book writer, director, actors, etc. Recruiting strong players for each of these positions doesn’t guarantee success but certainly increases the probability. In the case of Shackleton, Matthew came on as lead producer and he and the team did quite well in getting a Tony winning book writer, an Obie winning director and very successful actors on board. Once this team was together an early (beta version) of the show was created and it was performed to an audience of potential investors (the pitch). Early investors in the show are like angel investors as risk is higher at this point.
Beta Testing
The next step was to run a beta test of the product – called the “out of town tryout”. In general, out of town is anyplace other than New York City. It is used to do continuous improvement of the show much like beta testing is used to iterate a technology product based on user feedback. Theater critics also review shows in each city where they are performed. Ernest Shackleton Loves Me (Shackleton) had three runs outside of NYC: Seattle, New Jersey and Boston. During each, the show was improved based on audience and critic reaction. While it received rave reviews in each location, critics and the live audience can be helpful as they usually still can suggest ways that a show can be improved. Responding to that feedback helps prepare a show for a New York run.
Completing the Funding
Like a tech startup, it becomes easier to raise money in theater once the product is complete. In theater, a great deal of funding is required for the steps mentioned above, but it is difficult to obtain the bulk of funding to bring a show to New York for most shows without having actual performances. An average musical that goes to Off-Broadway will require $1.0 – $2.0 million in capitalization. And an average one that goes to Broadway tends to capitalize between $8 – $17 million. Hamilton cost roughly $12.5 million to produce, while Shackleton will capitalize at the lower end of the Off-Broadway range due to having a small cast and relatively efficient management. For many shows the completion of funding goes through the early days of the NYC run. It is not unusual for a show to announce it will open at a certain theater on a certain date and then be unable to raise the incremental money needed to do so. Like a tech startup, some shows, like Shackleton, may run a crowdfunding campaign to help top off its funding.
You can see what a campaign for a theater production looks like by clicking on this link and perhaps support the arts, or by buying tickets on the website (since the producer is my son, I had to include that small ask)!
The Product Launch
Assuming funding is sufficient and a theater has been secured (there currently is a shortage of Broadway theaters), the New York run then begins. This is the true “product launch”. Part of a shows capitalization may be needed to fund a shortfall in revenue versus weekly cost during the first few weeks of the show as reviews plus word of mouth are often needed to help drive revenue above weekly break-even. Part of the reason so many Broadway shows employ famous Hollywood stars or are revivals of shows that had prior success and/or are based on a movie, TV show, or other well-known property is to insure substantial initial audiences. Some examples of this currently on Broadway are Hamilton (bestselling book), Aladdin (movie), Beautiful (Carole King story), Chicago (revival of successful show), Groundhog Day (movie), Hello Dolly (revival plus Bette Midler as star) and Sunset Boulevard (revival plus Glenn Close as star).
Crossing Weekly Break Even
Gross weekly burn for shows have a wide range (just like startups), with Broadway musicals having weekly costs from $500,000 to about $800,000 and Off-Broadway musicals in the $50,000 to $200,000 range. In addition, there are royalties of roughly 10% of revenue that go to a variety of players like the composer, book writer, etc. Hamilton has about $650,000 in weekly cost and roughly a $740,000 breakeven level when royalties are factored in. Shackleton weekly costs are about $53,000, at the low end of the range for an off-Broadway musical, at under 10% of Hamilton’s weekly cost.
Is Hamilton the Facebook of Broadway?
Successful Broadway shows have multiple sources of revenue and can return significant multiples to investors.
Chart 1: A ‘Hits’ Business Example Capital Account
Since Shackleton just had its first performance on April 14, it’s too early to predict what the profit (or loss) picture will be for investors. On the other hand, Hamilton already has a track record that can be analyzed. In its first months on Broadway the show was grossing about $2 million per week which I estimate drove about $ 1 million per week in profits. Financial investors, like preferred shareholders of a startup, are entitled to the equivalent of “liquidation preferences”. This meant that investors recouped their money in a very short period, perhaps as little as 13 weeks. Once they recouped 110%, the producer began splitting profits with financial investors. This reduced the financial investors to roughly 42% of profits. In the early days of the Hamilton run, scalpers were reselling tickets at enormous profits. When my wife and I went to see the show in New York (March 2016) we paid $165 per ticket for great orchestra seats which we could have resold for $2500 per seat! Instead, we went and enjoyed the show. But if a scalper owned those tickets they could have made 15 times their money. Subsequently, the company decided to capture a portion of this revenue by adjusting seat prices for the better seats and as a result the show now grosses nearly $3 million per week. Since fixed weekly costs probably did not change, I estimate weekly profits are now about $1.8 million. At 42% of this, investors would be accruing roughly $750,000 per week. At this run rate, investors would receive over 3X their investment dollars annually from this revenue source alone if prices held up.
Multiple Companies Amplify Revenue and Profits
Currently Hamilton has a second permanent show in Chicago, a national touring company in San Francisco (until August when it’s supposed to move to LA) and has announced a second touring company that will begin the tour in Seattle in early 2018 before moving to Las Vegas and Cleveland and other stops. I believe it will also have a fifth company in London and a sixth in Asia by late 2018 or early 2019. Surprisingly, the touring companies can, in some cities, generate more weekly revenue than the Broadway company due to larger venues. Table 1 shows an estimate of the revenue per performance in the sold out San Francisco venue, the Orpheum Theater which has a capacity 2203 versus the Broadway capacity (Richard Rogers Theater) of 1319.
Table 1: Hamilton San Francisco Revenue Estimates
While one would expect Broadway prices to be higher, this has not been the case. I estimate the average ticket price in San Francisco to be $339 whereas the average on Broadway is now $282. The combination of 67% higher seating capacity and 20% higher average ticket prices means the revenue per week in San Francisco is now close to $6 million. Since it was lower in the first 4 weeks of the 21 plus week run, I estimate the total revenue for the run to be about $120 million. Given the explosive revenue, I wouldn’t be surprised if the run in San Francisco was extended again. While it has not been disclosed what share of this revenue goes to the production company, normally the production company is compensated as a base guarantee level plus a share of the profits (overage) after the venue covers its labor and marketing costs. Given these high weekly grosses, I assume the production company’s share is close to 50% of the grosses given the enormous profits versus an average show at the San Francisco venue (this would include both guarantee and overage). At 50% of revenue, there would still be almost $3 million per week to go towards paying the production company expenses (guarantee) and the local theater’s labor and marketing costs. If I use a lower $2 million of company share per week as profits to the production company that annualizes at over $100 million in additional profits or $42 million more per year for financial investors. The Chicago company is generating lower revenue than in San Francisco as the theater is smaller (1800 seats) and average ticket prices appear to be closer to $200. This would make revenue roughly $2.8 million per week. When the show ramps to 6 companies (I think by early 2019) the show could be generating aggregate revenue of $18-20 million per week or more should demand hold up. So, it would not be surprising if annual ticket revenue exceeded $1 billion per year at that time.
Merchandise adds to the mix
I’m not sure what amount of income each item of merchandise generates to the production company. Items like the cast album and music downloads could generate over $25 million in revenue, but in general only 40% of the net income from this comes to the company. On the other hand, T-shirts ($50 each) and the high-end program ($20 each) have extremely large margin which I think would accrue to the production company. If an average attendee of the show across the 6 (future) or more production companies spent $15 this could mean $1.2 million in merchandise sales per week across the 6 companies or another $60 million per year in revenue. At 60% gross margin this would add another $36 million in profits.
I expect Total Revenue for Hamilton to exceed $10 billion
In addition to the sources of revenue outlined above Hamilton will also have the opportunity for licensing to schools and others to perform the show, a movie, additional touring companies and more. It seems likely to easily surpass the $6 billion that Lion King and Phantom are reported to have grossed to date, or the $4 billion so far for Wicked. In fact, I believe it eventually will gross over a $10 billion total. How this gets divided between the various players is more difficult to fully access but investors appear likely to receive over 100x their investment, Lin-Manuel Miranda could net as much as $ 1 billion (before taxes) and many other participants should become millionaires.
Surprisingly Hamilton may not generate the Highest Multiple for Theater Investors!
Believe it or not, a very modest musical with 2 actors appears to be the winner as far as return on investment. It is The Fantasticks which because of its low budget and excellent financial performance sustained over decades is now over a 250X return on invested capital. Obviously, my son, an optimistic entrepreneur, hopes his 2 actor musical, Ernest Shackleton Loves Me, will match this record.
One example of the anti-consumer practices by airline loyalty programs.
As more and more of our life consists of interacting with technology, it is easier and easier to have our time on an iPhone, computer or game device become all consuming. The good news is that it is so easy for each of us to interact with colleagues, friends and relatives; to shop from anywhere; to access transportation on demand; and to find information on just about anything anytime. The bad news is that anyone can interact with us: marketers can more easily bombard us, scammers can find new and better ways to defraud us, and identity thieves can access our financials and more. When friends email us or post something on Facebook, there is an expectation that we will respond. This leads to one of the less obvious negatives: marketers and friends may not consider whether what they send is relevant to us and can make us inefficient.
In this post, I want to focus on lessons entrepreneurs can learn from products and technologies that many of us use regularly but that have glaring inefficiencies in their design, or those that employ business practices that are anti-consumer. One of the overriding themes is that companies should try to adjust to each consumer’s preferences rather than force customers to do unwanted things. Some of our examples may sound like minor quibbles but customers have such high expectations that even small offenses can result in lost customers.
Lesson 1: Getting email marketing right
Frequency of email
The question: “How often should I be emailing existing and prospective customers?” has an easy answer. It is: “As often as they want you to.” If you email them too frequently the recipients may be turned off. If you send too few, you may be leaving money on the table. Today’s email marketing is still in a rudimentary stage but there are many products that will automatically adjust the frequency of emails based on open rates. Every company should use these. I have several companies that send me too many emails and I have either opted out of receiving them or only open them on rare occasions. In either case the marketer has not optimized their sales opportunity.
Relevance of email
Given the amount of data that companies have on each of us one would think that emails would be highly personalized around a customer’s preferences and product applicability. One thing to realize is that part of product applicability is understanding frequency of purchase of certain products and not sending a marketing email too soon for a product that your customer would be unlikely to be ready to buy. One Azure portfolio company, Filter Easy, offers a service for providing air filters. Filter Easy gives each customer a recommended replacement time from the manufacturer of their air conditioner. They then let the customer decide replacement frequency and the company only attempts to sell units based on this time table. Because of this attention to detail, Filter Easy has one of the lowest customer churn rates of any B to C company. In contrast to this, I receive marketing emails from the company I purchase my running shoes from within a week of buying new ones even though they should know my replacement cycle is about every 6 months unless there is a good sale (where I may buy ahead). I rarely open their emails now, but would open more and be a candidate for other products from them if they sent me fewer emails and thought more about which of their products was most relevant to me given what I buy and my purchase frequency. Even the vaunted Amazon has sent me emails to purchase a new Kindle within a week or so of my buying one, when the replacement cycle of a Kindle is about 3 years.
In an idea world, each customer or potential customer would receive emails uniquely crafted for them. An offer to a customer would be ranked by likely value based on the customer profile and item profile. For example, customers who only buy when items are on sale should be profiled that way and only sent emails when there is a sale. Open Road, another Azure company, has created a daily email of deeply discounted e-books and gets a very high open rate due to the relevance of their emails (but cuts frequency for subscribers whose open rates start declining).
Lesson 2: Learning from Best Practices of Others
I find it surprising when a company launches a new version of a software application without attempting to incorporate best practices of existing products. Remember Lotus 123? They refused to create a Windows version of their spreadsheet for a few years and instead developed one for OS/2 despite seeing Excel’s considerable functionality and ease of use sparking rapid adoption. By the time they created a Windows version, it was too late and they eventually saw their market share erode from a dominant position to a minimal level. In more modern times, Apple helped Blackberry survive well past it’s expected funeral by failing to incorporate many of Blackberry’s strong email features into the iPhone. Even today, after many updates to mail, Apple still is missing such simple features like being able to hit a “B” to go to the bottom of my email stack on the iPhone. Instead, one needs to scroll down through hundreds of emails to get to the bottom if you want to process older emails first. This wastes lots of time. But Microsoft Outlook in some ways is even worse as it has failed to incorporate lookup technology from Blackberry (and now from Apple) that always allows finding an email address from a person’s name. When one has not received a recent email from a person in your contact list, and the person’s email address is not their name, outlook requires an exact email address. When this happens, I wind up looking it the person’s contact information on my phone!
Best practices extends beyond software products to marketing, packaging, upselling and more. For example, every ecommerce company should study Apple packaging to understand how a best in class branding company packages its products. Companies also have learned that in many cases they need to replicate Amazon by providing free shipping.
Lesson 3: The Customer is Usually Right
Make sure customer loyalty programs are positive for customers but affordable for the company
With few exceptions, companies should adopt a philosophy that is very customer-centric. Failing to do so has negative consequences. For example, the airline industry has moved towards giving customers little consideration and this results in many customers no longer having a preferred airline, instead looking for best price and/or most convenient scheduling. Whereas the mileage programs from airlines were once a very attractive way of retaining customers, the value of miles has eroded to such a degree that travelers have lost much of the benefit. This may have been necessary for the airlines as the liability associated with outstanding points reached billions of dollars. But, in addition, airlines began using points as a profit center by selling miles to credit cards at 1.5 cents per mile. Then, to make this a profitable sale, moved average redemption value to what I estimate to be about 1 cent per point. This leads to a concern of mine for consumers. Airlines are selling points at Kiosks and online for 3 cents per point, in effect charging 3 times their cash redemption value.
The lesson here is that if you decide to initiate a loyalty points program, make sure the benefits to the customer increase retention, driving additional revenue. But also make sure that the cost of the program does not exceed the additional revenue. (This may not have been the case for airlines when their mileage points were worth 3-4 cents per mile). It is important to recognize the future cost associated with loyalty points at the time they are given out (based on their exchange value) as this lowers the gross margin of the transaction. We know of a company that failed to understand that the value of points awarded for a transaction so severely reduced the associated gross margin that it was nearly impossible for them to be profitable.
Make sure that customer service is very customer centric
During the Thanksgiving weekend I was buying a gift online and found that Best Buy had what I was looking for on sale. I filled out all the information to purchase the item, but when I went to the last step in the process, my order didn’t seem to be confirmed. I repeated the process and again had the same experience. So, I waited a few days to try again, but by then the sale was no longer valid. My assistant engaged in a chat session with their customer service to try to get them to honor the sale price, and this was refused (we think she was dealing with a bot but we’re not positive). After multiple chats, she was told that I could try going to one of their physical stores to see if they had it on sale (extremely unlikely). Instead I went to Amazon and bought a similar product at full price and decided to never buy from Best Buy’s online store again. I know from experience that Amazon would not behave that way and Azure tries to make sure none of our portfolio companies would either. Turning down what would still have been a profitable transaction and in the process losing a customer is not a formula for success! While there may be some lost revenue in satisfying a reasonable customer request the long term consequence of failing to do so usually will far outweigh this cost.
Much has been written about the fact that Russell Westbrook was not chosen for the first team on the Western All-Stars. The implication appears to be that he was more deserving than Curry. I believe that Westbrook is one of the greatest athletes to play the game and one of the better players currently in the league. Yet, I also feel strongly that so much weight is being placed on his triple doubles that he is being unfairly anointed as the more deserving player. This post takes a deeper dive into the available data and, I believe, shows that Curry has a greater impact on winning games and is deserving of the first team honor. So, as is my want to analyze everything, I spent some time dissecting the comparison between the two. It is tricky comparing the greatest shooter to ever play the game to one of the greatest athletes to ever play, but I’ll attempt it, statistic by statistic.
Rebounding
Westbrook is probably the best rebounding guard of all time (with Oscar Robertson and Magic Johnson close behind). This season he is averaging 10.4 rebounds per game while Curry is at 4.3. There is no question that Westbrook wins hands down in this comparison with Curry, who is a reasonably good rebounding point guard. But on rebounds per 36 minutes played this season, Westbrook’s stats are even better than Oscar’s in his best year. In that year, Robertson averaged 12.5 rebounds playing over 44 minutes a game which equates to 10.2 per 36 minutes vs Westbrook’s 10.8 per 36 minutes (Magic never averaged 10 rebounds per game for a season).
Assists
You may be surprised when I say that Curry is a better assist producer than Westbrook this season. How can this be when Westbrook averages 10.3 assists per game and Curry only 6.2? Since Oklahoma City plays a very different style of offense than the Warriors, Westbrook has the ball in his hands a much larger percentage of the time. They both usually bring the ball up the court but once over half court, the difference is striking. Curry tends to pass it off a high proportion of the time while Westbrook holds onto it far longer. Because of the way Curry plays, he leads the league in secondary assists (passes that set up another player to make an assist) at 2.3 per game while Westbrook is 35th in the league at 1.1 per game. The longer one holds the ball the more likely they will shoot it, commit a turnover or have an assist and the less likely they will get a secondary assist. The reason is that if they keep the ball until the 24 second clock has nearly run out before passing, the person they pass it to needs to shoot (even if the shot is a poor one) rather than try to set up someone else who has an easier shot. For example, if a player always had the ball for the first 20 seconds of the 24 second clock, they would likely have all assists for the team while on the court.
Table 1: Assist Statistic Comparison
*NBA.com statistics average per game through Feb 1st, 2017
When in the game, Westbrook holds the ball about 50% of the time his team is on offense, he gets a large proportion of the team’s assists. But that style of play also means that the team winds up with fewer assists in total. In fact, while the Warriors rank #1 in assists as a team by a huge margin at 31.1 per game (Houston is second at 25.6), Oklahoma City is 20th in the league at 21.2 per game. If you agree that the opportunity to get an assist increases with the number of minutes the ball is in the player’s possession, then an interesting statistic is the number of assists per minute that a player possesses the ball (see Table 1). If we compare the two players from that perspective, we see that Curry has 1.27 assists per minute and Westbrook 1.17. Curry also has 0.47 secondary assists per minute while Westbrook only 0.13. This brings the total primary and secondary assist comparison to 1.74 per minute of possession for Curry and 1.30 for Westbrook, a fairly substantial difference. It also helps understand why the Warriors average so many more assists per game than Oklahoma City and get many more easy baskets. This leads to them having the highest field goal percentage in the league, 50.1%.
Shooting
Russell Westbrook leads the league in scoring, yet his scoring is less valuable to his team than Stephen Curry’s is to the Warriors. This sounds counterintuitive but it is related to the shooting efficiency of the player: Curry is extremely efficient and Westbrook is inefficient as a shooter. To help understand the significance of this I’ll use an extreme example. Suppose the worst shooter on a team took every one of a team’s 80 shots in a game and made 30% of them including two 3-point shots. He would score 24 baskets and lead the league in scoring by a mile at over 50 points per game (assuming he also got a few foul shots). However, his team would only average 50 or so points per game and likely would lose every one of them. If, instead, he took 20 of the 80 shots and players who were 50% shooters had the opportunity to take the other 60, the team’s field goals would increase from 24 to 36. Westbrook’s case is not the extreme of our example but none-the-less Westbrook has the lowest efficiency of the 7 people on his team who play the most minutes. So, I believe his team overall would score more points if other players had more shooting opportunities. Let’s look at the numbers.
Table 2: Shot Statistic Comparison
*NBA.com statistics average per game through Feb 1st, 2017
Westbrook’s shooting percentage of 42.0% is lower than the worst shooting team in the league, Memphis at 43.2%, and, as mentioned is the lowest of the 7 people on his team that play the most minutes. Curry has a 5.5% higher percentage than Westbrook. But the difference in their effectiveness is even greater as Curry makes far more three point shots. Effective shooting percentage adjusts for 3 point shots made by considering them equal to 1½ two point shots. Curry’s effective shooting percentage is 59.1% and Westbrook’s is 46.4%, an extraordinary difference. However, Westbrook gets to the foul line more often and “true shooting percent” takes that into account by assuming about 2.3 foul shots have replaced one field goal attempt (2.3 is used rather than 2.0 to account for 3 point plays and being fouled on a 3-point shot). Using the “true shooting percentage” brings Westbrook’s efficiency slightly closer to Curry’s, but it is still nearly 10% below Curry (see table 2). What this means is very simple – if Curry took as many shots as Westbrook he would score far more. In fact, at his efficiency level he would average 36.1 points per game versus Westbrook’s 30.7. While it is difficult to prove this, I believe if Westbrook reduced his number of shots Oklahoma City would score more points, as other players on his team, with a higher shooting percentage, would have the opportunity to shoot more. And he might be able to boost his efficiency as a shooter by eliminating some ill-advised shots.
Turnovers vs Steals
This comparison determines how many net possessions a player loses for his team by committing more turnovers than he has steals. Stephen Curry averages 2.9 turnovers and 1.7 steals per game, resulting in a net loss of 1.2 possessions per game. Russell Westbrook commits about 5.5 turnovers per game and has an average of 1.6 steals, resulting in a net loss of 3.9 possessions per game, over 3 times the amount for Curry.
Plus/Minus
In many ways, this statistic is the most important one as it measures how much more a player’s team scores than its opponents when that player is on the floor. However, the number is impacted by who else is on your team so the quality of your teammates clearly will contribute. Nonetheless, the total impact Curry has on a game through high effective shooting percent and assists/minute with the ball is certainly reflected in the average point differential for his team when he is on the floor. Curry leads the league in plus/minus for the season as his team averages 14.5 more points than its opponents per 36 minutes he plays. Westbrook’s total for the season is 41st in the league and his team averages +3.4 points per 36 minutes.
Summing Up
While Russell Westbrook is certainly a worthy all-star, I believe that Stephen Curry deserves having been voted a starter (as does James Harden but I don’t think Harden’s selection has been questioned). Westbrook stands out as a great rebounding guard, but other aspects of his amazing triple double run are less remarkable when compared to Curry. Curry is a far more efficient scorer and any impartial analysis shows that he would average more points than Westbrook if he took the same number of shots. At the same time, Curry makes his teammates better by forcing opponents to space the floor, helping create more open shots for Durant, Thompson and others. He deserves some of the credit for Durant becoming a more efficient scorer this year than any time in his career. While Westbrook records a far larger number of assists per game than Curry, Curry is a more effective assist creator for the time he has the ball, helping the Warriors flirt with the 32-year-old record for team assists per game while Oklahoma City ranks 20th of the 30 current NBA teams with 10 less assists per game than the Warriors.
When I was on Wall Street I became very boring by having the same three strong buy recommendations for many years until I downgraded Compaq in 1998 (it was about 30X the original price at that point). The other two, Microsoft and Dell, remained strong recommendations until I left in 2000. At the time, they were each well over 100X the price of my original recommendation. I mention this because my favorite stocks for this blog include Facebook and Tesla for the 4th year in a row. They are both over 5X what I paid for them in 2013 (23 and 45, respectively) and I continue to own both. Will they get to 100X or more? This is not likely, as companies like them have had much higher valuations when going public compared with Microsoft or Dell, but I believe they continue to offer strong upside, as explained below.
In each of my stock picks, I’m expecting the stocks to outperform the market. I don’t have a forecast of how the market will perform, so in a steeply declining market, out-performance might occur with the stock itself being down (but less than the market). Given the recent rise in the market subsequent to the election of Donald Trump, on top of several years of a substantial bull market, this risk is real. While I have had solid success at predicting certain individual stocks’ performance, I do not pride myself in being able to predict the market itself. So, consider yourself forewarned regarding potential market volatility.
We’ll start with the stock picks (with prices of stocks valid as of writing this post, January 10, all higher than the beginning of the year) and then move on to the remainder of my 10 predictions.
Tesla stock appreciation will continue to outpace the market (it is currently at $229/share). Tesla expected to ship 50,000 vehicles in the second half of 2016 and Q3 revenue came in at $2.3 billion. This equates to 100,000 vehicles and a $9.2 billion annualized run rate. The model 3 has over 400,000 units on back order and Tesla is ramping capacity to produce 500,000 vehicles in total in 2018. If the company stays on track, from a production point of view, this amounts to 5X the vehicle unit sales rate and about 3X the revenue run rate. While the model 3 is unlikely to have the same gross margins as the current products, tripling revenue should still lead to substantially more than tripling profits. Tesla remains the clear leader in electric vehicles and fully integrated automated features in an automobile. While others are looking towards 2020/2021 to deliver automated cars, Tesla is already delivering most of the functionality required. Between now and 2020 Tesla is likely to install numerous improvements and should remain the leader. Tesla also continues to have the strongest business model as it sells directly to the consumer, eliminating dealers. I also believe that the Solar City acquisition will prove more favorable than anticipated. Given these factors, I expect Tesla stock to have solid outperformance in 2017. The biggest risk is product delay and/or delivering a faulty product, but competitors are trailing by quite a bit so there is some headroom if this happens.
2. Facebook stock appreciation will continue to outpace the market (it is currently at $123/share). While the core Facebook user base growth has slowed considerably, Facebook has a product portfolio that also includes Instagram, WhatsApp and Oculus. This gives Facebook multiple opportunities for revenue growth: Improve the revenue per DAU (daily active user) on Facebook itself; begin to monetize Instagram and WhatsApp in more meaningful ways; and build the install base of Oculus. We have seen Facebook advertising rates increase steadily as more and more mainstream companies shift budget from traditional advertising to Facebook. This, combined with modest growth in DAUs, should lead to continued strong revenue growth from the Facebook platform itself. The opportunity to increase monetization on its other platforms should become more real during 2017, providing Facebook with additional revenue streams. And while the Oculus did not get out of the gate as fast as expected, it is still viewed as the premier product in VR. We believe the company will need to produce a lower priced version to drive sales into the millions of units annually. The wild card here is the “killer app”; if a product becomes a must have and is only available on the Oculus, sales would jump substantially in a short time.
3. Amazon stock appreciation will outpace the market (it is currently at $795/share). I had Amazon as a recommended stock in 2015 but omitted it in 2016 after the stock appreciated 137% in 2015 while revenue grew less than 20%. That meant my 2015 recommendation worked extremely well. But while I still believed in Amazon fundamentals at the beginning of 2016, I felt the stock might have reached a level that needed to be absorbed for a year or so. In fact, 2016 Amazon fundamentals continued to be quite strong with revenue growth accelerating to 26% (to get to this number, I assumed it would have its usual seasonally strong Q4). At the same time, the stock was only up 10% for the year. While it has already appreciated a bit since year end, it seems to be more fairly valued than a year ago, and I am putting it back on our recommended list as we expect it to continue to gain share in retail, have continued success with its cloud offering (strong growth and increased margin), leverage their best in class AI and voice recognition with Echo (see pick 10), and add more physical outlets that drive increased adoption.
4. Both Online and Offline Retailers will increasingly use an Omnichannel Approach. The line between online and offline retailers will become blurred over the next five years. But despite the continued increase in online’s share of the total, physical stores will be the majority of sales for many years. This means that many online retailers will decide to have some form of physical outlets. The most common will be “guide stores” like those from Warby Parker, Bonobos and Tesla where samples of product are in the store but the order is still placed online for subsequent delivery. We believe Amazon may begin to create several such physical locations over the next year or two. I expect brick and mortar retailers to up their game online as they struggle to maintain share. But currently, they continue to struggle to optimize their online presence, so much so that Walmart paid what I believe to be an extremely overpriced valuation for Jet to access better technology and skills. Others may follow suit. One retailer that appears to have done a reasonable job online is William Sonoma.
5. A giant piloted robot will be demo’d as the next form of Entertainment. Since the company producing it, MegaBots, is an Azure portfolio company, this is one of my easier predictions, assuming good execution. The robot will be 16 feet high, weigh 20,000 pounds and be able to lift a car in one hand (a link to the proto-type was in my last post). It will be able to shoot a paint ball at a speed that pierces armor. If all goes well, we will also be able to experience the first combat between two such robots in 2017. Actual giant robots as a new form of entertainment will emerge as a new category over the next few years.
6. Virtual and Augmented reality products will escalate. If 2016 was the big launch year for VR (with every major platform launching), 2017 will be the year where these platforms are more broadly evaluated by millions of consumers. The race to supplement them with a plethora of software applications, follow on devices, VR enabled laptops and 360 degree cameras will escalate the number of VR enabled products on the market. For every high-tech, expensive VR technology platform release, there will be a handful of apps that will expand VR’s reach outside of gaming (and into viewing homes, room design, travel, education etc.), allowing anyone with simple VR glasses connected to a smartphone to experience VR in a variety of settings. For AR, we see 2017 as the year where AR applicability to retail, healthcare, agriculture and manufacturing will start to be tested, and initial use cases will emerge.
7. Magic Leap will disappoint in 2017. Magic Leap has been one of the “aha” stories in technology for the past few years as it promised to build its technology into a pair of glasses that will create virtual objects and blend them with the real world. At the Fortune Brainstorm conference in 2016, I heard CEO Rony Abovitz speak about the technology. I was struck by the fact that there was no demo shown despite the fact that the company had raised about $1.4 billion starting in early 2014 (with a last post-money at $4.5 billion). The problem for this company is that while it may have been conceptually ahead in 2014, others, like Microsoft, now appear further along and it remains unclear when Magic Leap will actually deliver a marketable product.
8. Cable companies will see slide in adoption. Despite many thinking to the contrary, the number of US cable subscribers has barely changed over the past two years, going down from 49.9 million in Q2 2014 to 48.9 million in Q2 2016 (a 2% loss). During the same period, Broadband services subscribers (video on demand for Netflix, Hulu and others) increased about 12% to 57.0 million. Given the extremely high price of cable, more people (especially millennials) are shifting to paying for what they want at considerably less cost so that the rate of erosion of the subscriber base should continue and may even accelerate over the next few years. I expect to see further erosion of traditional TV usage as well, despite the fact that overall media usage per day is rising. The reason for lower TV usage is the shift people are making to consuming media on their smart phones. This shift is much broader than millennials as every age group is increasing their media consumption through their phones.
9. Spotify will either postpone its IPO or have a disappointing one. In theory, valuation of a company should be calculated based on future earnings flows. The problem for evaluating companies that are losing money is that we can only use proxies for such flows and often wind up using them to determine a multiple of revenue that appears appropriate. To do this I first consider gross margin, cost of customer acquisition and operating cost to determine a “theoretic potential operating profit percentage” that a company can reach when it matures. I believe the higher this is, the higher the multiple and similarly the higher the revenue growth rate, the higher the multiple. When I look at Spotify numbers for 2015 (2016 financials won’t be released for several months) it strikes me (and many others) that this is a difficult business to make profitable as gross margins were a thin 16% based on hosting and royalty cost. Sales and marketing (both of which are variable costs that ramp with revenue) was an additional 12.6% leaving only 3.4% before G&A and R&D (which in 2015 were over 13% of revenue). This combination has meant that scaling revenue has not improved earnings. In fact, the 80% increase in revenue over the prior year still led to higher dollars in operating loss (about 9.5% of revenue). Unless the record labels agree to lower royalties substantially (which seems unlikely) its appears that even strong growth would not result in positive operating margins. If I give them the benefit of the doubt and assume they somehow get to 2% positive operating margin, the company’s value ($8 billion post) would still be over 175X this percent of 2015 revenue. If Spotify grew another 50% in 2016, the same calculation would bring the multiple of theoretical 2016 operating margin to about 120X. I believe it will be tough for them to get an IPO valuation as high as their last post if they went public in Q2 of this year as has been rumored.
10. Amazon’s Echo will gain considerable traction in 2017. The Echo is Amazon’s voice-enabled device that has built-in artificial intelligence and voice recognition. It has a variety of functions like controlling smart devices, answering questions, telling jokes, playing music through Sonos and other smart devices and more. Essentially an app for it is called a “skill”. There are now over 3,000 of these apps and this is growing at a rapid rate. In the first 12 months of sales, a consulting firm, Activate, estimated that about 4.4 million were sold. If we assume an average price of about $150, this would amount to over $650 million to Amazon. The chart below shows the adoption curve for five popular devices launched in the past. Year 1 unit sales for each is set at 1.0 and subsequent years show the multiple of year 1 volume that occurred in that year. As can be seen from the chart, the second year ranged from 2x to over 8X the first year’s volume and in the third year every one of them was at least 5 times the first year’s volume. Should the Echo continue to ramp in a similar way to these devices, its unit sales could increase by 2-3X in 2017 placing the device sales at $1.5-2.0 billion. But the device itself is only one part of the equation for Amazon as the Echo also facilitates ordering products, and while skills are free today, some future skills could entail payments with Amazon taking a cut.
Samsung FamilyHub Fridge: manage groceries, family scheduling, display photos and play music through a wifi enabled touchscreen
In my post for top 10 predictions for 2016 I noted how lucky I had been for 3 years running as all my picks seemed to work. I pointed out that all winning streaks eventually come to an end. I’m not sure if this constitutes an end to my streak but in my forecasts for 2016 I was wrong with one of the three stock picks (GoPro) and also missed on one of my seven forecasts of industry trends (that the 2016 political spend would reach record levels). My other 2 stock picks and other 6 trend forecasts did prove accurate.
I’ve listed in bold the 2016 stock picks and trend forecasts below and give a personal evaluation of how I fared on each. For context, the S&P was up 7.5% and the Nasdaq 10.0% in 2016.
1. Facebook stock appreciation will continue to outpace the market (it is currently at $97/share). One year later (January 3) Facebook opened at $117.50, a year over year gain of 21.1% from the time of my blog post. While this was short of the 40% gain in 2015, it still easily outpaced the market.
2. Tesla stock appreciation will continue to outpace the market (it is currently at $193/share). One year later, Tesla shares opened at $219.25 (January 3), a 13.5% gain from the time of my blog post. It might have been higher but the acquisition of Solar City created headwinds for the stock as revenue grew well over 100%, gross profit improved and in Q3 (last reported quarter) EBITDA was positive. Still, it outperformed the market.
3. GoPro stock appreciation should outpace the market in 2016 (shares are currently at $10.86). This pick was a clear miss as the stock declined 17.1% from the time of the blog post to January 3. In my defense, I had it partly right as the stock peaked at $17/share at the time of the drone and new camera announcements. In retrospect, given GoPro’s history of poor execution, I would have been smarter to recommend selling at the time these were announced. Instead, I mistakenly viewed execution as pretty easy and failed to suggest this. Since the company, once again, had an execution misstep, I was proven wrong and the stock subsequently declined.
The remaining predictions were about industry trends rather than stocks.
4. UAV/Drones will continue to increase in popularity. Drones continued to increase in popularity at the end of 2015 and into the first half of 2016. According to Market Watch, drone sales were up over 200% in April of 2016 as compared with April of 2015. Starting in December of 2015, the government began requiring drone operators to register on a federal database and by December 2016 had registered over 600,000 drones and users.
5. Political spend will reach record levels in 2016 and have a positive impact on advertising revenue. This forecast proved incorrect. Donald Trump won the presidency despite raising less money than any major party presidential candidate since 2008. Hillary Clinton, raised nearly twice as much as Trump, but still fell short of what President Obama raised in 2012. In the case of President-Elect Trump, more than half of his small raise consisted of $66 million he personally donated to his campaign and $280 million from donors giving $200 or less. Mrs. Clinton, despite depicting Trump as the candidate of the rich, received a substantial portion of her donations from wealthy individuals. The two candidates raising less money meant that the size of the boost in advertising from political ads fell short of my prediction.
6. Virtual/Augmented Reality will have a big year in 2016. As expected, 2016 was the big launch year for VR and AR. Highly anticipated VR product launches (the Facebook Oculus Rift in March, the HTC Vive in April and the PlayStation VR in October) showed strong consumer interest with sales of over 1.5M units. Pokemon Go’s 500M + downloads and the initial release of Microsoft’s Hololense generated intense interest in AR, creating a flurry of application development across a variety of industries including healthcare, agriculture, manufacturing and retail. Unsurprisingly, this excitement is mirrored in VC investment dollars, with a 140% growth in funding over 2015, bringing the total amount invested this past year to $1.8 Bn. This shows a strong trajectory for more development across gaming and commercial applications in AR / VR as we move into 2017.
7. Robotic market will expand to new areas in 2016. From chatbots being introduced by many companies for interacting with customers, to a giant fighting robot (16 foot tall, 20,000 pounds) that can lift and throw a car, to robots for making pizzas, to robots that help educate kids, 2016 was a year of enormous expansion in the robotics market.
8. A new generation of automated functionality will begin to be added to cars. In 2016 autonomous cars moved from concept to closer to reality. To date, the technology leaders appeared to be Tesla and Google, the former building a fully integrated product, the latter a set of components that can be integrated into many different vehicles. Tesla, who appears to be furthest along in putting a fully autonomous car on the road in volume, added more components (software and sensors) to its autonomous technology but suffered a setback when a driver ignored Tesla requirements to “supervise” the autonomous driving and suffered a fatal accident. Autonomous cars took many steps forward in 2016 as additional companies entered the fray. Uber, a company that has much to gain from driverless cars (like eliminating the need for its over 1 million drivers), began an experiment in Pittsburg to offer driverless cars (supervised by an actual person in the driver’s seat) as part of its service. These cars are being manufactured in a partnership with Volvo using technology created by Carnegie Robotics (who’s founder was one of the creators of the Google technology). Uber also acquired Otto, a startup focused on driverless trucks, to gain further technology. In August, Ford announced its intent to bring an autonomous car to market by 2021. Audi just announced a partnership with Nvidia to bring an autonomous car to the road by 2020-21. Toyota, Chrysler and others have also announced intent to create such a vehicle. While I believe that the actual mass usage of driverless cars will be further out then 2021, we seem to be close to a breakout of “supervised automated vehicles”.
9. The Internet of Things will expand further into kitchen appliances and will start being adopted by the average consumer. In the past 12 months Samsung, LG, GE and others have launched numerous smart refrigerators. These can now be thought of as devices that can connect to a smart phone through an app. The user can receive alerts like ‘a water filter needs replacing’ or ‘the door was left open’. Some have digital bulletin boards on the fridges, other features can let you know when various items stored in the fridge are running low, and still more features can be deployed to control functionality (change temperature, etc). The adoption of these devices has reached sufficient levels for them to be carried in mainstream stores like Best Buy.
10. Amazon will move to profitability on their book subscription service and improve cloud capex. Amazon did indeed make three major shifts in its book subscription strategy. First, it significantly reduced payouts to publishers for their books that were downloaded; second, it reduced the proportion of third party published books offered to subscribers to the service and third it reduced the amount it pays their own authors. While Amazon does not report these numbers, I believe this combination has reduced the cost to Amazon by over 50% and has made the service profitable. The gross margin before stock based compensation for Amazon’s cloud service increased year over year in Q3 (last reported quarter) from 27.1% in 2015 to 31.6% in 2016.
While it wasn’t in my Top 10 post for 2016, I did predict that Kevin Durant would sign with the Warriors as he would fit right in and improve his chances of winning championships. He has signed, seems to fit in well, but we’ll have to wait to see if the championships follow.
I’ll be making my 2017 picks within the next week.